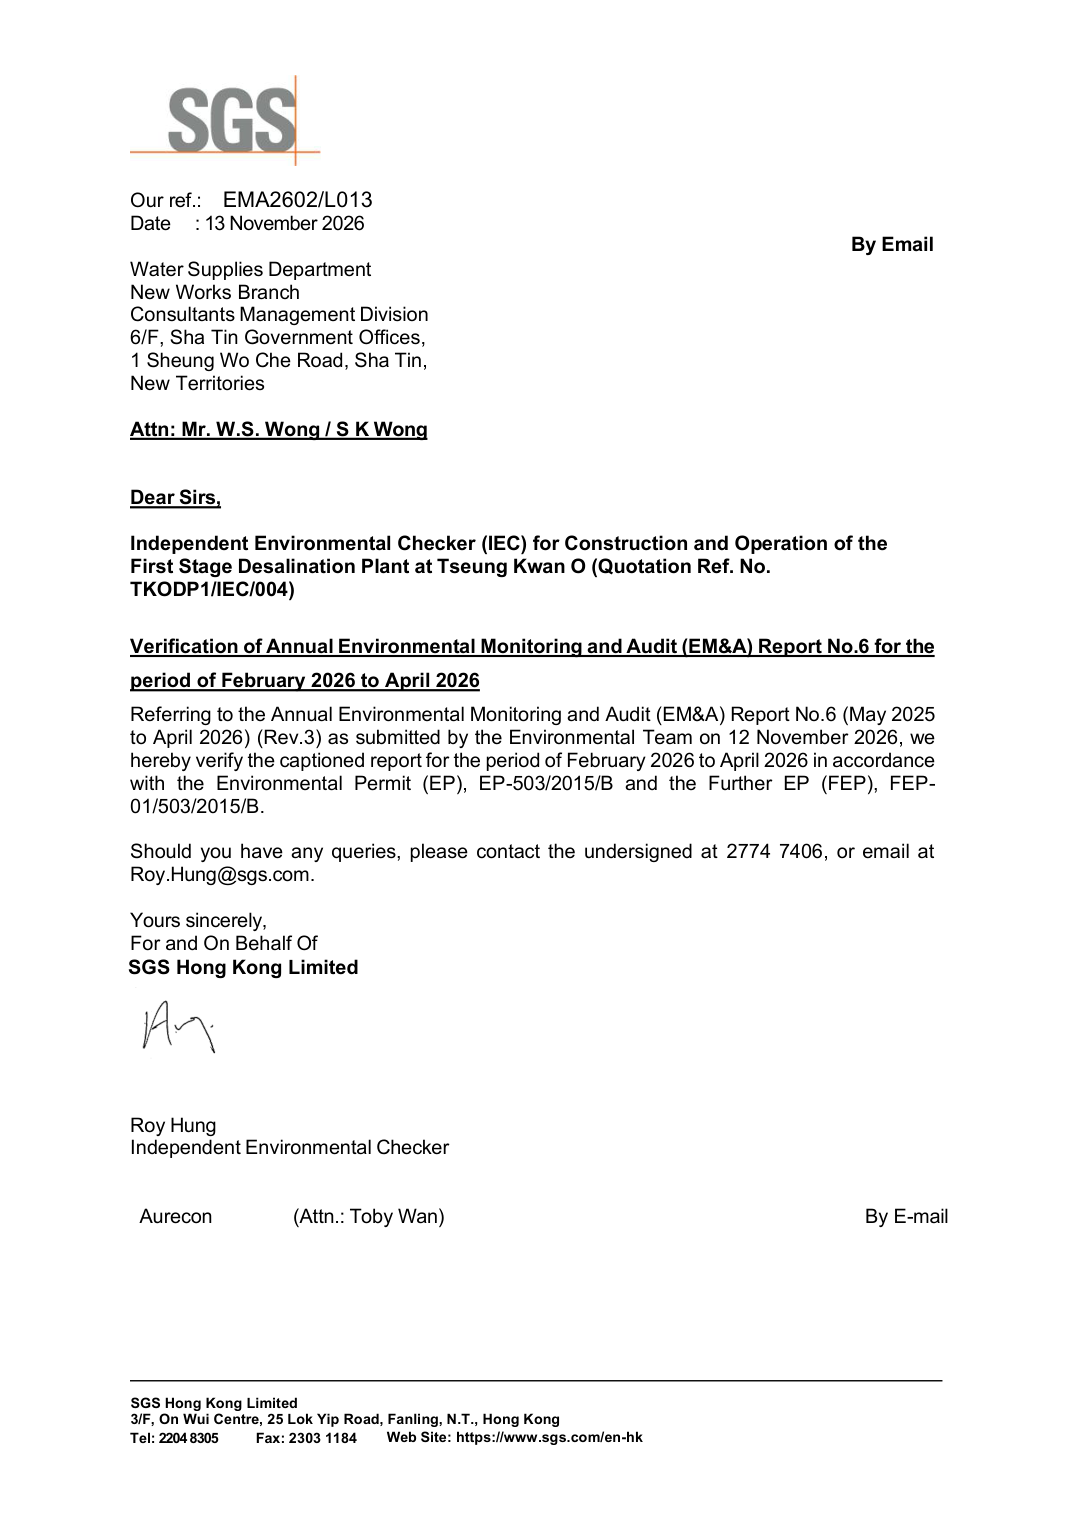
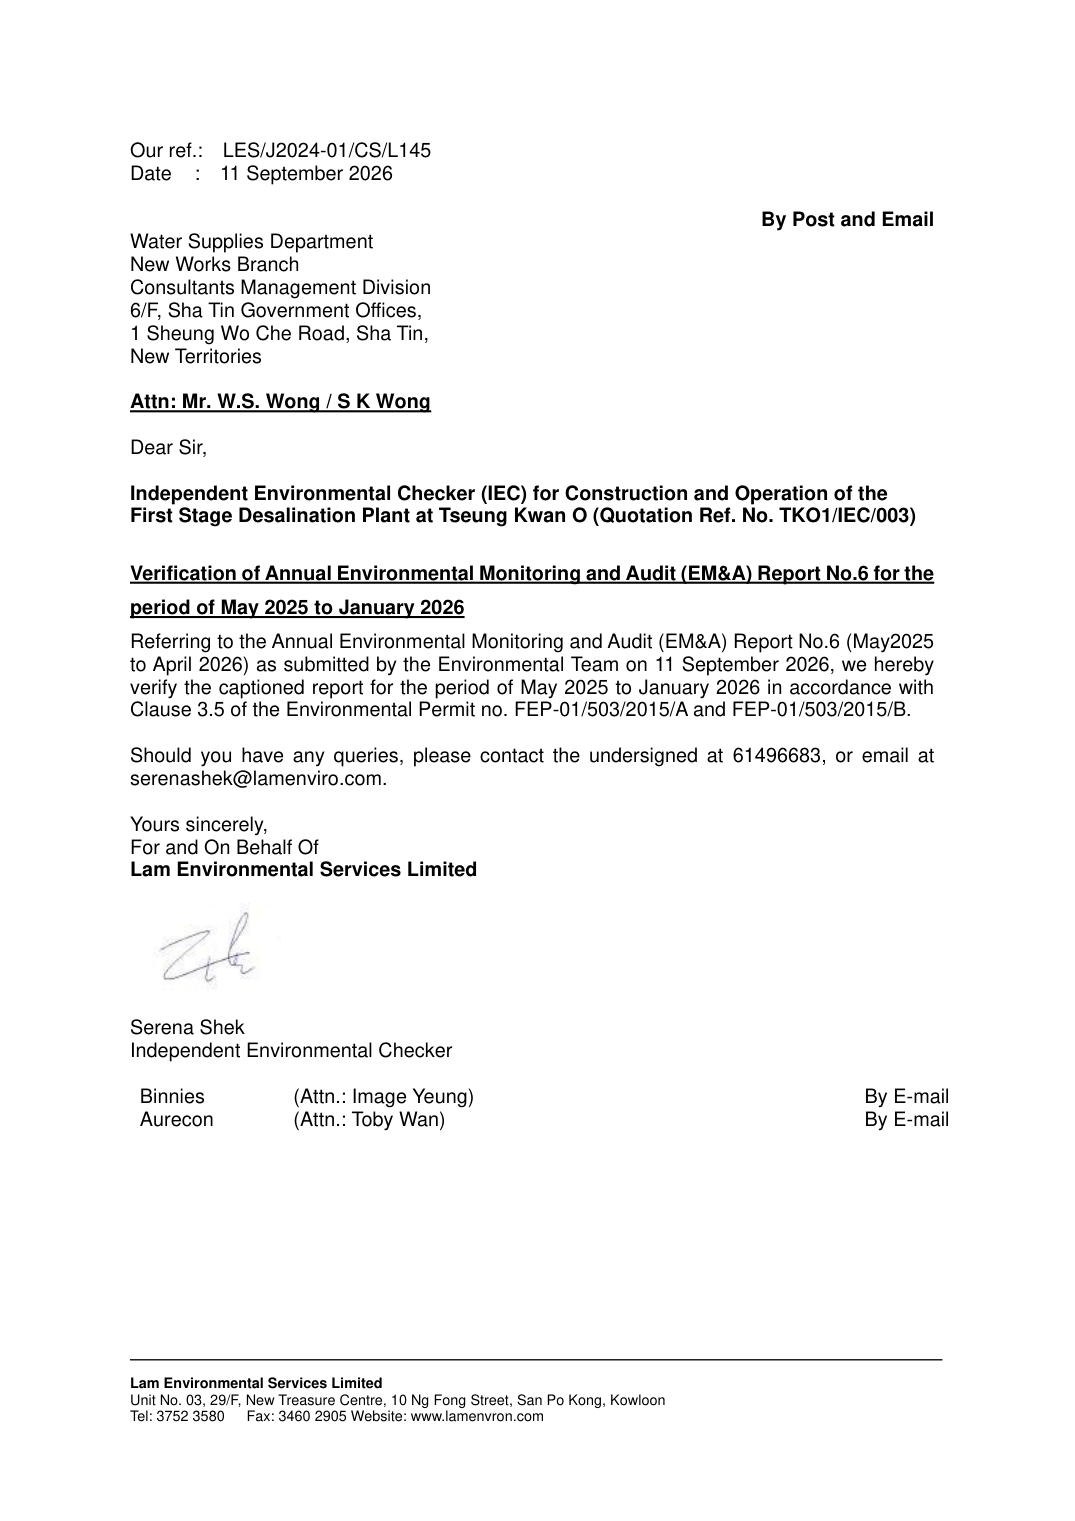
REVISION HISTORY
REV. | DESCRIPTION OF MODIFICATION | DATE |
0. | First Issue | 9/08/2026 |
1. | Second Issue | 8/09/2026 |
2. | Third Issue | 10/09/2026 |
3. | Fourth Issue | 11/09/2026 |
CONTENTS
Executive Summary 4
1. Basic Contract Information 7
2. Water Quality 11
3. Waste 19
4. Landfill Gas Monitoring 20
5. Ecology (Coral Monitoring) 24
6. Ecology (Fishery Monitoring) 26
7. Summary of Exceedance, Complaints, Notification of Summons and Prosecutions 29
8. EM&A Site Inspection 31
9. Conclusions and Recommendations 32
Appendix A Overview of Desalination Plant in Tseung Kwan O
Appendix B Summary of Implementation Status of Environmental Mitigation
Appendix C Water Quality Graphical Presentation
Appendix D Site Inspection Proforma
Appendix E Waste Flow Table
Appendix F Summary of Exceedances
Appendix G Complaint Log
Appendix H Event/Action Plan for Noise and Water Quality Monitoring Exceedance
EXECUTIVE SUMMARY
INTRODUCTION
A1. The Project, Design, Build and Operate First Stage of Tseung Kwan O Desalination Plant (TKODP), is a Designated Project under the Environmental Impact Assessment Ordinance (Cap. 499) (EIAO) and is currently governed by a Further Environmental Permit (EP No. FEP – 01/503/2015/A and EP No. FEP – 01/503/2015/B) for the construction and operation of the Contract.
A2. In accordance with the Environmental Monitoring and Audit (EM&A) Manual for the Contract, EM&A works for marine water quality, noise, waste management and ecology should be carried out by Environmental Team (ET), Aurecon Hong Kong Limited (Aurecon), during the operation phase of the Contract.
A3. This is the 6th Annual EM&A Review Report, prepared by ASCL, for the Contract summarizing the monitoring results and audit findings of the EM&A programme at and around Tseung Kwan O Area 137 (TKO 137) during the reporting period from 1 May 2025 to 30 April 2026.
A4. The EM&A programme for this contract has covered environmental monitoring and Contractor’s environmental performance auditing in the aspects of dust, noise, water quality, landfill gas, waste management, landscape and visual and ecology.
SUMMARY OF ENVIRONMENTAL MONITORING AND AUDIT WORKS
A5. A summary of the environmental monitoring and audit works undertaken in the reporting period are summarized in Table I.
Table I Summary of Environmental Monitoring Works
Environmental Monitoring works | Frequency |
Operation Phase Water Quality Monitoring | 130 |
Operation Phase Coral Monitoring | 10 |
Operation Phase Fishery Monitoring | 4 |
Operation Phase Landfill Gas Monitoring | 11 |
Environmental Site Inspection | 52 |
A6. Operation Phase Impact Water Quality Monitoring was conducted from 1 May 2025 and completed on 30 June 2025. A total of three (3) action level exceedances and eleven (11) limit level exceedances of SS were recorded. Summary of exceedances could be referring to Appendix G.
A7. The continuous monitoring of effluent quality was conducted from 1 May 2025 to 31 July 2025. No exceedance of the sampling was obtained during the reporting period.
A8. According to the approved proposal to change the operation phase EM&A programme for the 2nd to 10th year, continuous monitoring of effluent quality was discontinued and replaced with effluent water monitoring in compliance with discharge license requirements starting from 15 August 2025.
A9. Weekly in-situ monitoring and monthly laboratory measurements of the effluent quality were conducted from September 2025 to April 2026. No exceedance of the results was obtained during the reporting period. The detail results can be referred to the Monthly EM&A Report.
A10. Monthly operational landfill gas monitoring was conducted from 1 May 2025 to 31 July 2025.
A11. According to the approved proposal to change the operation phase EM&A programme for the 2nd to 10th year, landfill gas monitoring will be conducted on a six-month basis starting from August 2025.
A12. A total of five (5) landfill gas monitoring was conducted during the reporting period. No exceedances of the Action or Limit Levels were recorded during the reporting period.
A13. According to the approved proposal to change the operation phase EM&A programme for the 2nd to 10th year, coral monitoring will be conducted on a quarterly basis starting from August 2025.
A14. A total of six (6) operation phase coral monitoring was conducted. There were no AL/LL exceedances observed during the reporting period.
A15. Four (4) operation phase fishery monitoring were conducted during the reporting period. For wet season was carried out in 16 and 23 August 2025 and for dry season was carried out in 7 and 15 February 2026. No AL/LL exceedance was recorded during the reporting period.
COMPLAINT HANDLING AND PROSECUTION
A16. No environmental complaint, notifications of summons and prosecution was received during the reporting period.
REPORTING CHANGE
A17. According to the contractor's information, the Anti-scalant dosage commenced on 10 April 2025. The Anti-scalant water quality test was also conducted starting from the same date.
A18. The works of TKODP were substantially completed on 30 June 2024 and the plant commenced the operation phase on 1 July 2024. A Justification of Termination of the EM&A Programme for the Construction Phase was resubmitted to the EPD on 11 August 2025 and approved by the EPD on 15 August 2025.
A19. A proposal to change the operation phase EM&A programme was submitted to the EPD on 11 August 2025 and approved by the EPD on 15 August 2025.
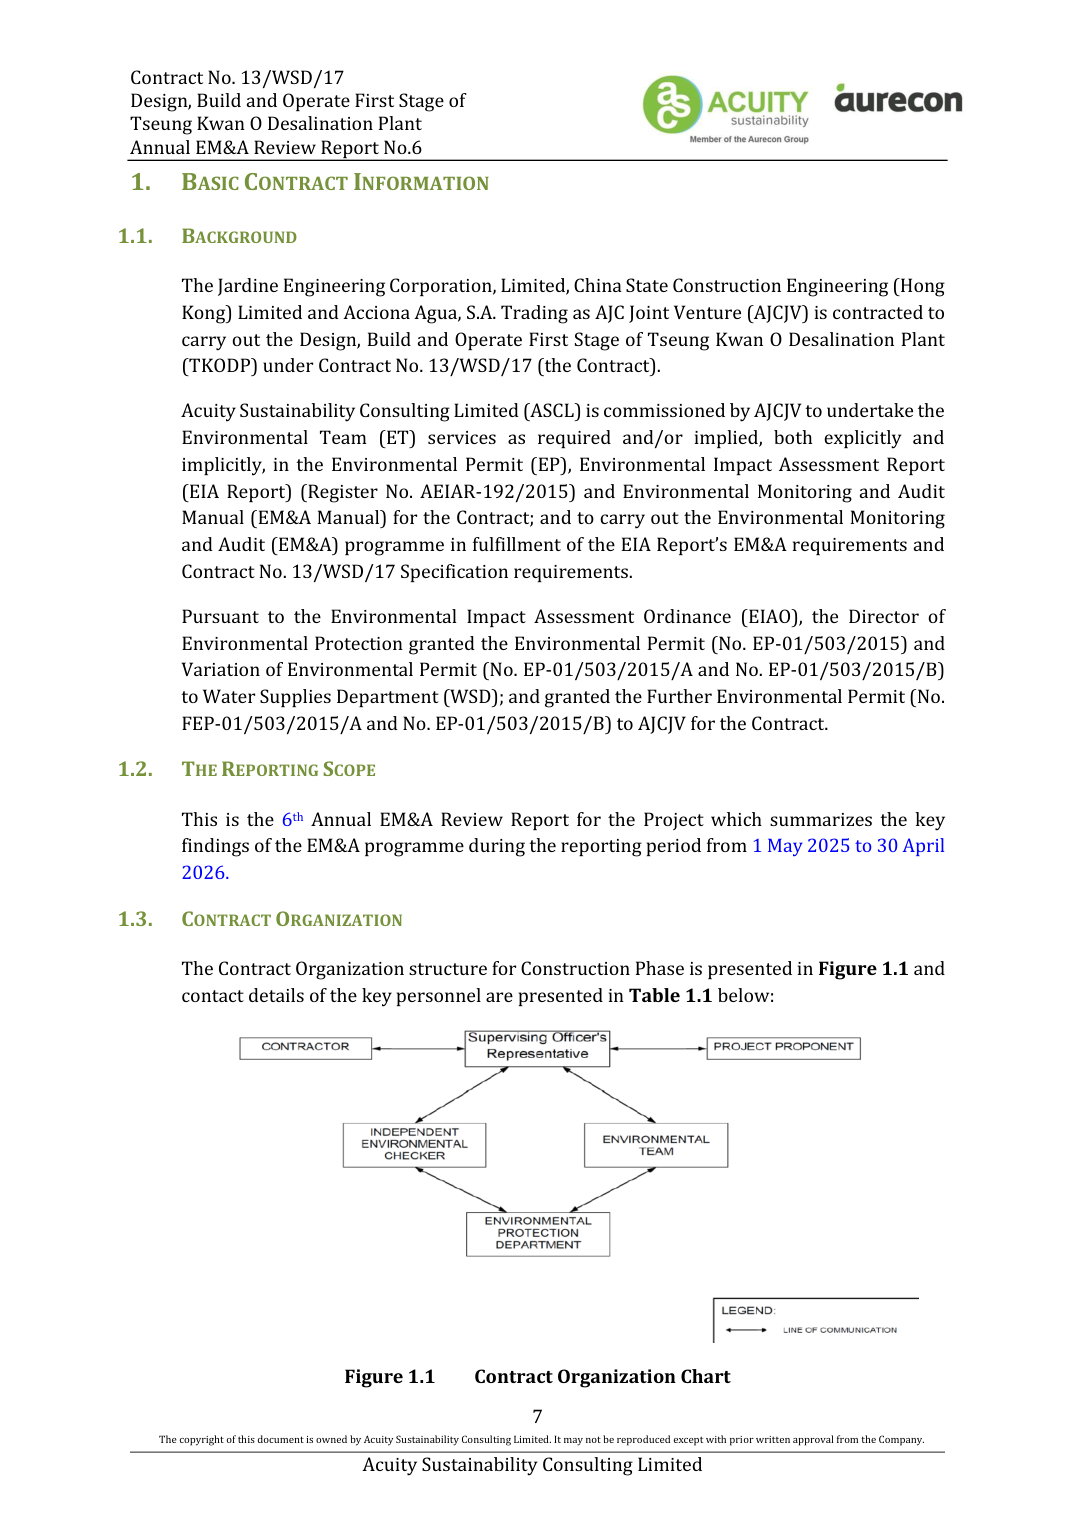
Table 1.1 Contact Details of Key Personnel
Party | Position | Name | Telephone | Remark |
Project Proponent | SE/CM2 | Milton Law | 2634-3573 | - |
Supervising Officer | Project Manager | Augustine Li | 2608-7671 | - |
Senior Resident | Mason Pau | 6765-4131 | - | |
The Jardine Engineering | Project Manager | Arnes, Parra, | 6468-6710 | - |
Environmental | Tommy Law | 6468-1782 | - | |
Aurecon Hong Kong | Environmental Team | Toby Wan | 9719-5422 | - |
Lam Environmental | Independent | Serena Shek | 6149-6683 | Until 31 January |
SGS Hong Kong Limited | Independent | Roy Hung | 2774-7406 | Started from 1 |
1.4. SUMMARY OF OPERATION WORKS
Detail of the major operation activities undertaken could be referred to Section 1.8 in each monthly EM&A Report.
The status for all environmental aspects is presented in Table 1.2.
Table 1.2 Summary of Status for Key Environmental Aspects under the EM&A Manual
Parameters | Status |
Water Quality | |
Baseline Monitoring under EM&A | The baseline water quality monitoring was conducted |
Construction Phase Marine Impact | Ceased from 1 September 2023 |
Pre-Operation Phase Marine Impact | Ceased from 30 June 2024 |
Operation Phase Marine Impact | Completed on 30 June 2025 |
Parameters | Status |
Impact Monitoring of Effluent Discharge | Complete in November 2023 and December 2024 |
Continuous Monitoring of Effluent | Ceased from 15 August 2026 |
Monthly Effluent Quality Monitoring | On-going |
Noise | |
Baseline Monitoring | The baseline noise monitoring result has been |
Impact Monitoring | Completed |
Landfill Gas | |
Regular Monitoring when construction | According to the Contractors, all pits or trenches were |
Monthly Monitoring for buildings, | According to the approved proposal to change |
Six-month Basis Monitoring for | On-going |
Ecology (Coral) | |
Pre-operation phase Regular Coral | Completed |
Operation phase Regular Coral | According to the approved proposal to change |
Operation phase Regular Coral | On-going |
Ecology (Fishery) | |
Pre-operation phase Regular Fishery | Completed |
Operation phase Regular Fishery | On-going |
Waste Management | |
Mitigation Measures in Waste | On-going |
Ecology (Landscape) | |
Pre-operation phase Landscape and | Completed |
Operation phase Landscape and Visual | According to the approved proposal to change |
Environmental Audit | |
Site Inspection covering Measures of Air | On-going |
Other than the EM&A work by ET, environmental briefings, trainings and regular environmental management meetings were conducted, in order to enhance environmental awareness and closely monitor the environmental performance of the contractors.
The EM&A programme has been implemented in accordance with the recommendations presented in the approved EIA Report and the EM&A Manual. A summary of implementation status of the environmental mitigation measures for the Contract during the reporting period is provided in Appendix B.
2. WATER QUALITY
In accordance with the recommendations of the EIA, water quality EM&A is required during dredging for the submarine pipelines and, during operation phase. In addition, baseline water quality monitoring was prior to the commencement of marine construction activities.
The following Section provides details of the water quality monitoring to be undertaken by the Environmental Team (ET) to verify the distance of sediment and brine plume dispersion and to identify whether the potential exists for any indirect impacts to occur to ecological sensitive receivers.
Water quality monitoring for the Contract can be divided into the following stages:
Dredging activities during construction phase;
⚫
Discharge of effluent from main disinfection during construction phase;
⚫
Pre-operation – before operation phase
⚫
Operation phase – first year upon commissioning; and,
⚫
Continuous monitoring of effluent quality (Operation phase)
⚫
In addition, the marine works contractor is required to complete a silt curtain efficiency test for the combined use of floating silt curtain type and cage type silt curtain for dredging at seawater intake to confirm the silt curtain reduction efficiency assumptions of the assessment. The details of testing plan together with the silt curtain deployment plan shall be submitted by the ET to seek approval from the IEC and EPD.
2.1. WATER QUALITY PARAMETERS
Marine Water Quality Monitoring The parameters that have been selected for measurement in situ and in the laboratory are those that were either determined in the EIA to be those with the most potential to be affected by the construction works or are a standard check on water quality conditions. Parameters to be measured in the impact water quality monitoring are listed in Table 2.1.
Table 2.1 Parameters measured in the impact marine water quality monitoring
Parameters | Unit | Abbreviation | Stage | |
Operation | ||||
In-situ measurements | ||||
Dissolved oxygen | mg/L | DO | 🗸 | |
Temperature | oC | - | 🗸 | |
pH | - | - | 🗸 | |
Turbidity | NTU | - | 🗸 | |
Salinity | 0/00 | - | 🗸 | |
Total Residual Chlorine | mg/L | TRC | 🗸 |
Parameters | Unit | Abbreviation | Stage | |
Operation | ||||
Laboratory measurements | ||||
Suspended Solids | mg/L | SS | 🗸 | |
Iron | mg/L | Fe | 🗸 |
In addition to the water quality parameters, other relevant data were measured and recorded in Water Quality Monitoring Logs, including the location of the sampling stations, water depth, time, weather conditions, sea conditions, tidal stage, current direction and velocity, special phenomena and work activities undertaken around the monitoring and works area that may influence the monitoring results.
b) Continuous Monitoring of Effluent Quality
The monitoring requirement for the continuous effluent quality monitoring shall be conducted in accordance with the effluent parameters and standards stipulated by the Water Pollution Control Ordinance Discharge License (No.: WT00044188-2023) conditions. Details derived limit levels for water quality are presented in Table 2.2.
c) Monthly Effluent Monitoring (Water Discharge License)
In accordance with the WT00044188-2023 Part 1, the sampling should be followed the specified frequency, and the parameters of the sample should not be exceeded the limit stated as the water discharge license. Details derived limit levels for water quality are presented in Table 2.2.
Table 2.2 Parameters measured in the Continuous Monitoring of Effluent Quality
Parameters | Unit | Abbreviation |
In-situ measurements | ||
Temperature | oC | - |
pH | pH | - |
Salinity | 0/00 | - |
Total Residual Chlorine | mg/L | TRC |
Laboratory measurements | ||
Suspended Solids | mg/L | SS |
Iron-Soluble | mg/L | Fe |
Total Inorganic Nitrogen | mg/L | - |
Total Phosphorus | mg/L | - |
Sodium Metabisulphite | mg/L | SMBS |
Anti-scalant as Reactive Phosphorus * | mg/L | PO4 as P- |
*Remark: Anti-scalant water quality testing will only be conducted whenever anti-scalant dosage is adopted.
Table 2.3 Derived Limit Levels for Water Quality
Parameters | Limit |
Monitoring of Effluent Quality | |
Flow Rate in m3/day | 216841 |
Temperature in °C | Maximum 40 |
Salinity | 71347 |
SS in mg/L | 13 |
pH | 6-9 |
Iron in mg/L | 0.6 |
Total residual chlorine in mg/L | 0.1 |
Total Inorganic Nitrogen in mg/L | 2 |
Total Phosphorous in mg/L | 1 |
Sodium Metabisulphite in mg/L | 0.5 |
Anti scalant in mg/L* | 2.2 |
*Remark:
1. Anti-scalant water quality testing will only be conducted whenever anti-scalant dosage is adopted.
2.2. MONITORING EQUIPMENT
The monitoring methodology, monitoring equipment and QA/QC procedure could refer to the Monthly EM&A Report.
2.3. MONITORING LOCATION
Marine Water Quality Monitoring The water quality monitoring locations are in accordance with the EM&A Manual and detailed in Table 2.3 and Figure 2.1 below.
Table 2.3 Location of Impact Water Quality Monitoring Station
Station | Easting | Northing | Description |
CE | 843550 | 815243 | Upstream control station at ebb tide |
CF | 846843 | 810193 | Upstream control station at flood tide |
WSR1 | 846864 | 812014 | Ecological sensitive receiver at Tung Lung Chau |
WSR2 | 847645 | 812993 | Fisheries sensitive receiver at Tung Lung Chau |
WSR3 | 848023 | 813262 | Ecological sensitive receiver at Tung Lung Chau |
WSR4 | 847886 | 814154 | Ecological sensitive receiver at Tai Miu Wan |
WSR16 | 845039 | 815287 | Ecological sensitive receiver at Fat Tong Chau |
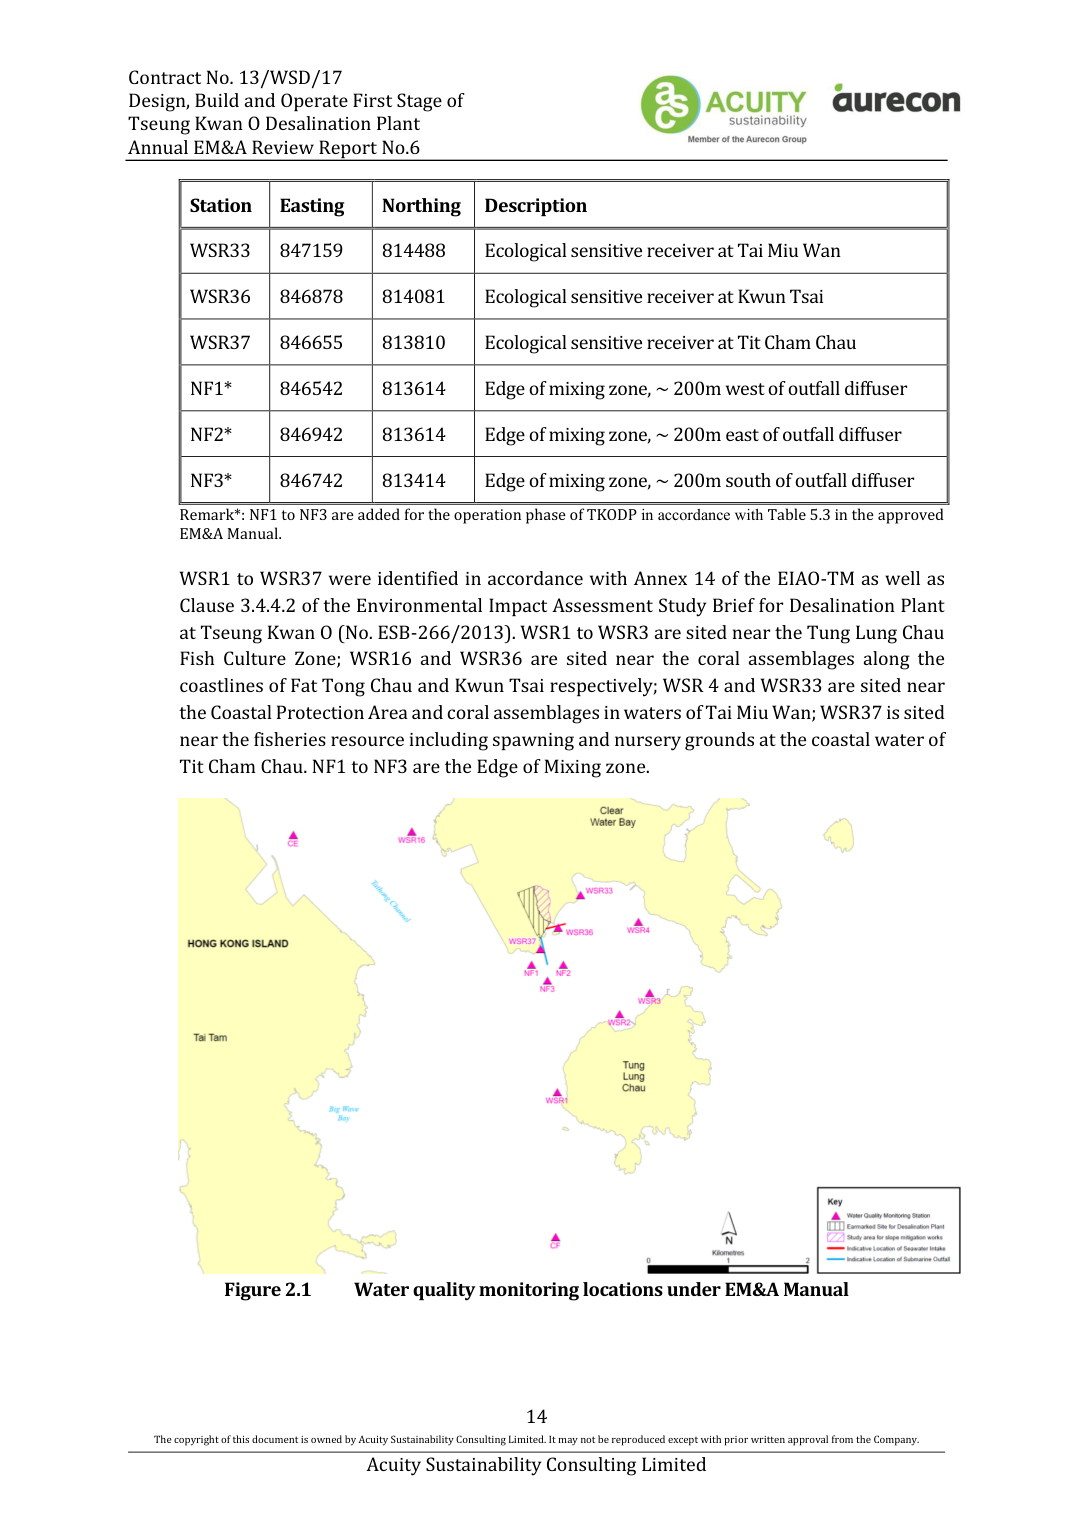
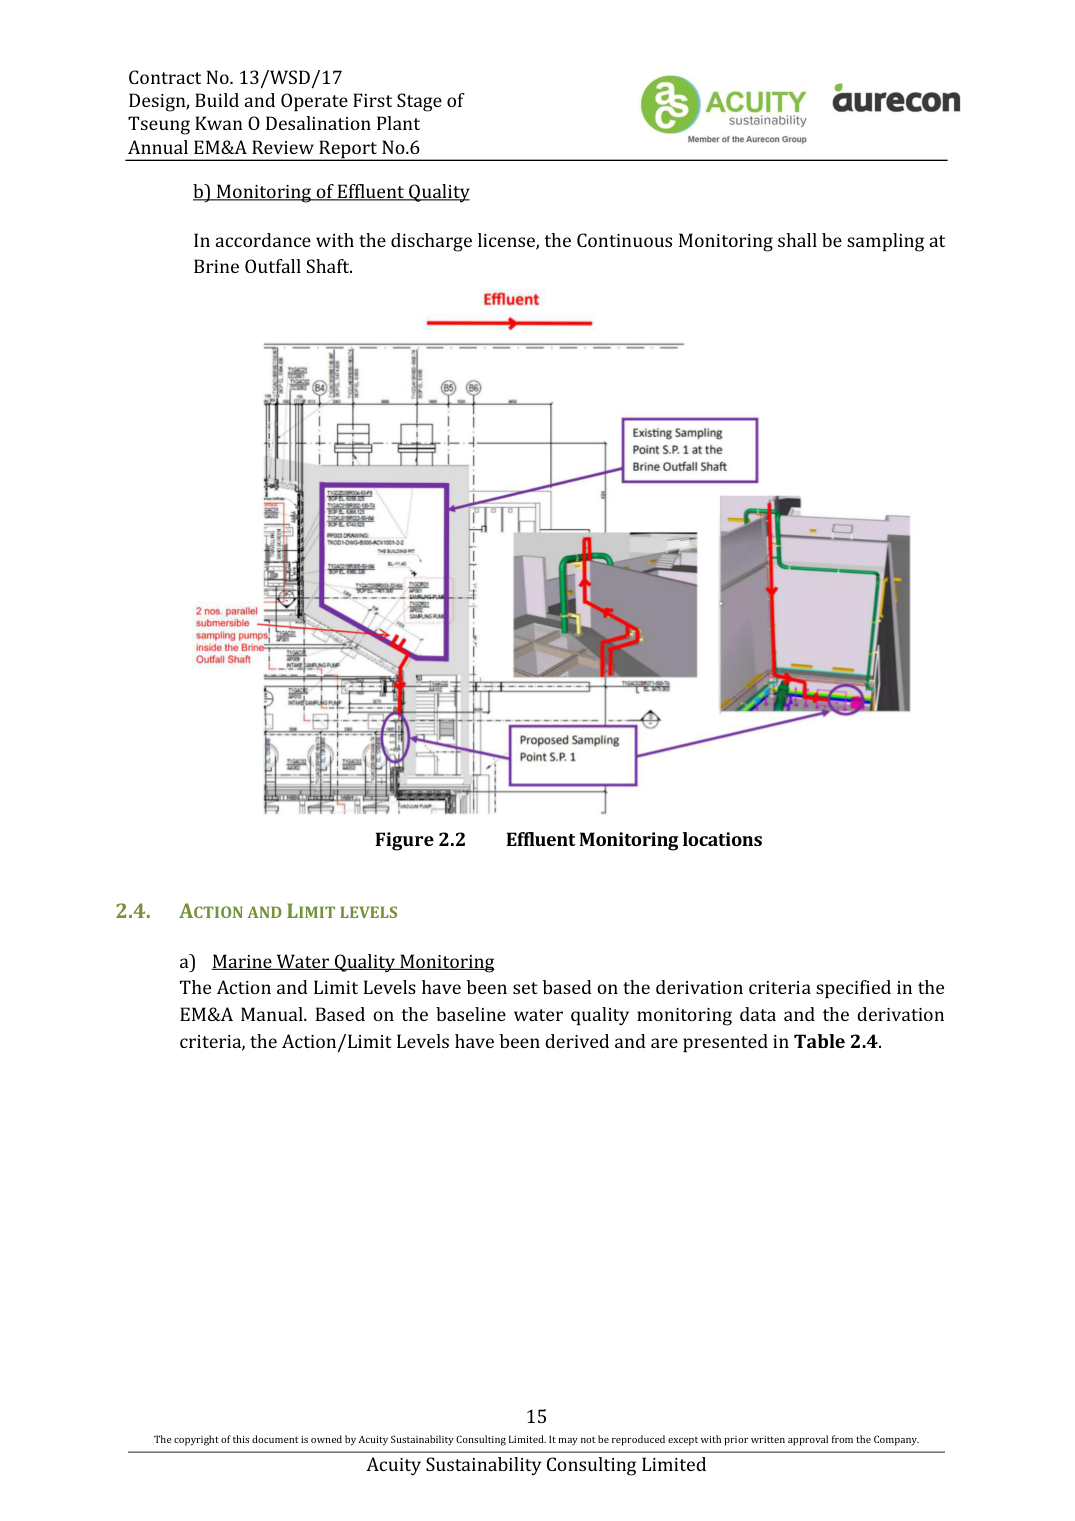
Table 2.4 Derived Action and Limit Levels for Water Quality
Parameters | Action | Limit |
Marine Water Quality Monitoring | ||
DO in mg/L | Surface and Middle | Surface and Middle |
SS in mg/L | 5.00 mg L-1 or 20% exceedance of | 6.00 mg L-1 or 30% exceedance of value |
Turbidity in | 2.41 NTU or 20% exceedance of | 2.84 NTU or 30% exceedance of value |
Salinity in PSU | 34.25 PSU or 9% exceedance of | 34.56 PSU or 10% exceedance of value |
Iron in mg/L | 0.3 mg/L | 0.3 mg/L |
Total residual | 0.01 mg/L | 0.01 mg/L |
Total residual | 0.1 mg/L | 0.1 mg/L |
Notes:
i. "Depth-averaged" is calculated by taking the arithmetic means of reading of all three depths.
ii. For DO, non-compliance of the water quality limits occurs when monitoring result is lower than the limits. iii. For Turbidity, SS, iron and Salinity, non-compliance of the water quality limits occurs when monitoring result is higher than the limits.
iv. For the Action and Limit Levels adopted during First-year Operation Phase Monitoring, further review would be made according to the EM&A Manual during Operation Phase.
v. Monitoring of Total Residual Chlorine (Disinfection) will be conducted when cleaning and sterilization of the new freshwater main is carried out.
vi. Monitoring of Iron and Total Residual Chlorine were conducted during the pre-operation phase.
b) Monitoring of Effluent Quality
Table 2.5 Derived Limit Levels for Water Quality
Parameters | Limit |
Continuous Monitoring of Effluent Quality | |
Flow Rate in m3/day | 216841 |
Temperature in °C | Maximum 40 |
Salinity | 71347 |
SS in mg/L | 13 |
pH | 6-9 |
Iron in mg/L | 0.6 |
Total residual chlorine in mg/L | 0.1 |
Total Inorganic Nitrogen in mg/L | 2 |
Total Phosphorous in mg/L | 1 |
Sodium Metabisulphite in mg/L | 0.5 |
Anti scalant in mg/L* | 2.2 |
*Remark:
1. Anti-scalant water quality testing will only be conducted whenever anti-scalant dosage is adopted.
2.5. MONITORING PROGRAMME
Marine Water Quality Monitoring The ET of the Contract conducted the operation phase marine water quality monitoring between 1 May 2025 and 30 June 2025 at the thirteen designated monitoring stations near TKO in accordance with the EM&A Manual and Contract Specification.
2.6. MONITORING RESULTS AND OBSERVATIONS
Operation Phase The first-year operation phase marine water quality monitoring was carried out during the reporting period, the monitoring was conducted at the thirteen monitoring stations (CE, CF, WSR1, WSR2, WSR3, WSR4, WSR16, WSR33, WSR36, WSR37, NF1, NF2 and NF3). The Action and Limit Level would be referred to the approved EM&A Manual Table 5.4 Firstyear Operation Phase Marine Water Monitoring.
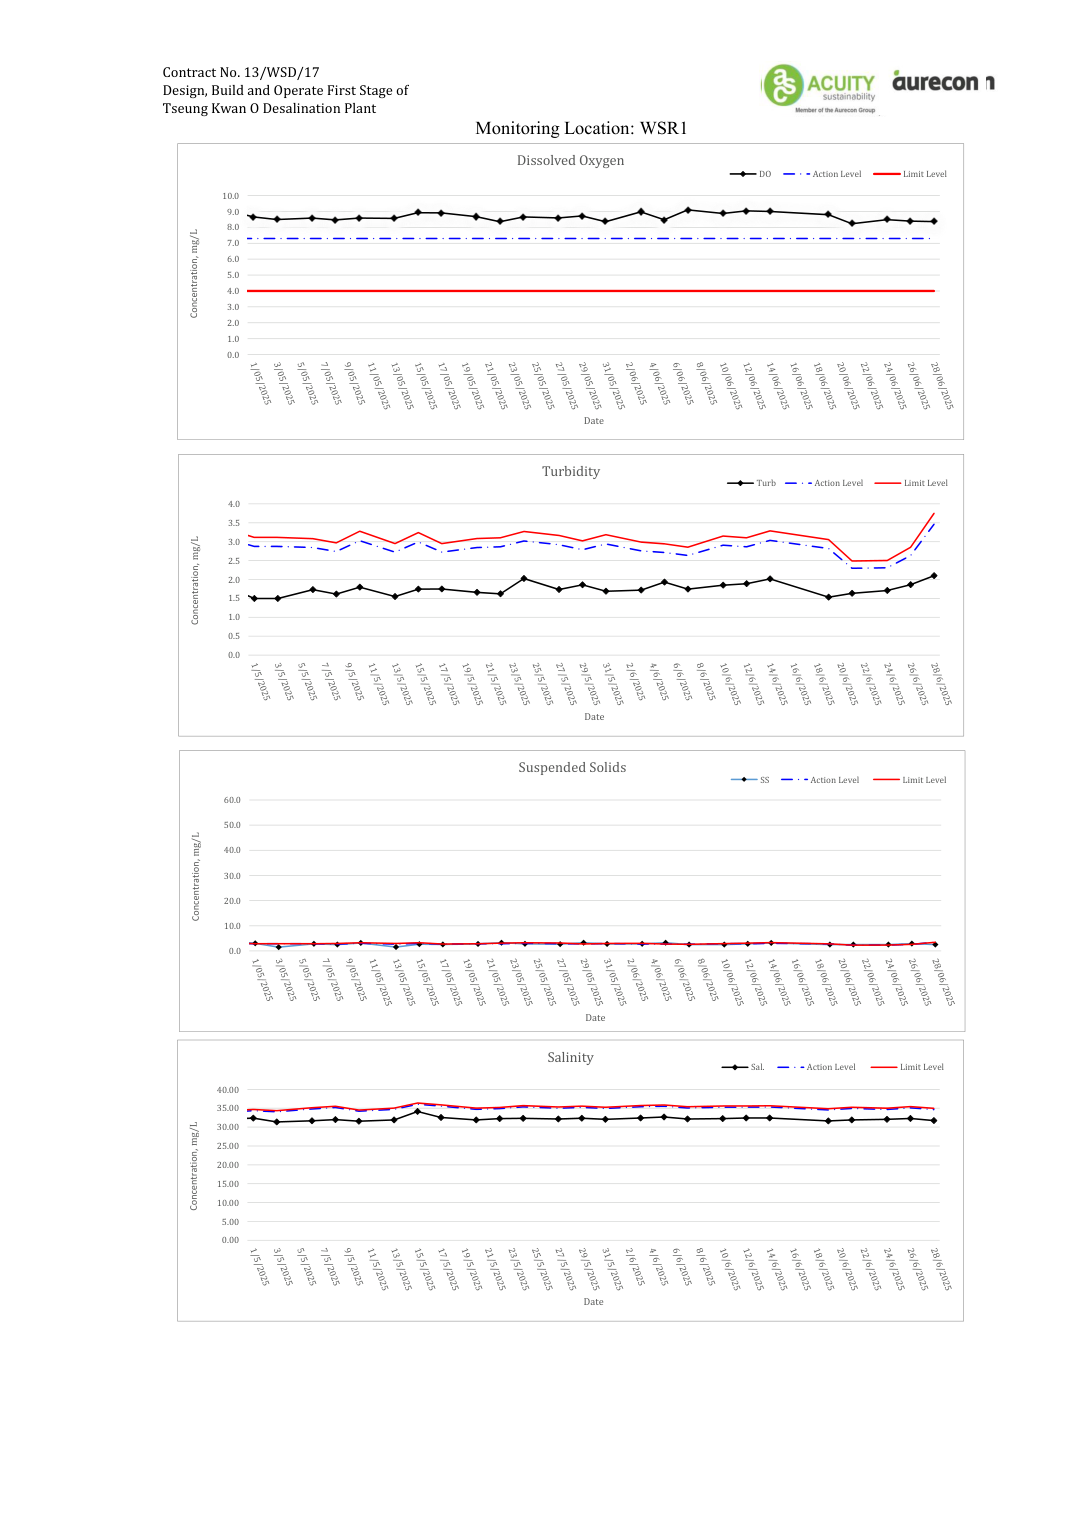
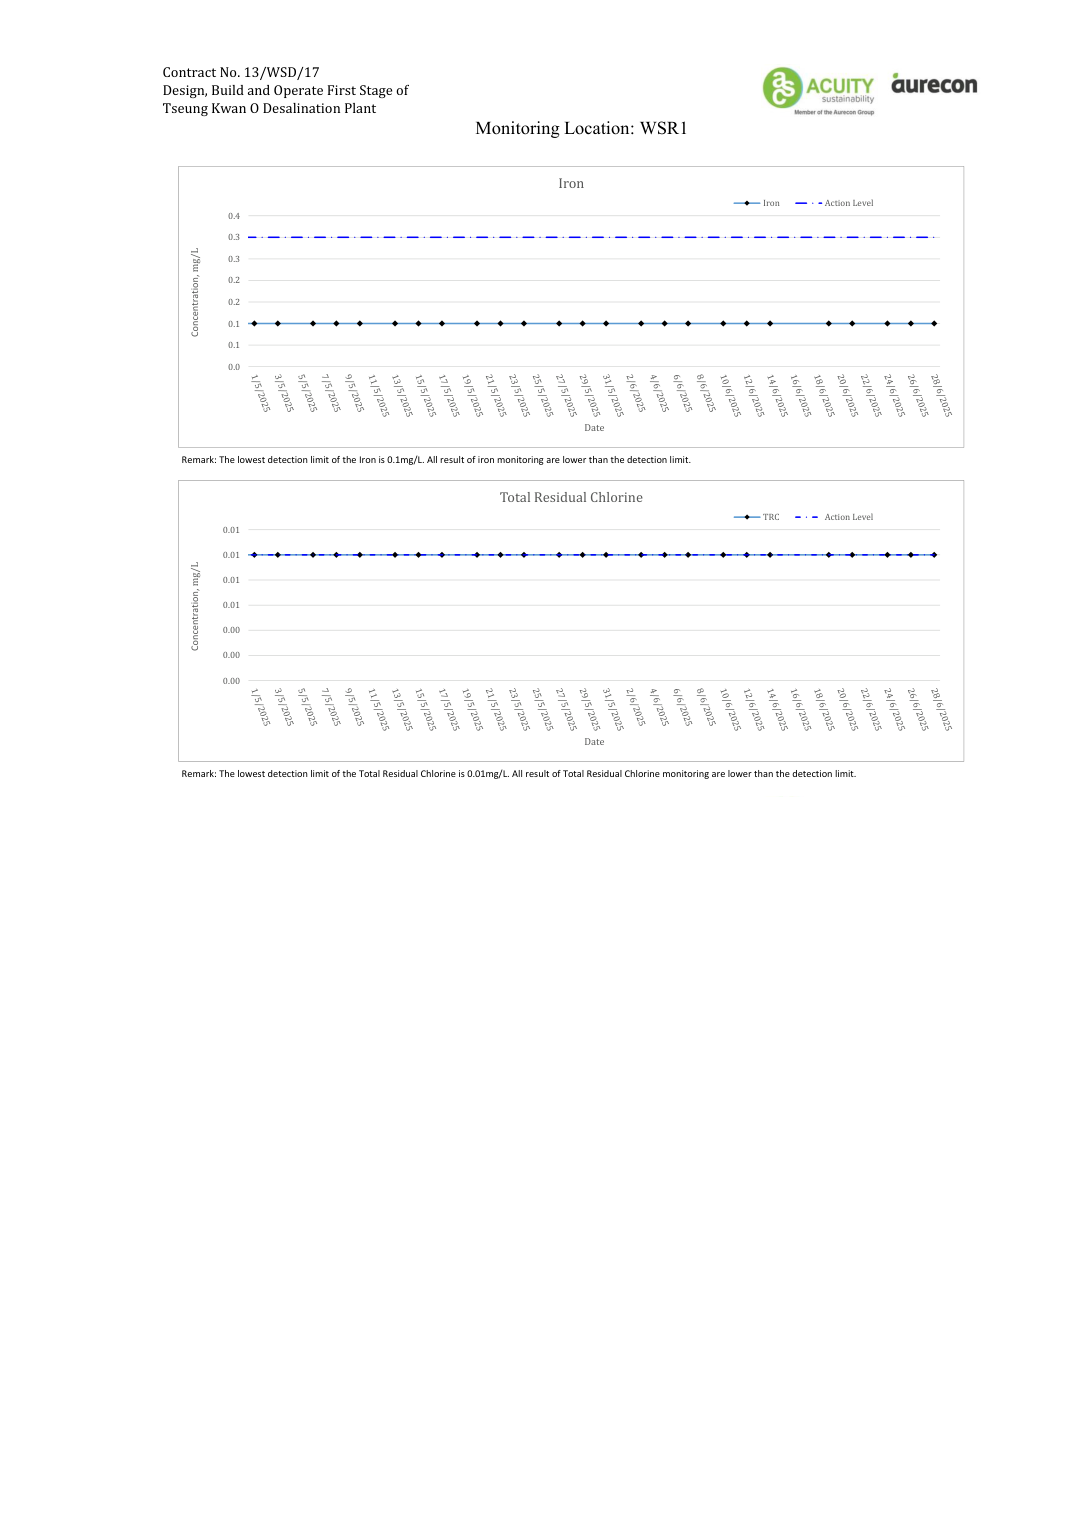
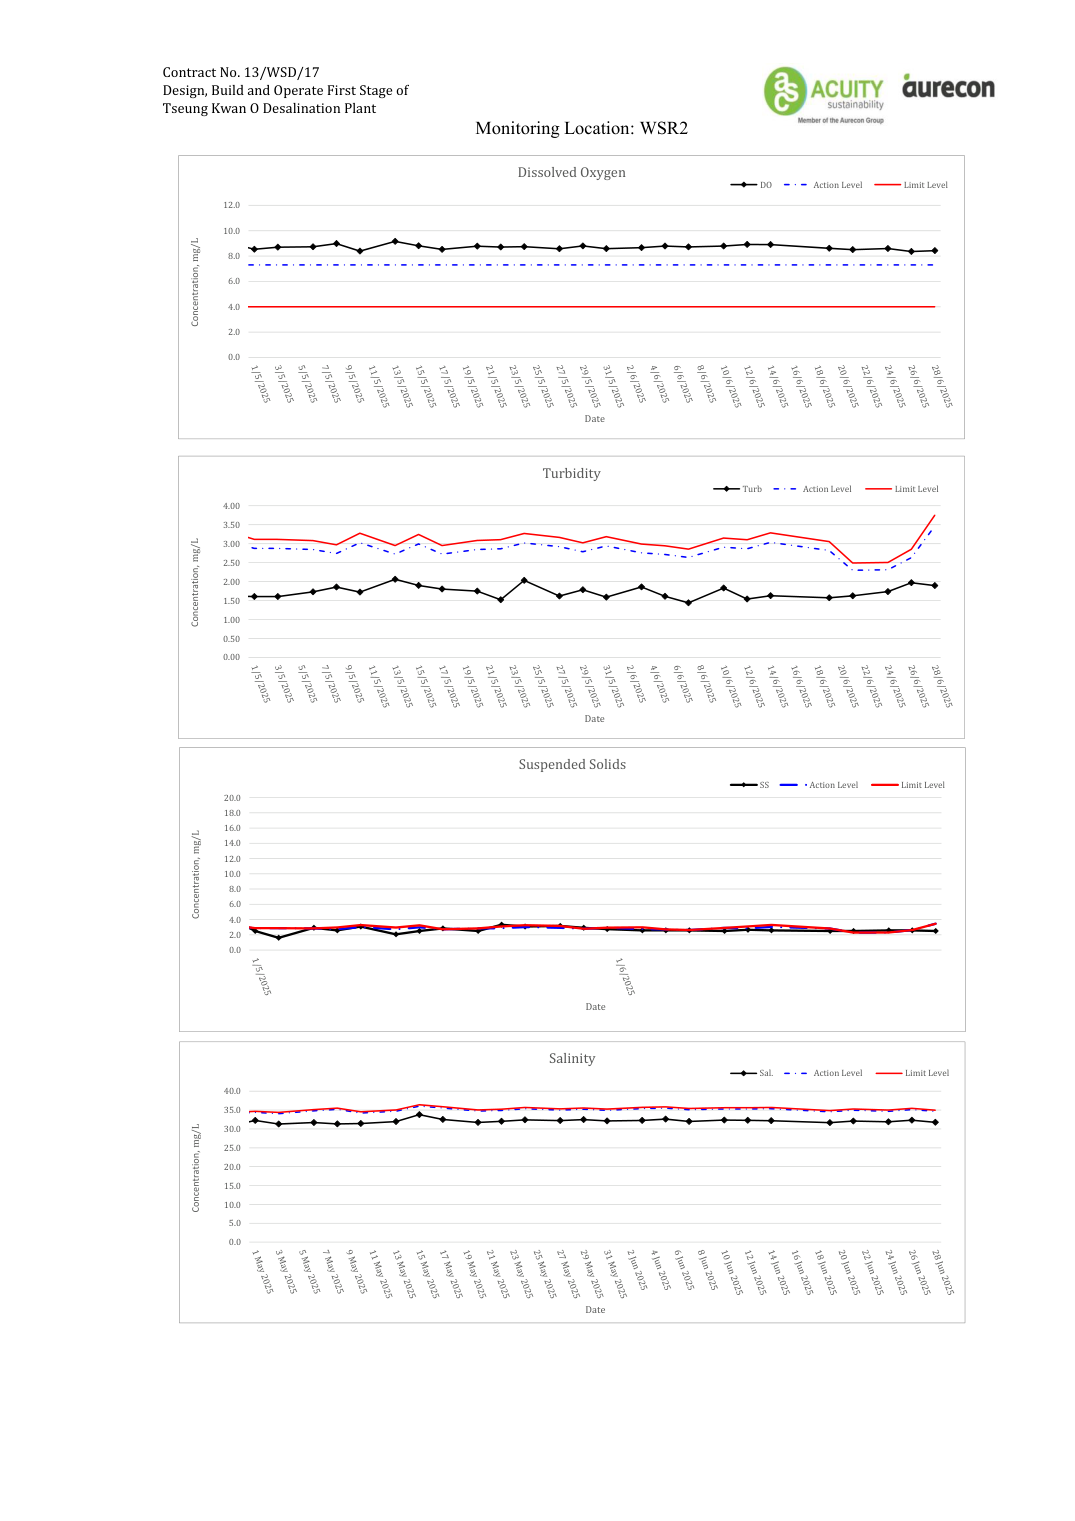
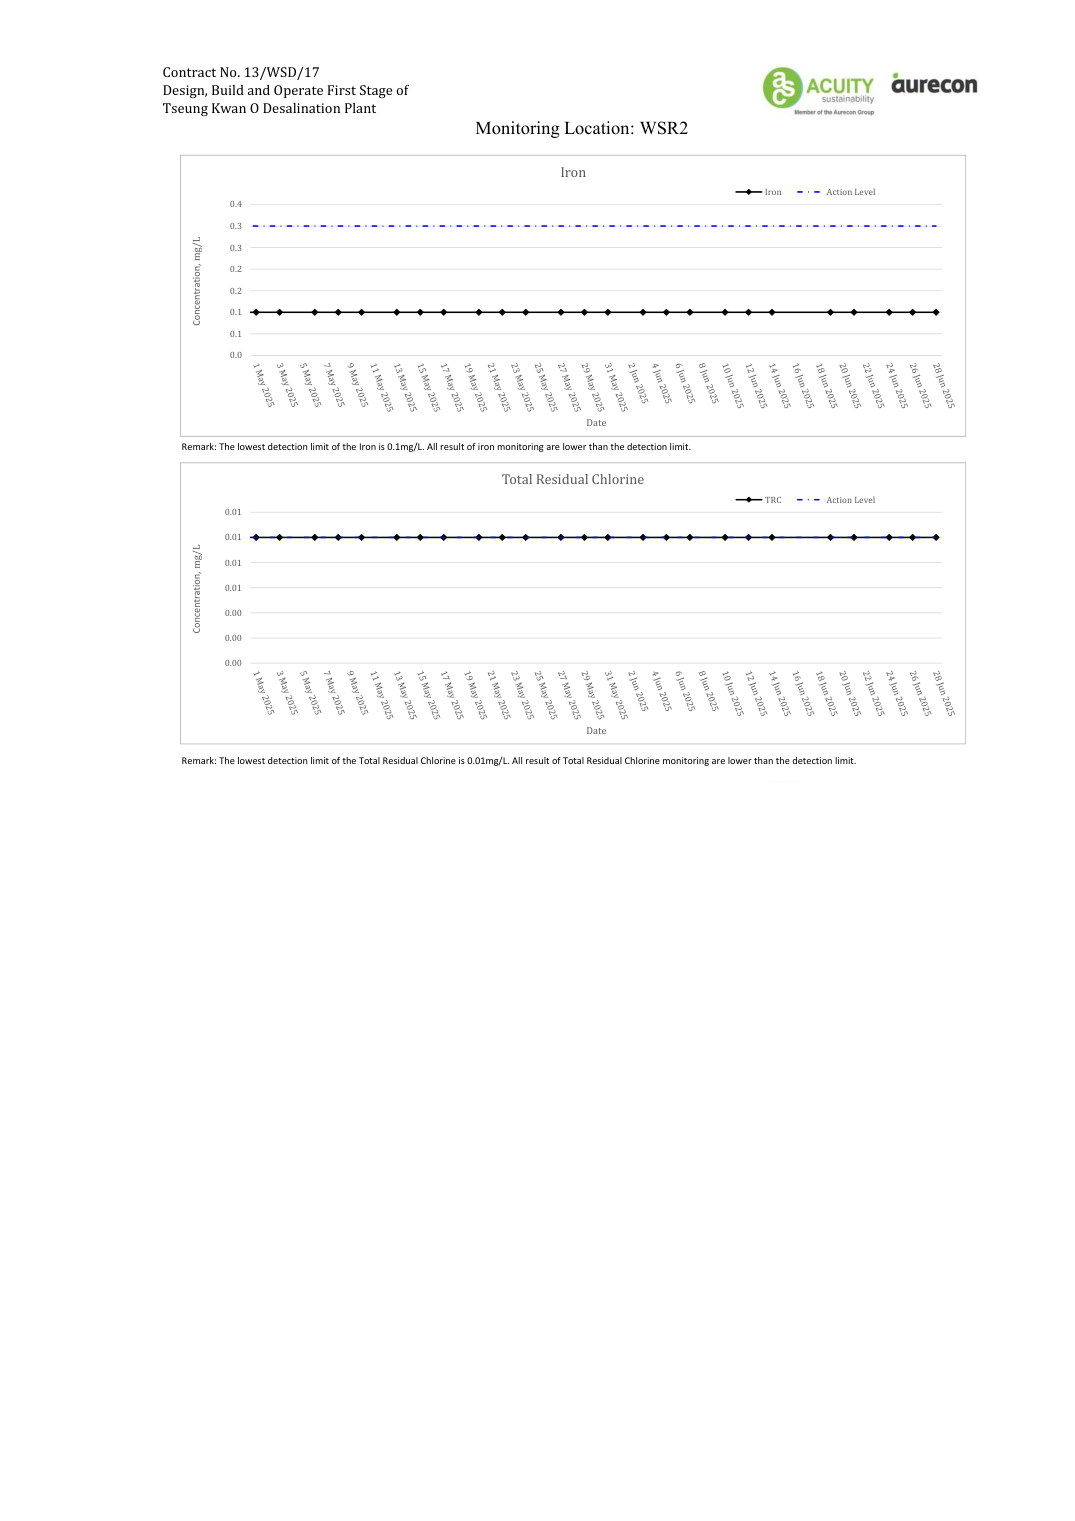
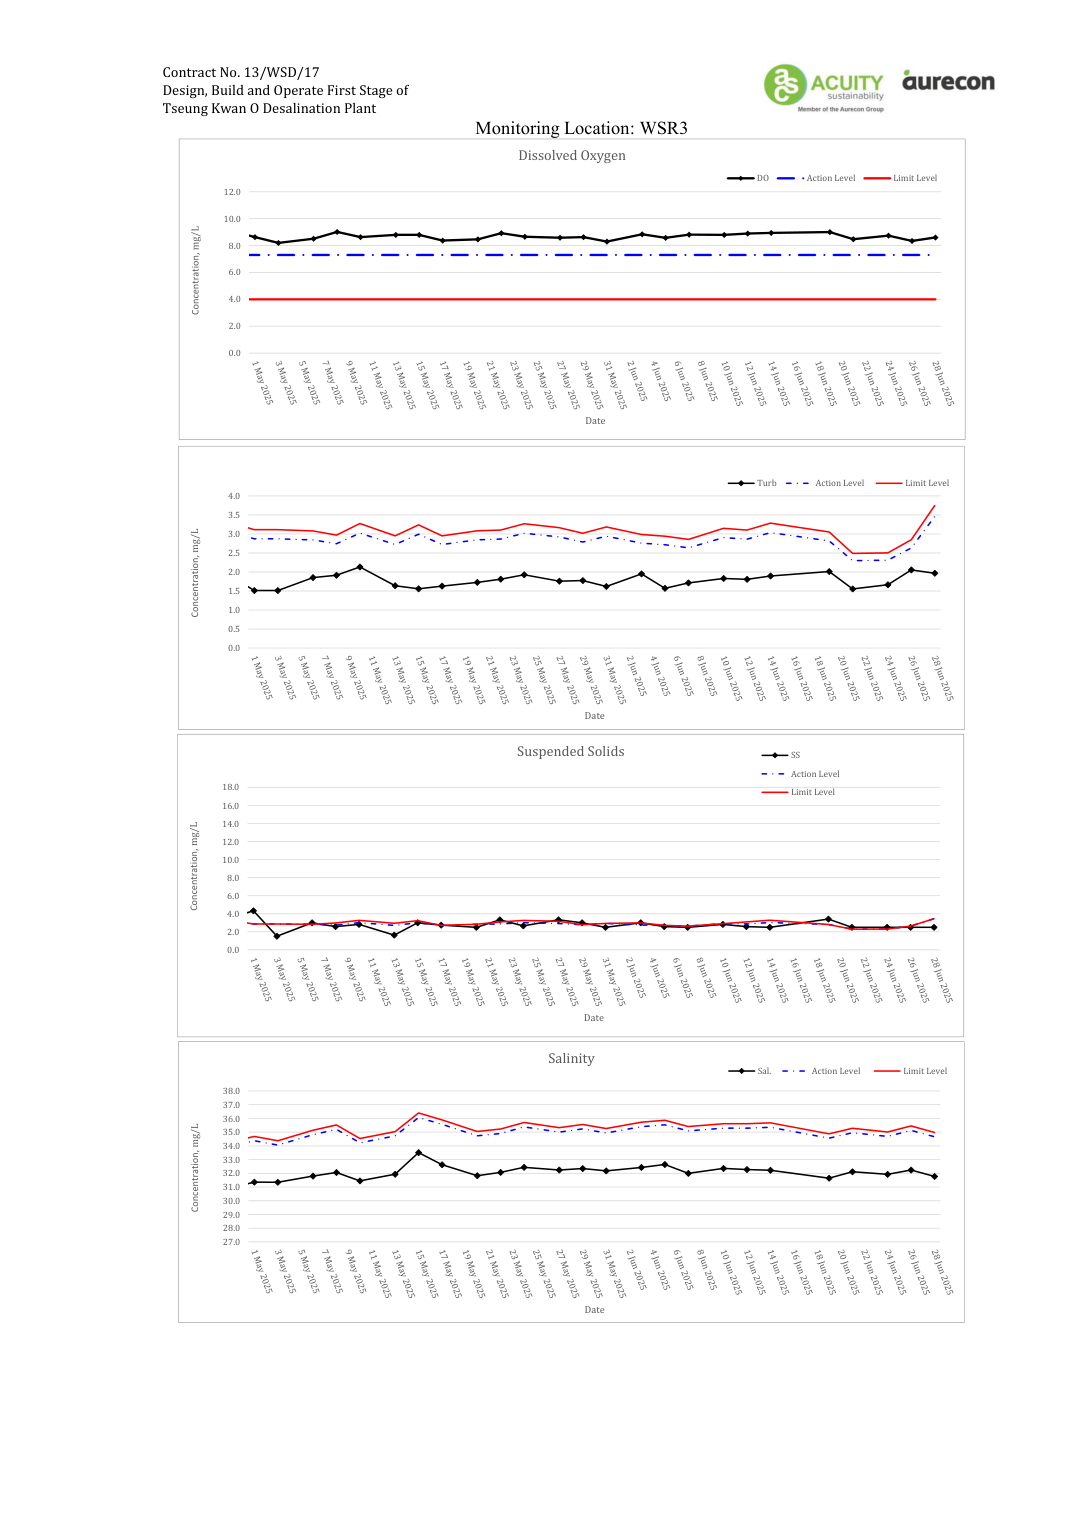
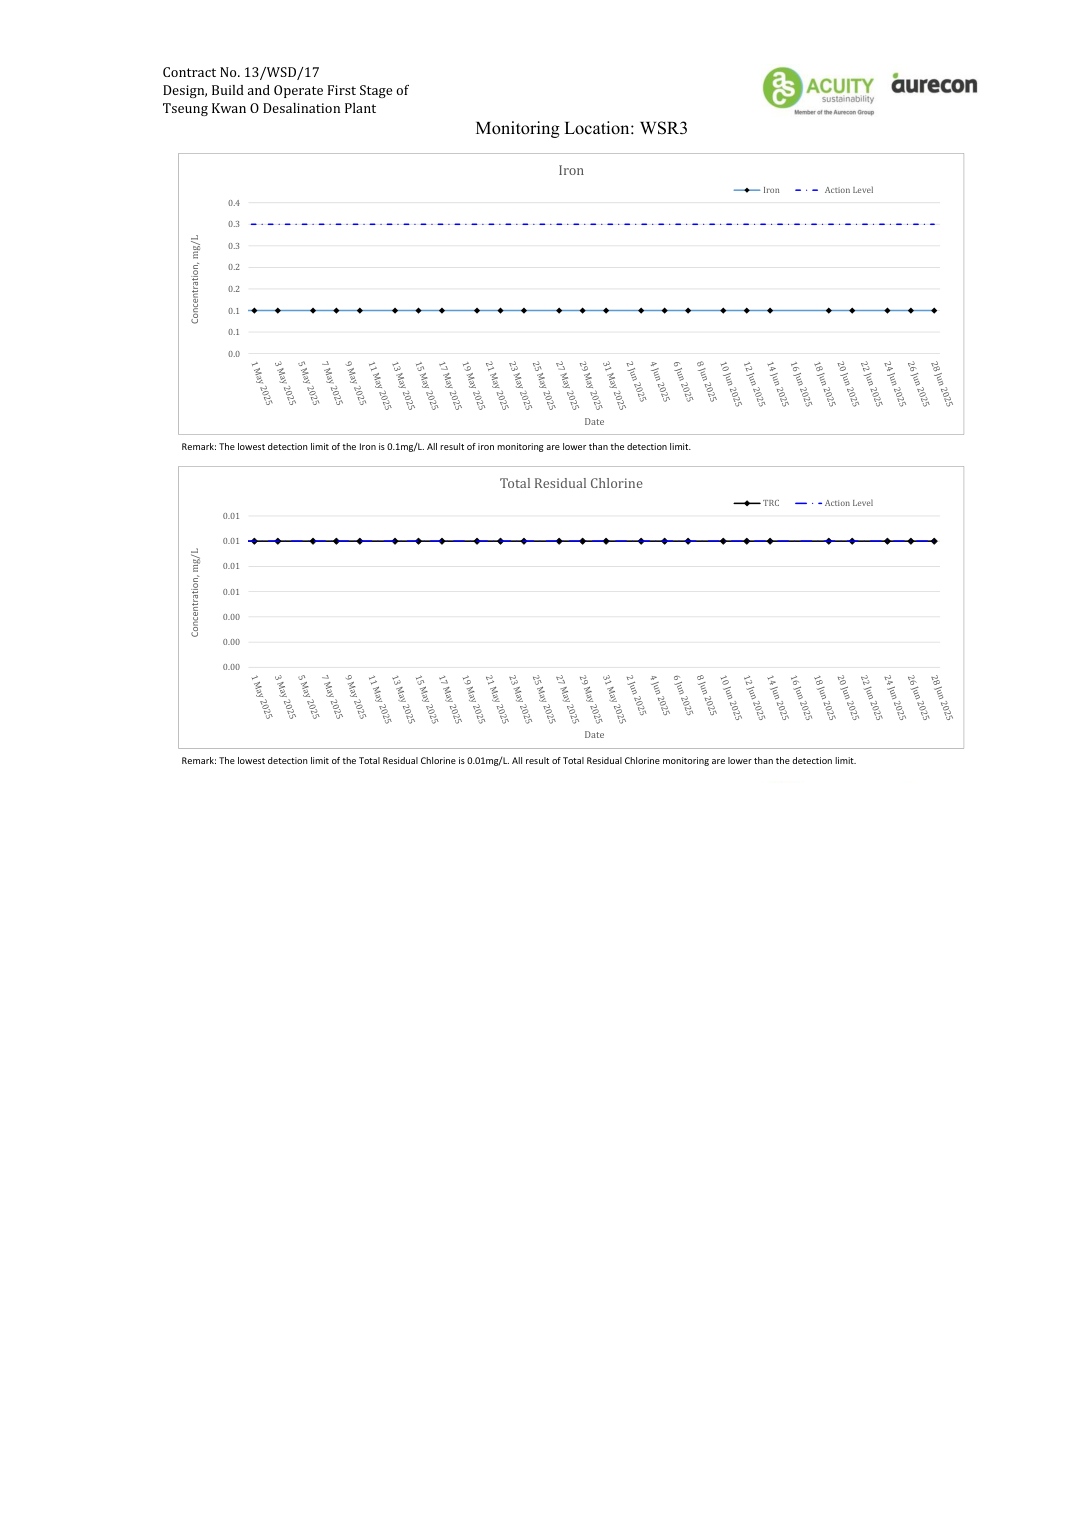
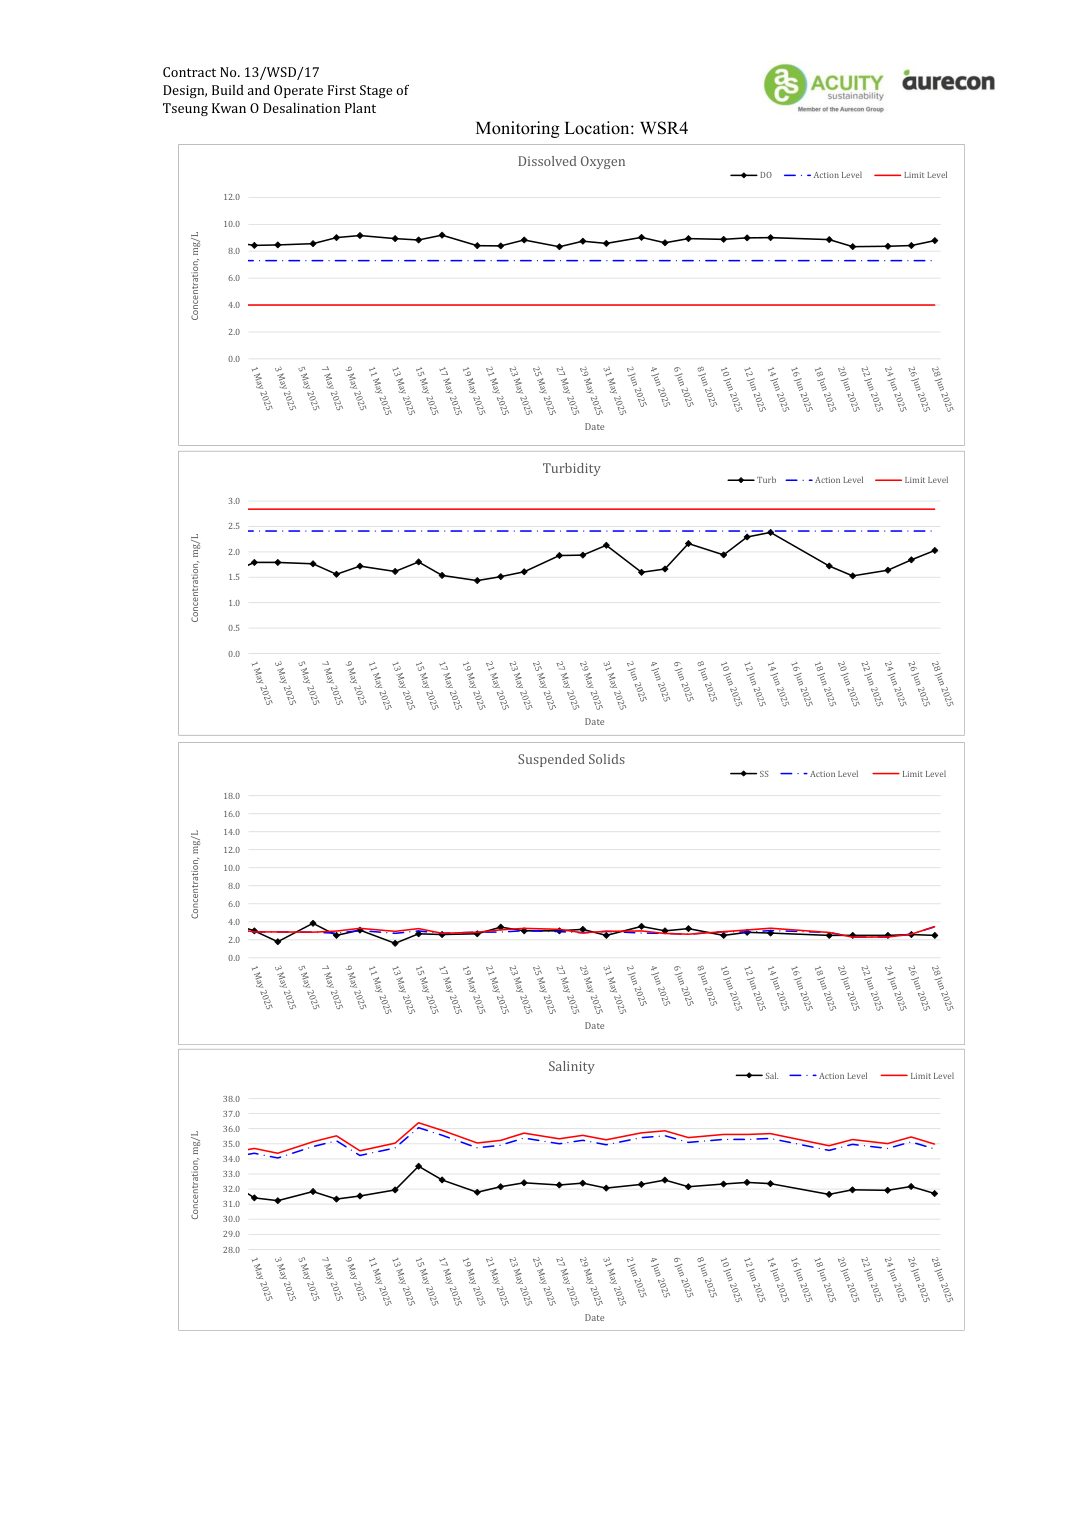
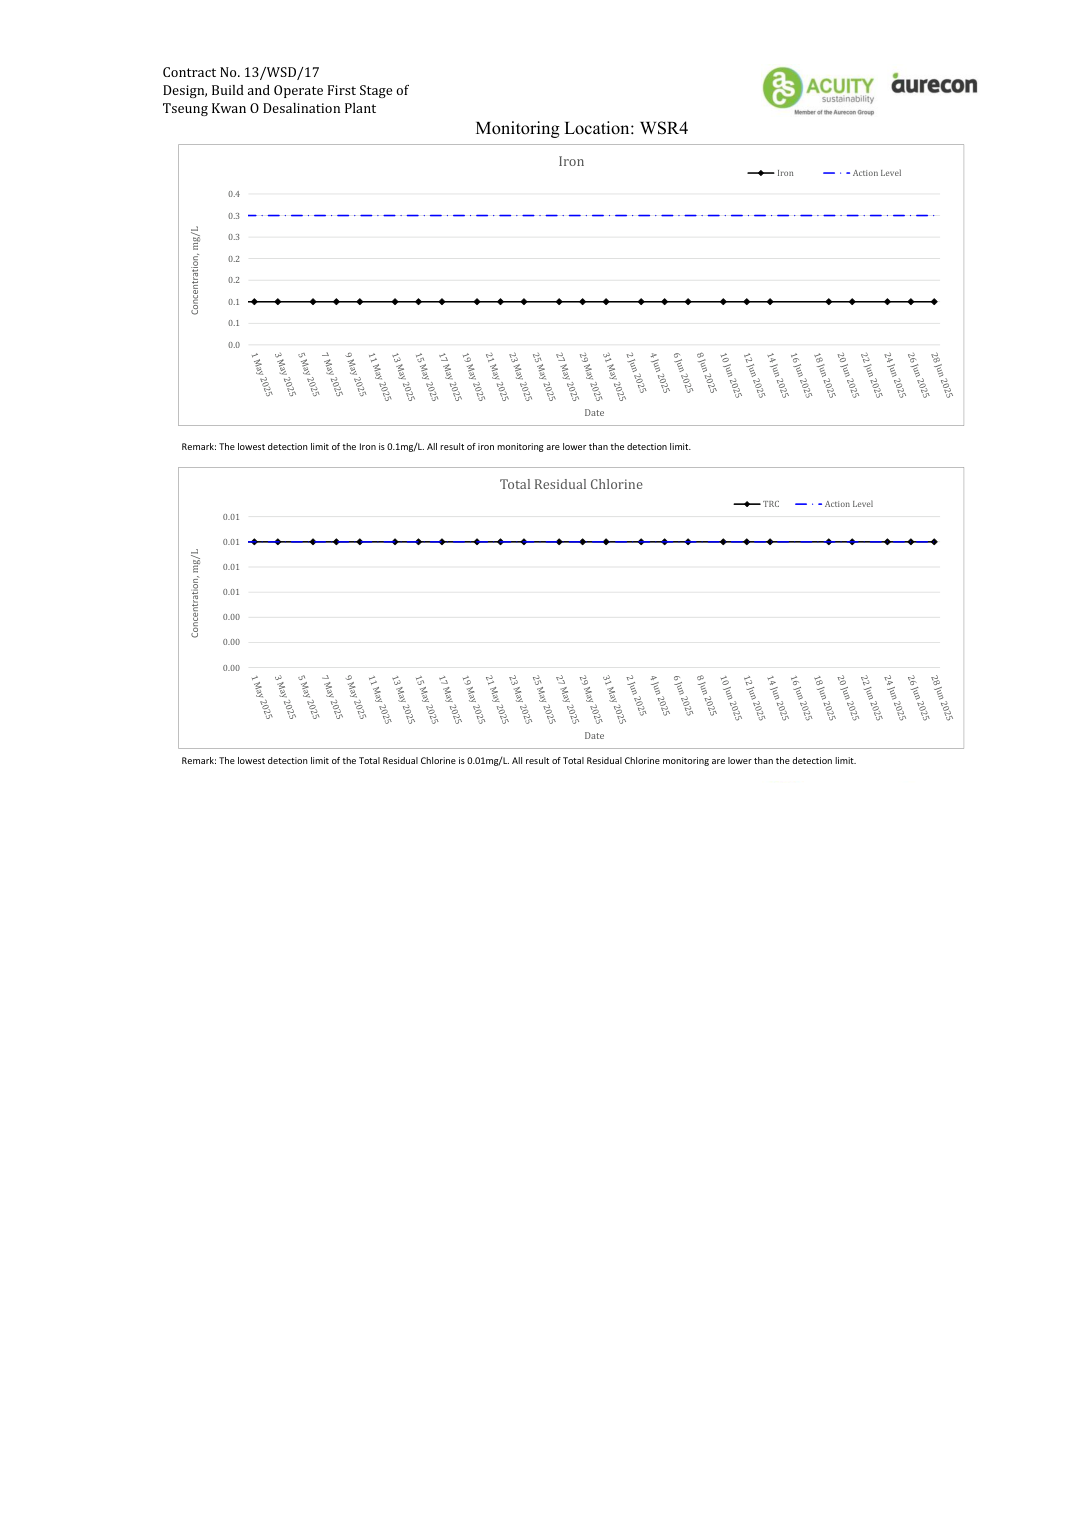
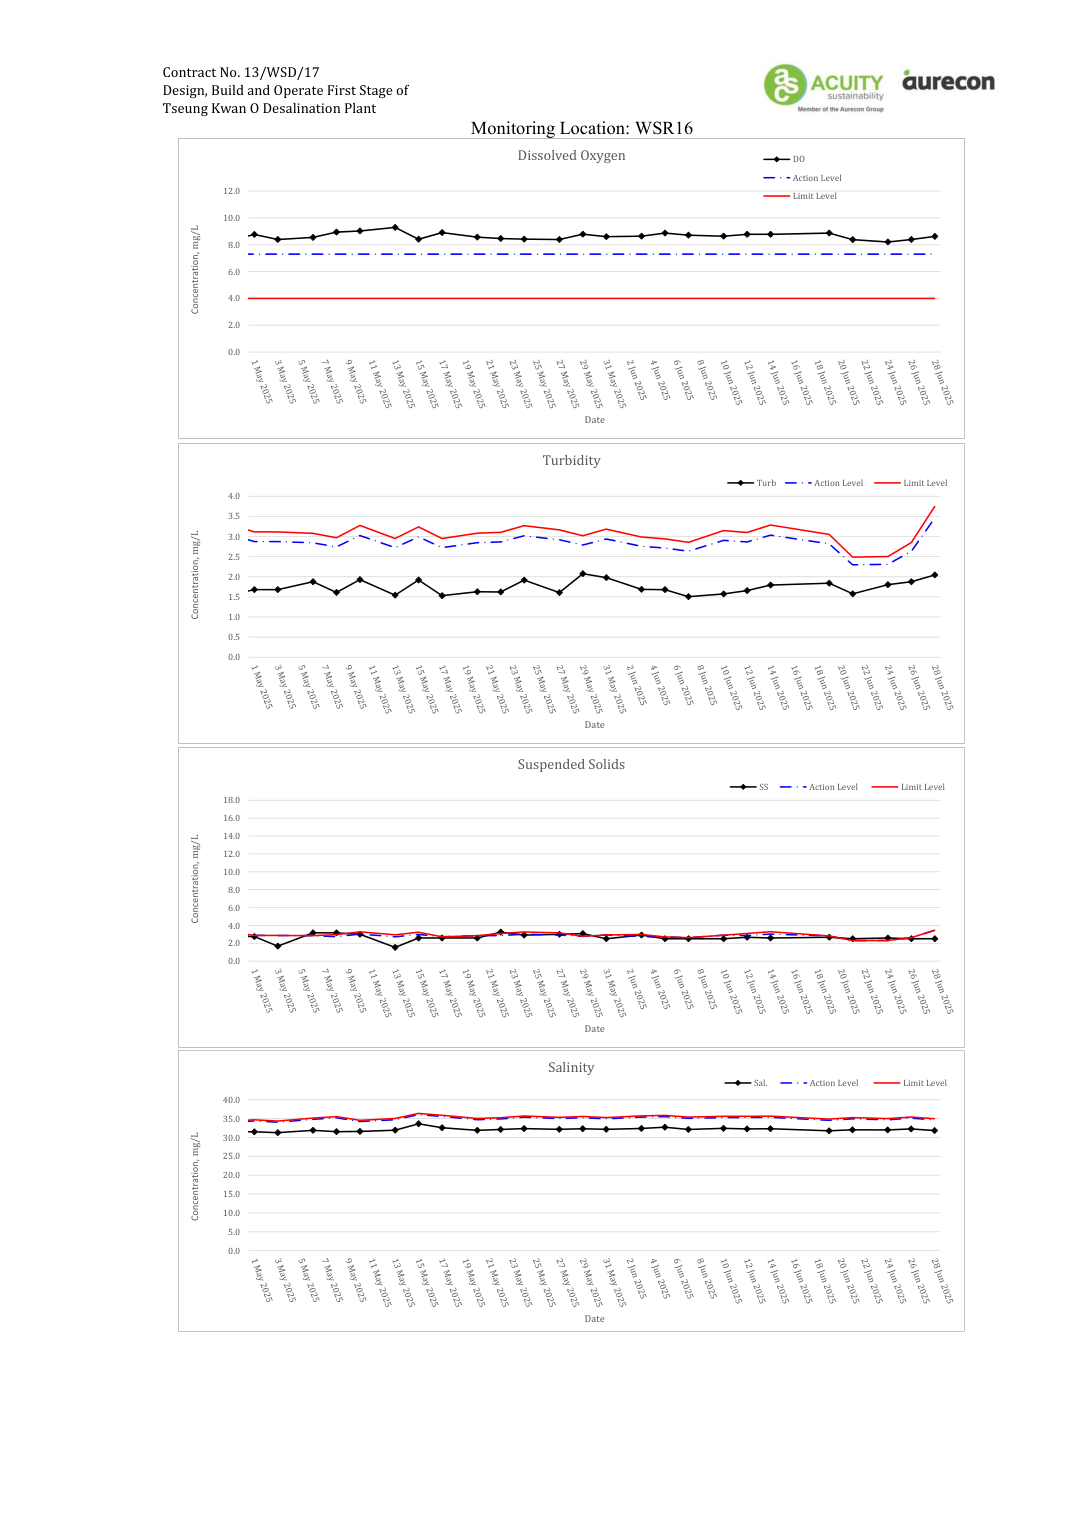
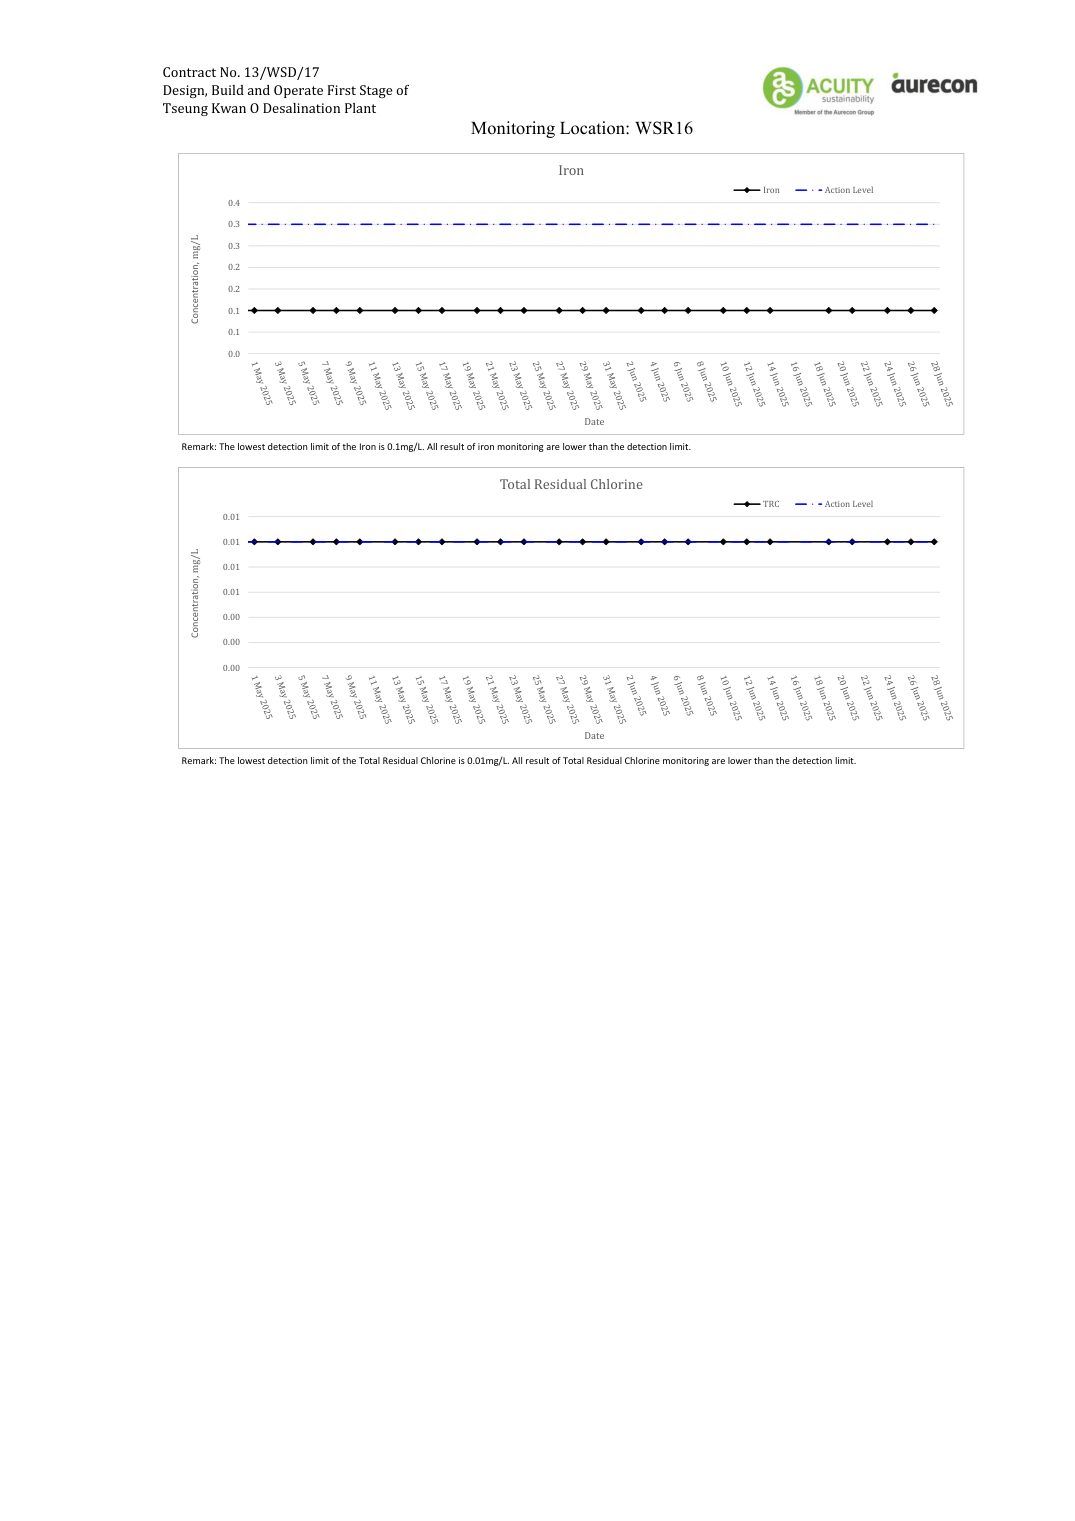
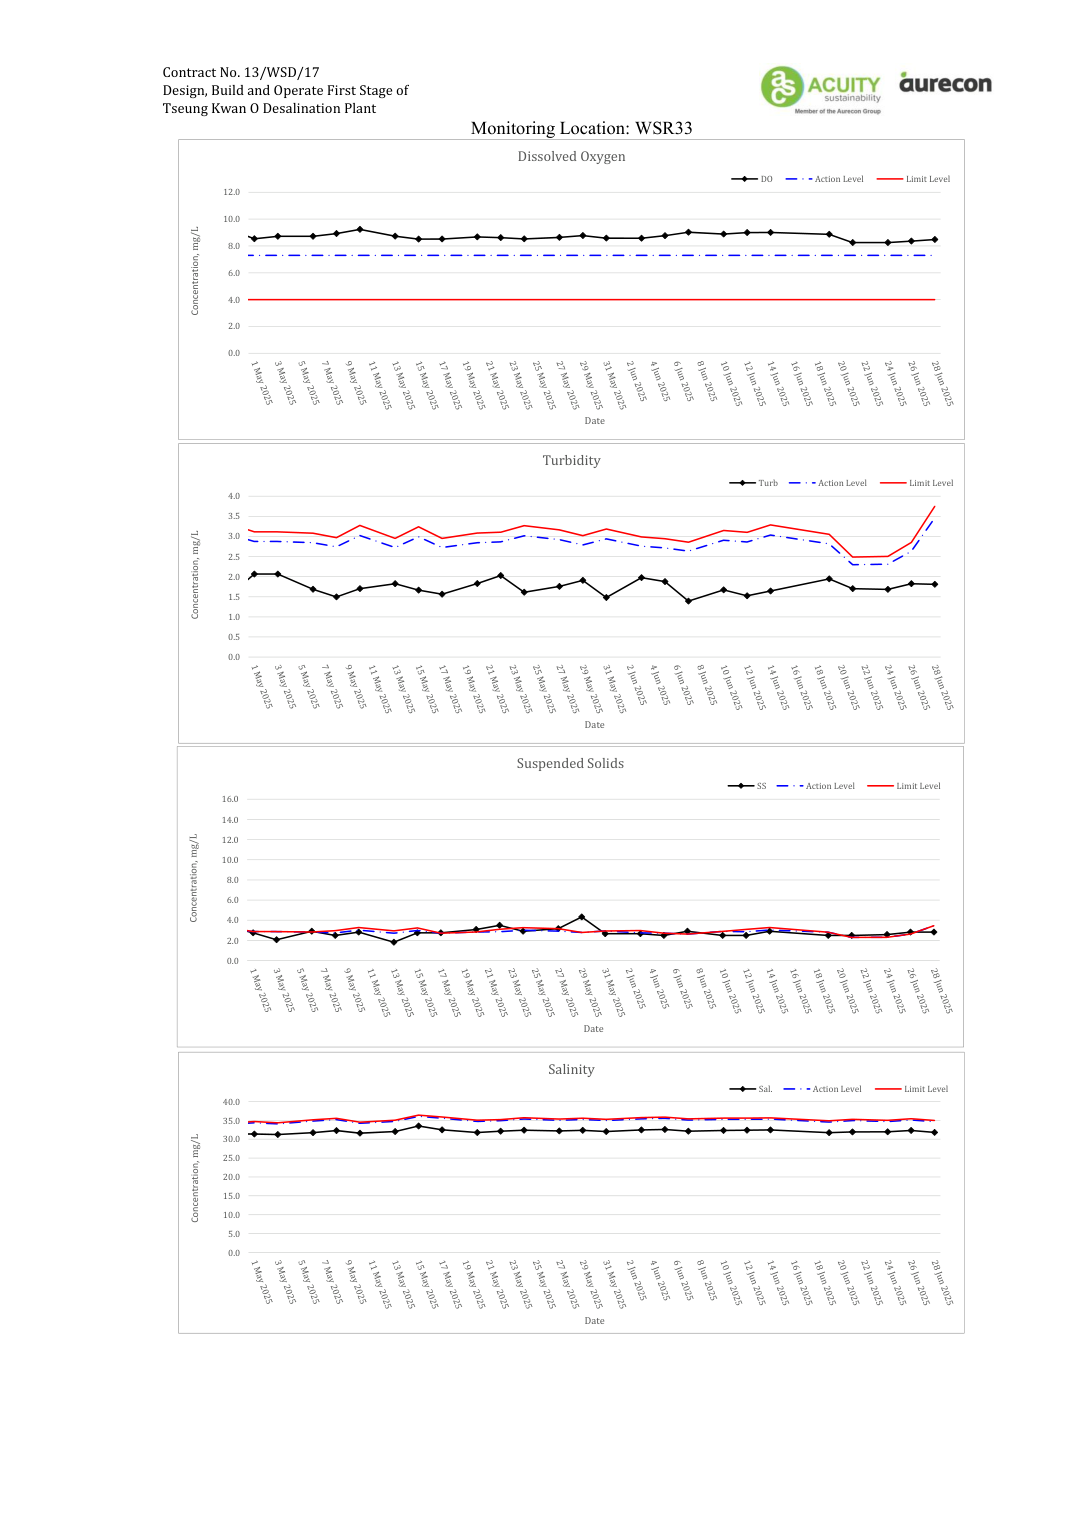
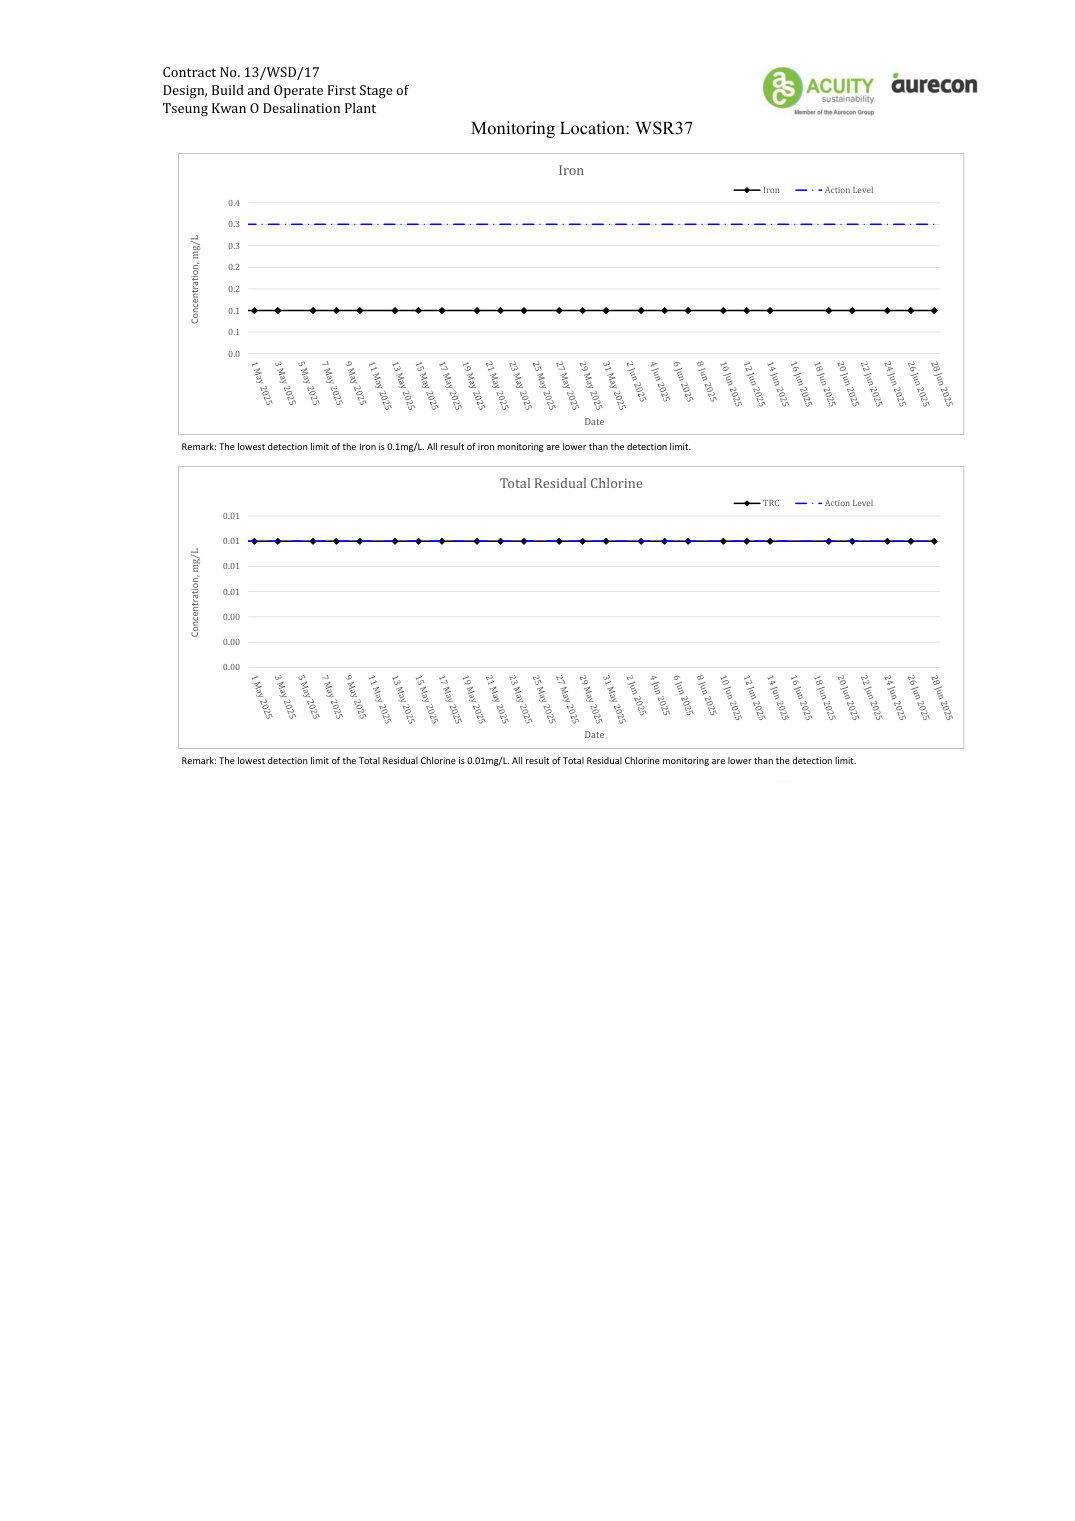
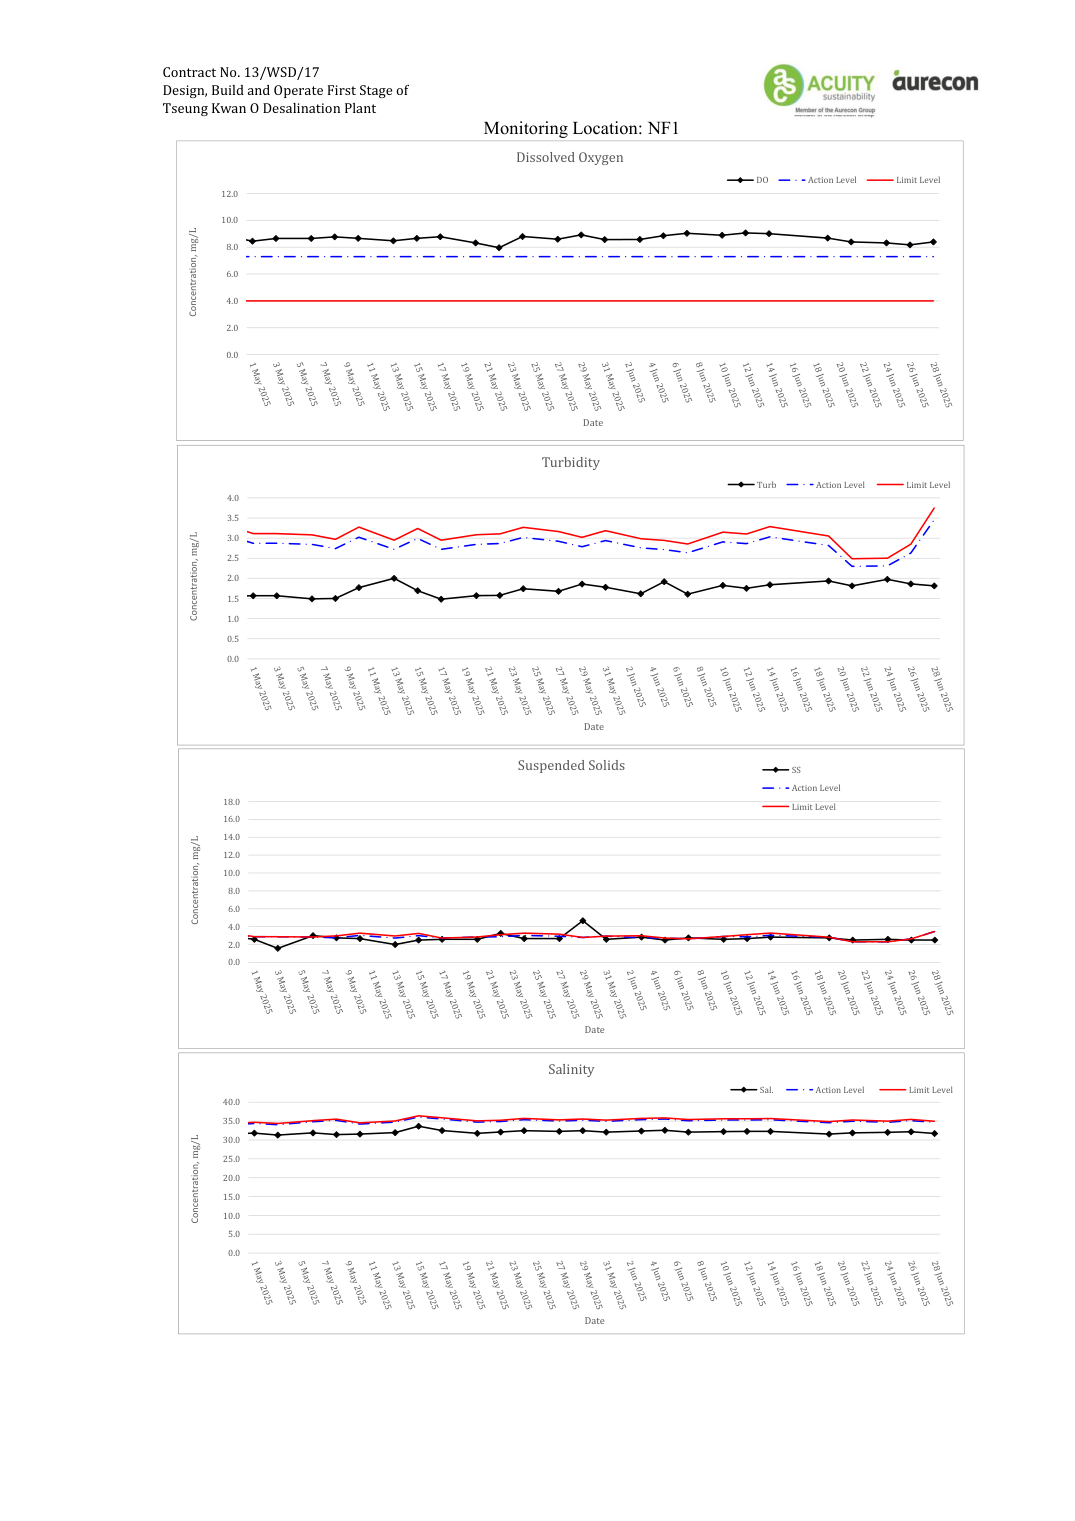
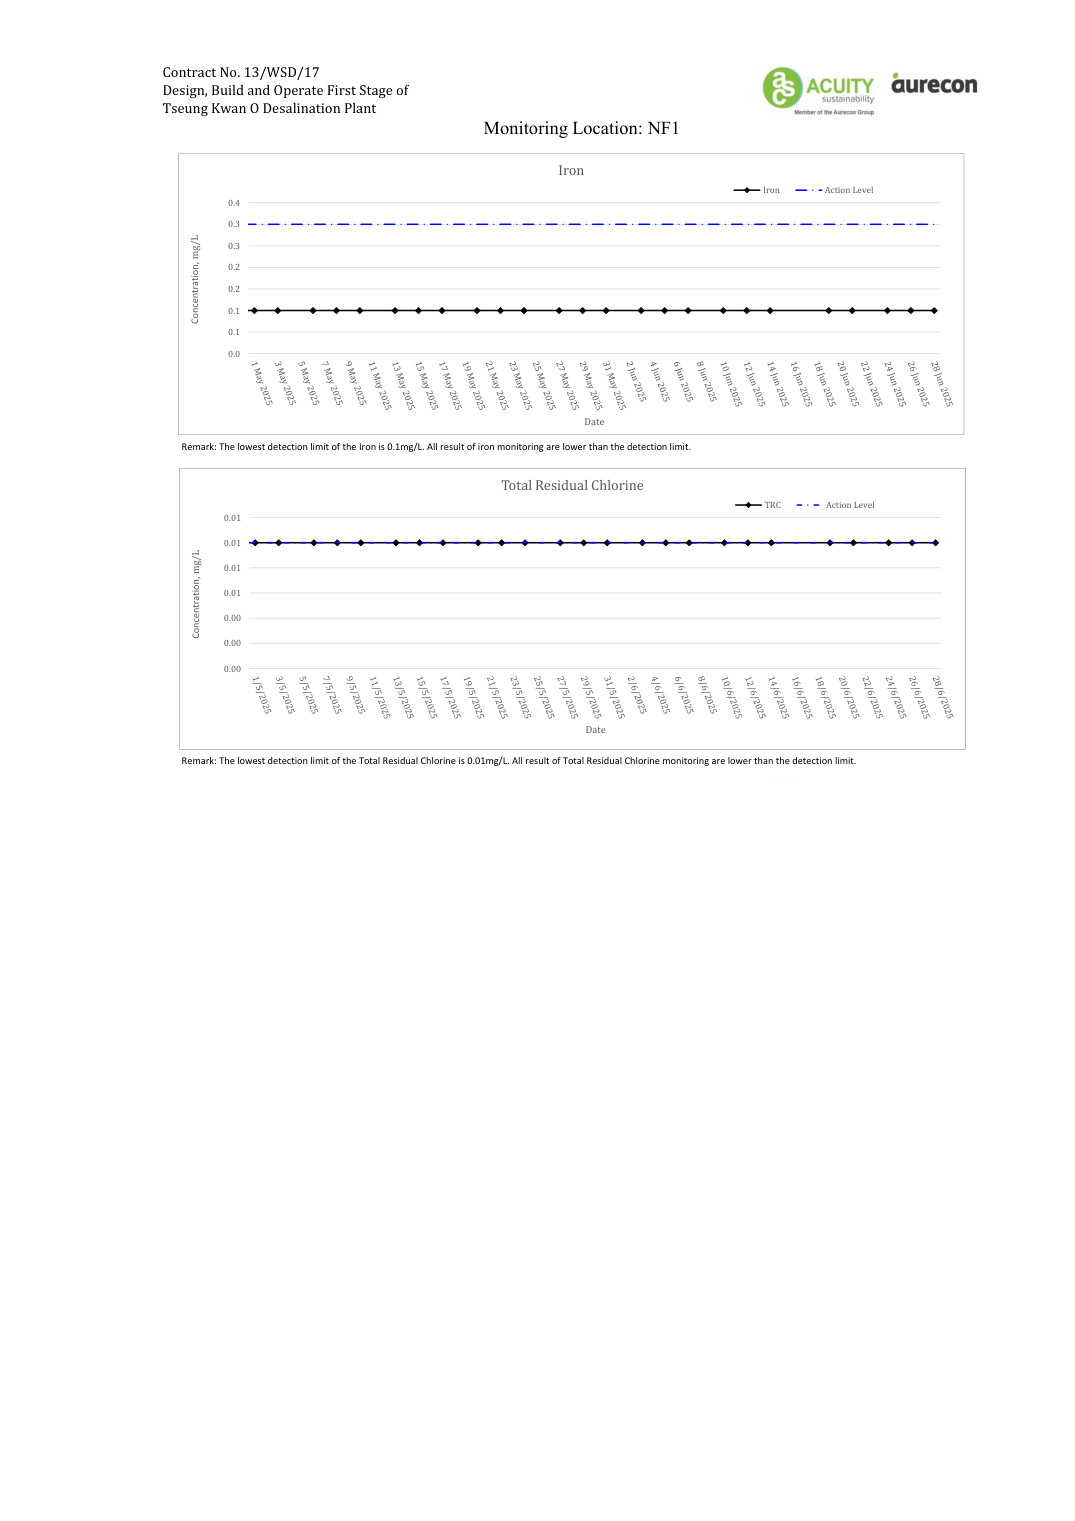
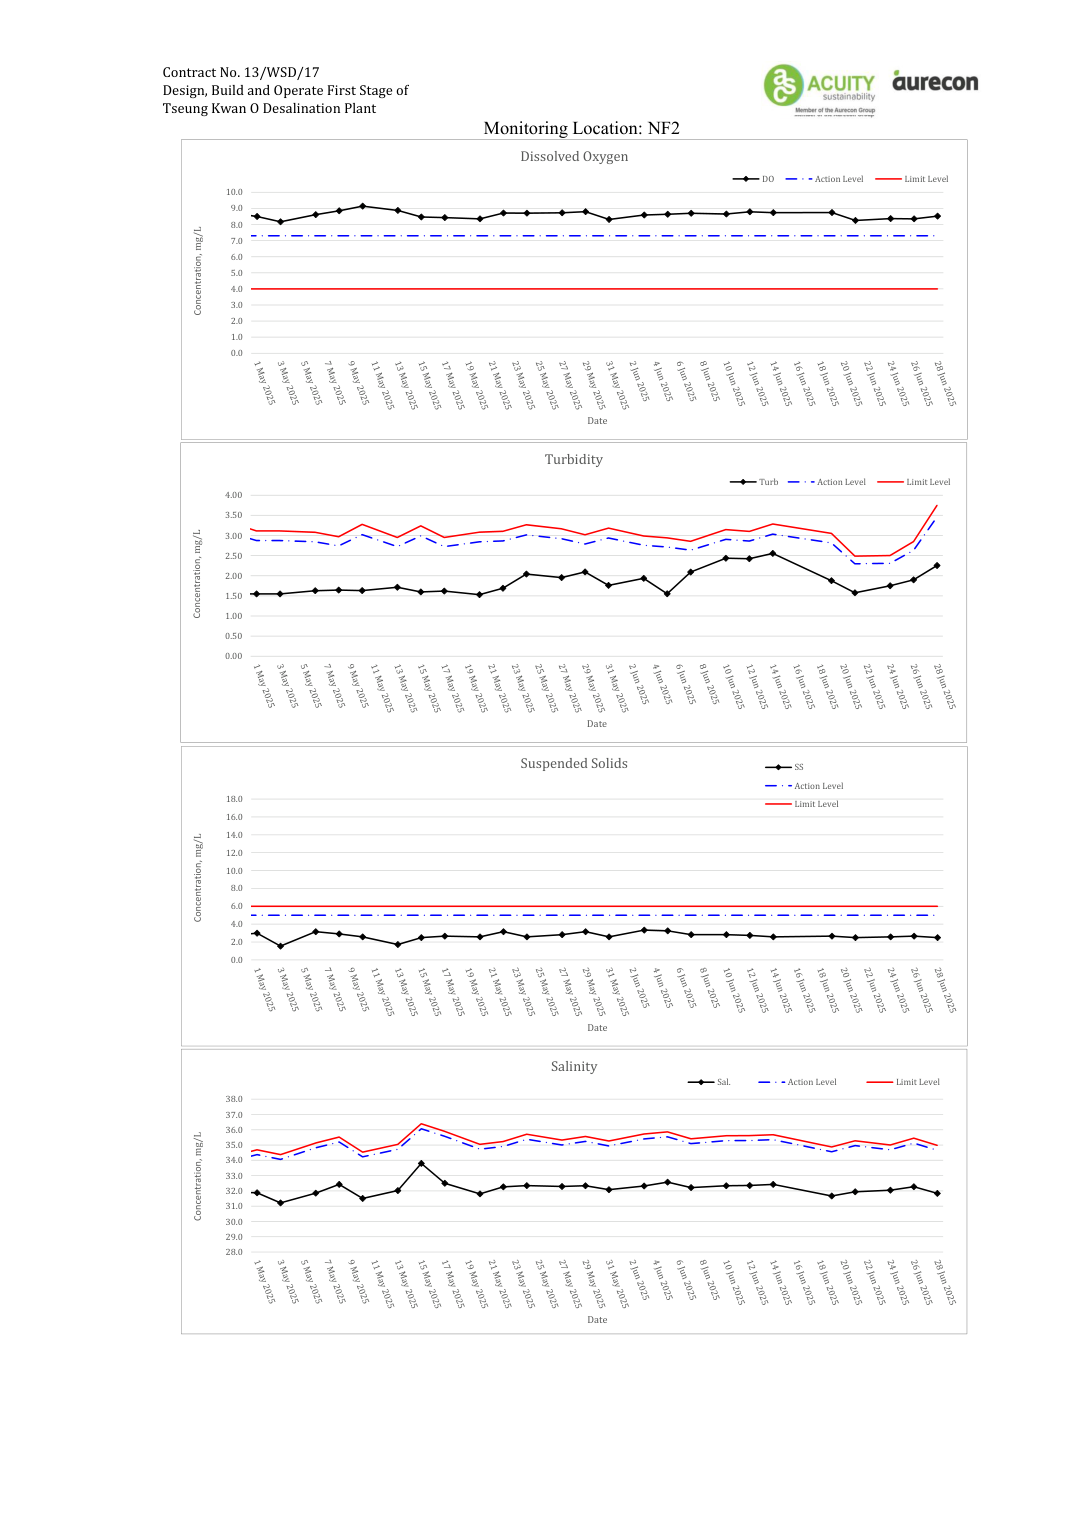
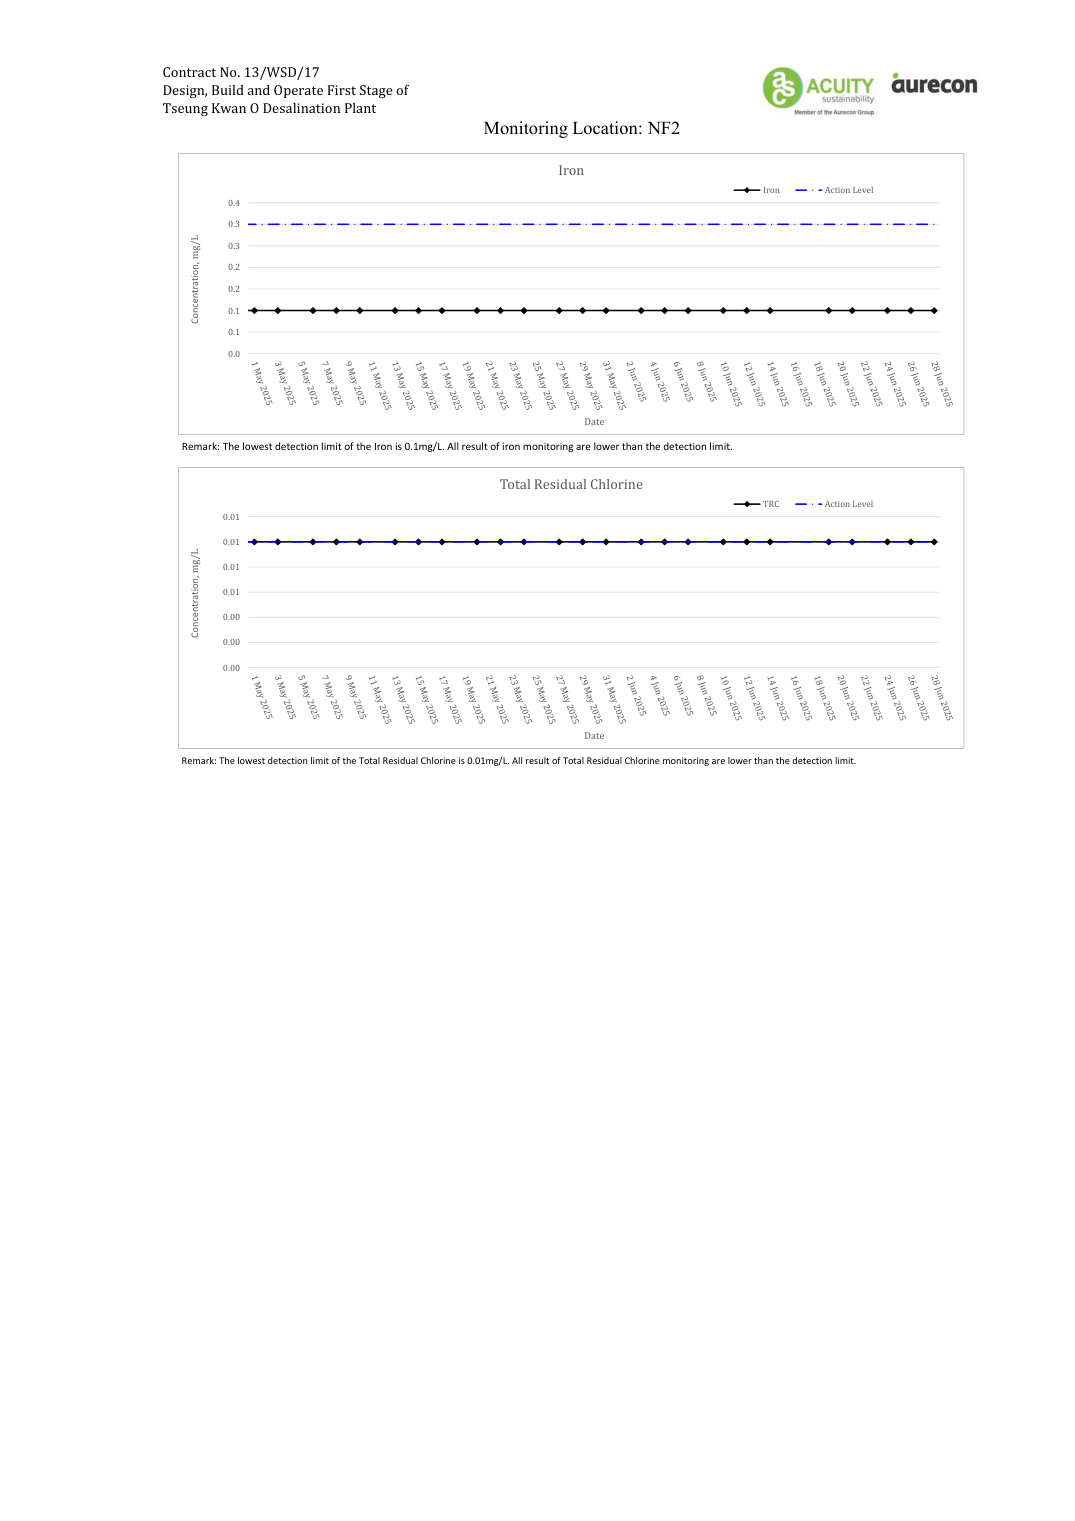
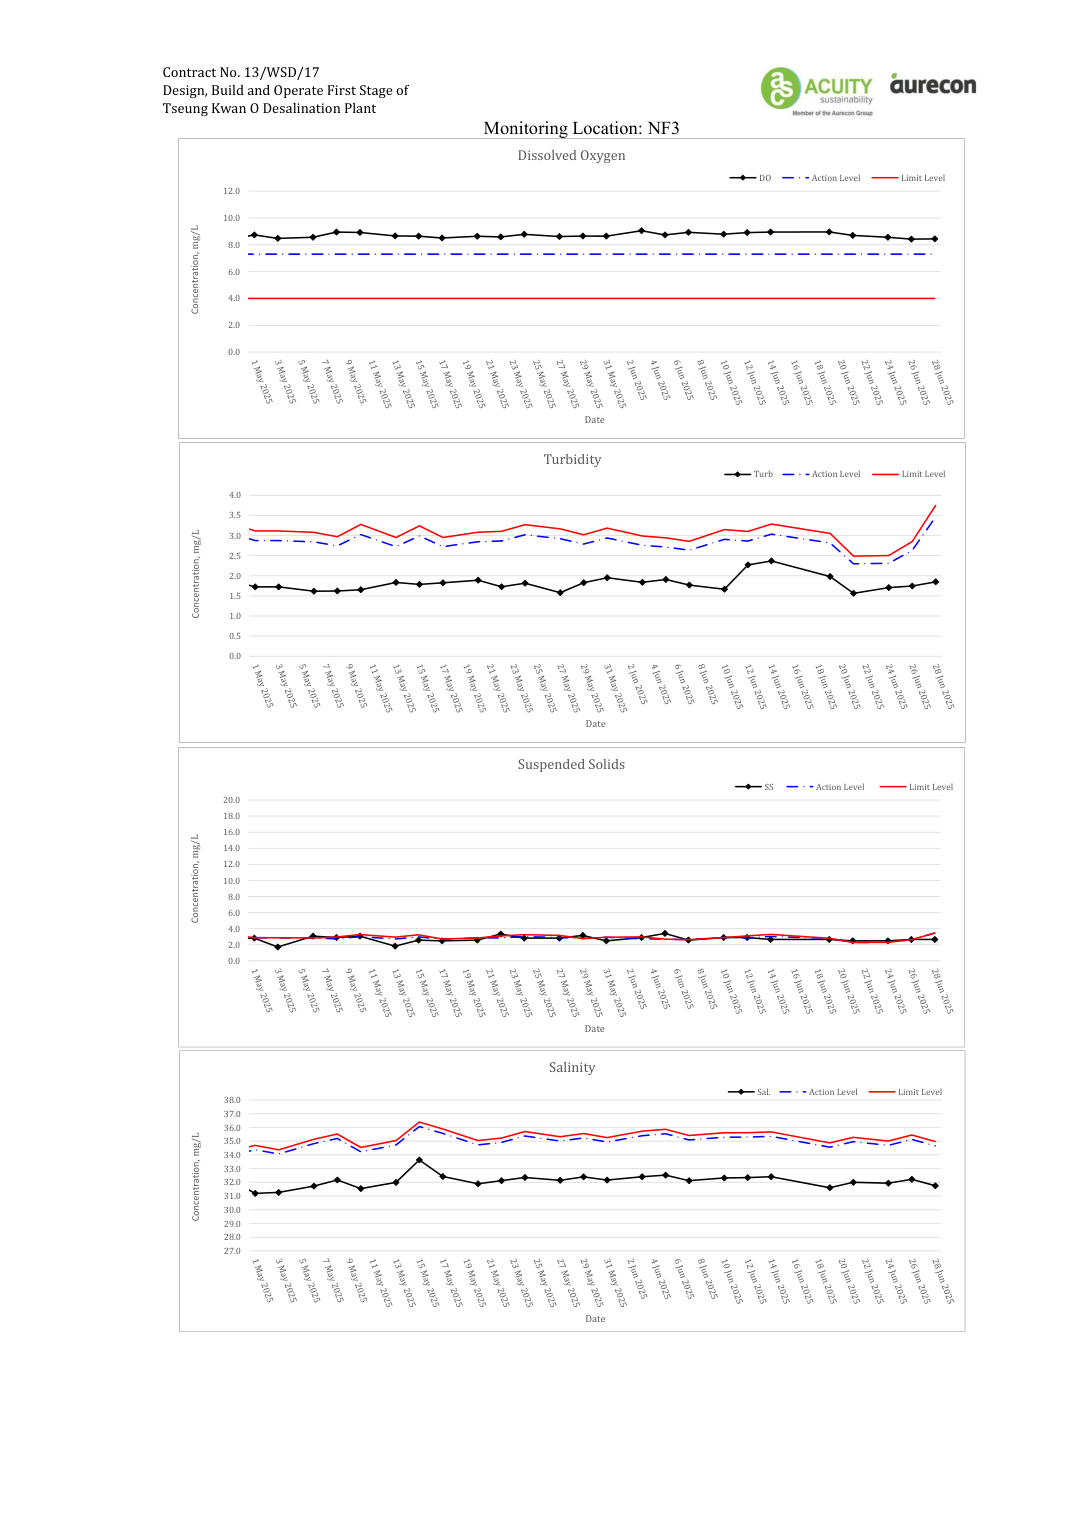
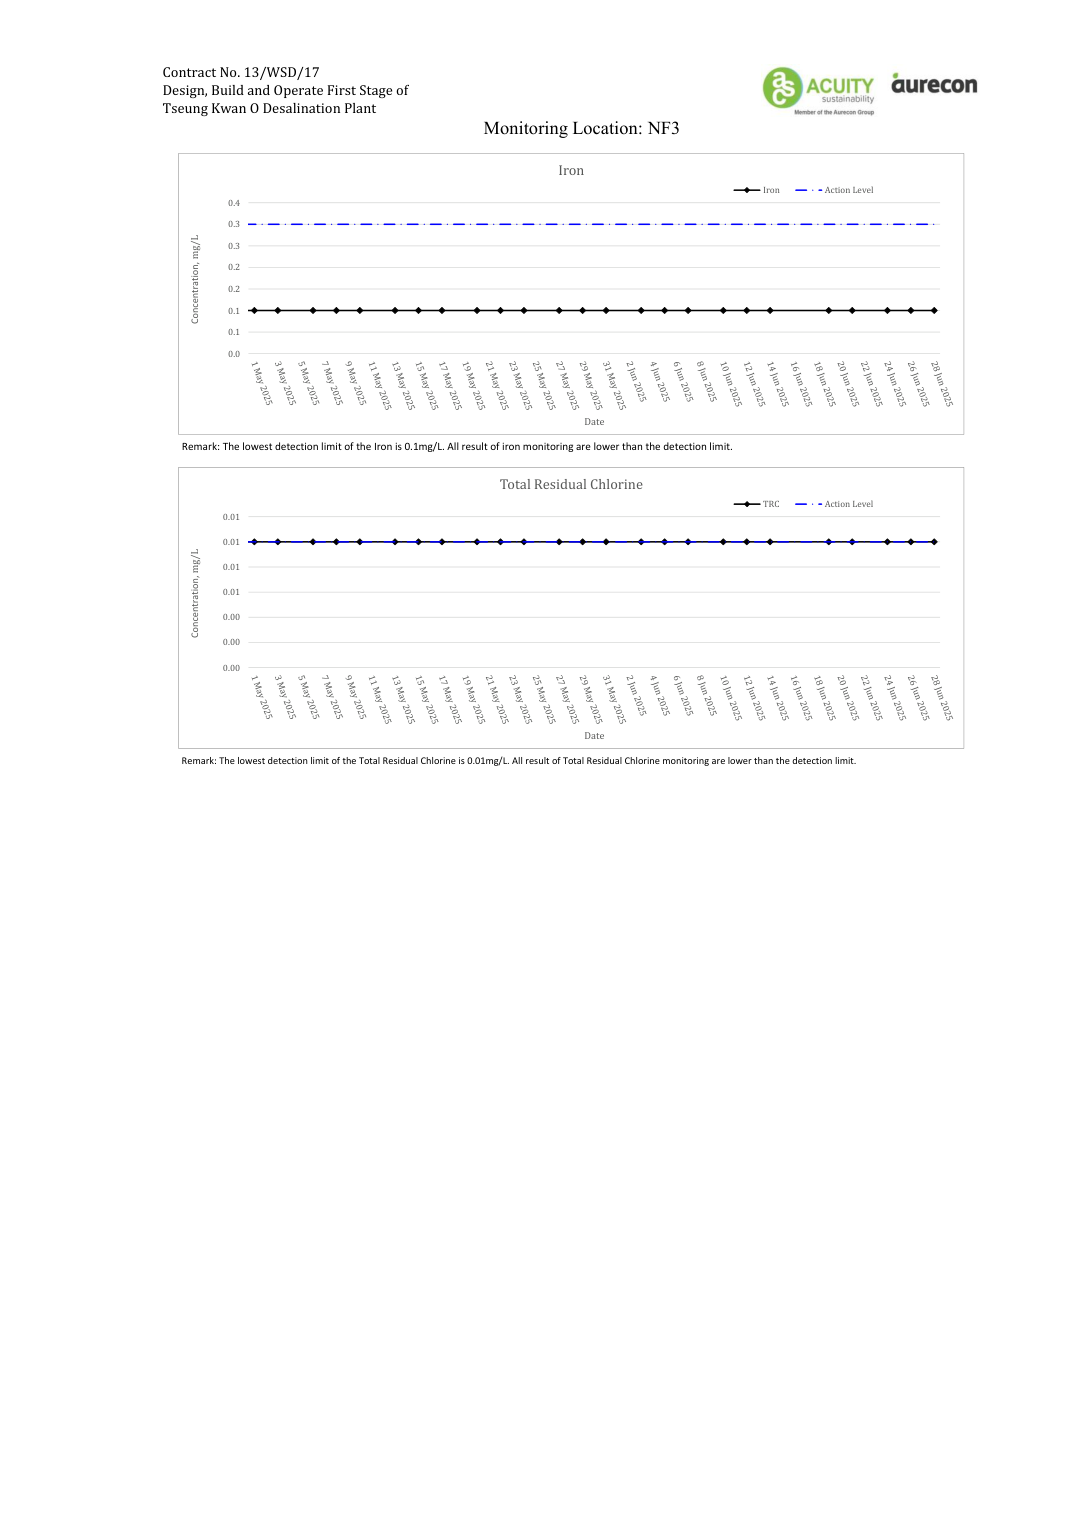
The water quality monitoring at the designated locations were conducted by the ET as scheduled in the reporting period. The graphical presentation of the water quality monitoring result was shown in Appendix C.
A total of three (3) action level exceedances and eleven (11) limit level exceedances of SS were recorded. Summary of exceedances could be referring to Appendix F.
Continuous Monitoring of Effluent Quality The continuous monitoring of effluent quality was conducted from 1 May 2025 to 31 July 2025. No exceedance of the sampling was obtained during the reporting period.
Monthly Effluent Monitoring (Water Discharge License) According to the approved proposal to change the operation phase EM&A programme for the 2nd to 10th year, continuous monitoring of effluent quality was discontinued and replaced with effluent water monitoring in compliance with discharge license requirements starting from 15 August 2025.
Weekly in-situ monitoring and monthly laboratory measurements of the effluent quality were conducted from September 2025 to April 2026. No exceedance of the results was obtained during the reporting period. The detailed results can be referred to the Monthly EM&A Report.
3. WASTE
The waste generated from this Project includes inert construction and demolition (C&D) materials, and non-inert C&D materials. Non-inert C&D materials are made up of general refuse, vegetative wastes and recyclable wastes such as plastics and paper/cardboard packaging waste. Steel materials generated from the project are also grouped into non-inert C&D materials as the materials were not disposed of with other inert C&D materials. Details of cumulative waste management data are presented as a waste flow table in Appendix E.
4. LANDFILL GAS MONITORING
4.1. MONITORING REQUIREMENT
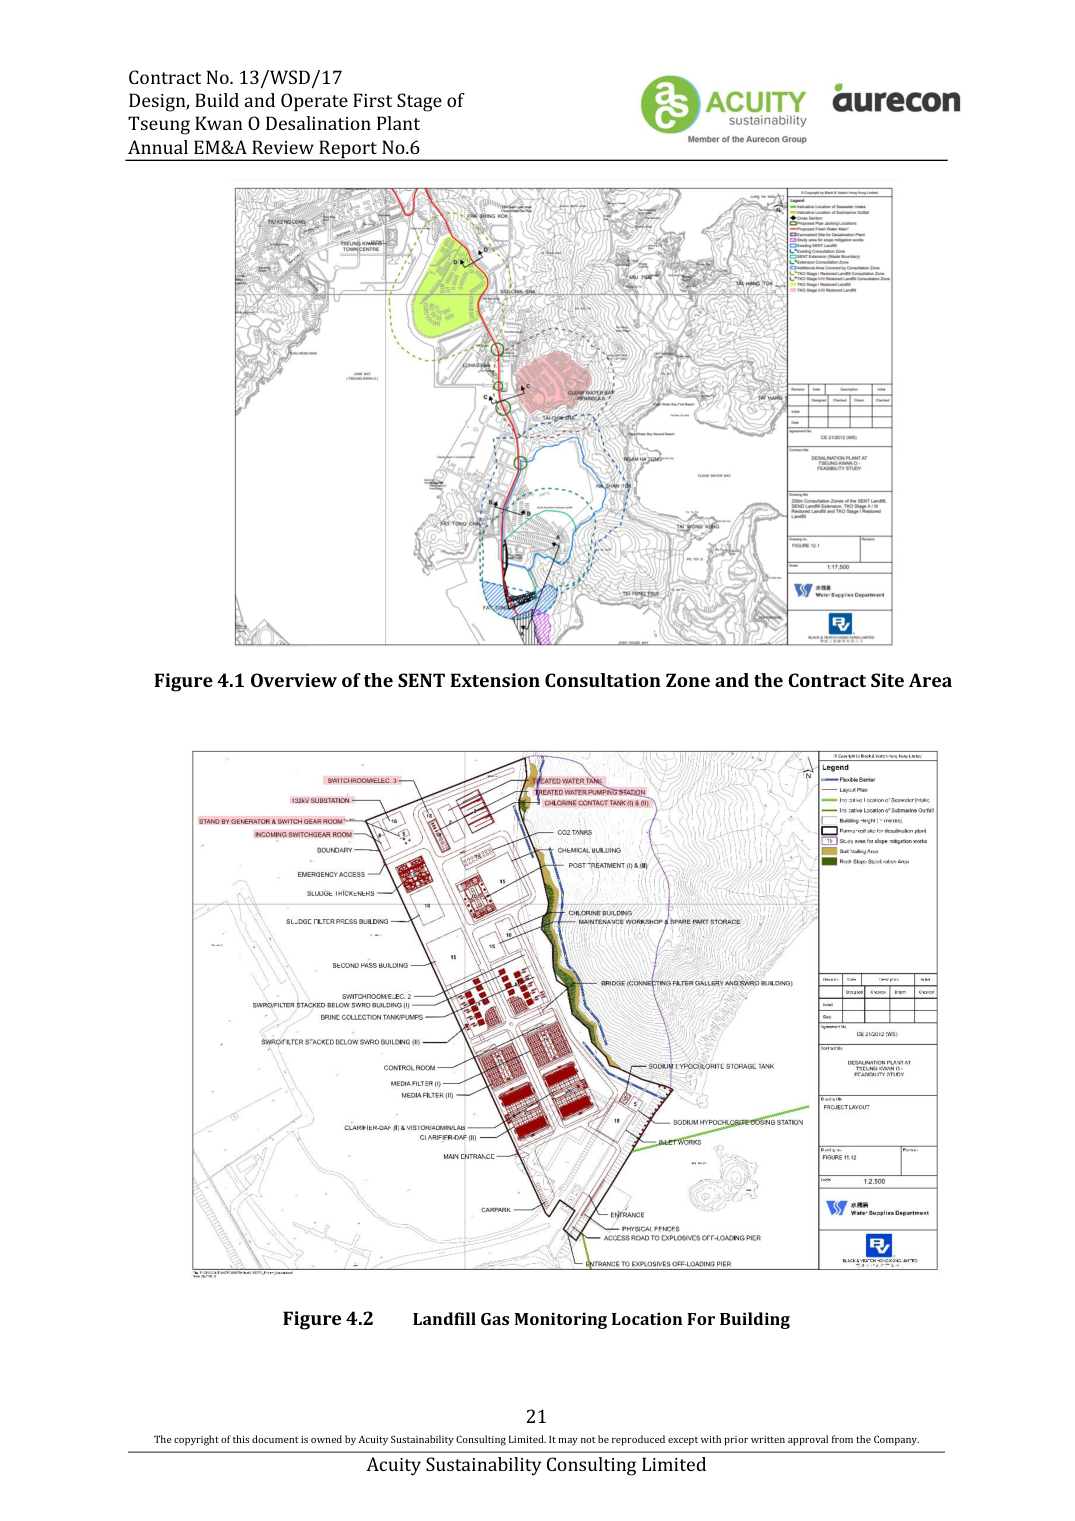
In accordance with Section 11 of the EM&A Manual, monthly monitoring of landfill gas is required for the first year of operation at buildings within the Project Site and consultation zone. Part of the desalination plant and the indicative area of natural slope mitigation works fall within the SENT Landfill Extension Consultation Zone; and part of the 1,200 mm diameter freshwater mains along Wan Po Road falls within the SENT Landfill and SENT Landfill Extension Consultation Zones, TKO Stage II/III Restored Landfill and TKO Stage I Restored Landfill Consultation Zones.
Routine monitoring is required at buildings within the Project Site and consultation zones. The monitoring frequency will be monthly for the first year of operation.
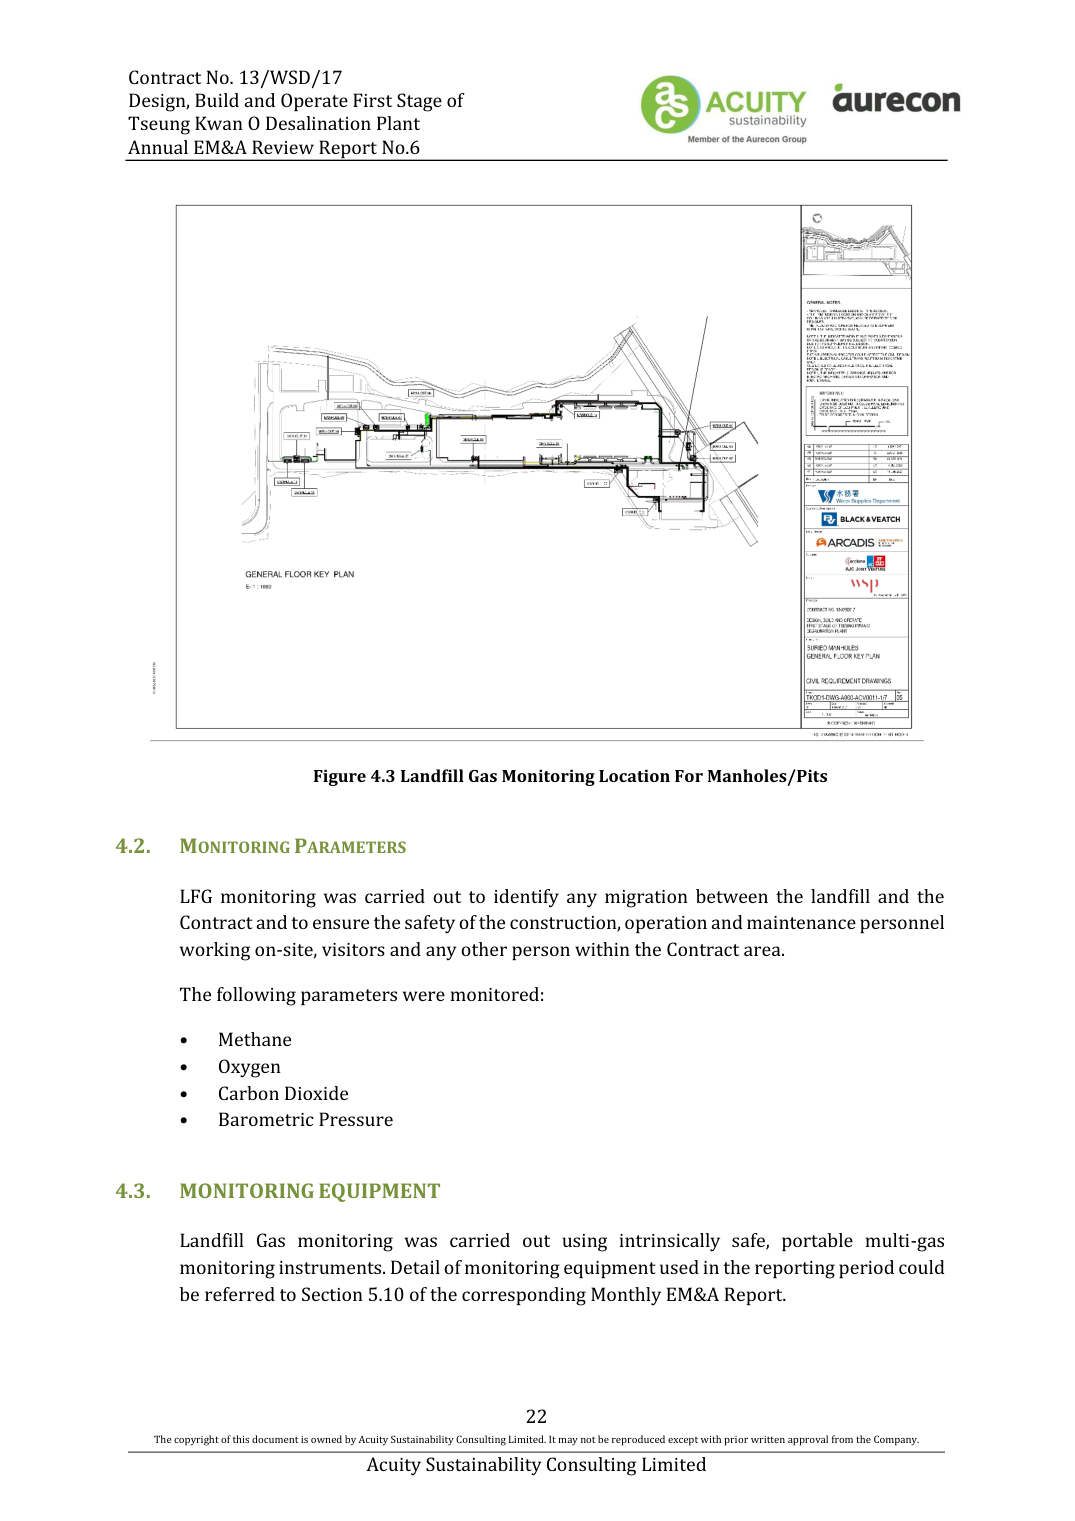
For the manholes and utility pits within the Project Site and along the fresh water mains, each manhole/ utility pit should be monitored with two measurements (at mid depth and base). Each measurement should be monitored for a minimum of 10 minutes. A steady reading and peak reading should be recorded at each manhole/ utility pit and for each measurement.
Monitoring oxygen, methane, carbon dioxide and barometric pressure would be performed monthly during the operation phase.
The area required to be monitored for landfill gas in the reporting period is shown in Figure 4.1, Figure 4.2 and Figure 4.3.
4.4. MONITORING RESULTS AND OBSERVATIONS
Five (5) times of landfill gas monitoring were conducted in the reporting period. No action or limit level exceedance was recorded in the reporting period.
Action and Limit Level are provided in Table 4.1.
Table 4.1 Action / Limit Levels and Event and Action Plan for LFG Hazard
Parameters | Action Level | Limit Level |
Oxygen (O ) | <19% O | <19% O |
Methane (CH ) | >10% LEL | >20% LEL |
Carbon Dioxide (CO ) | >0.5% CO | >1.5% CO |
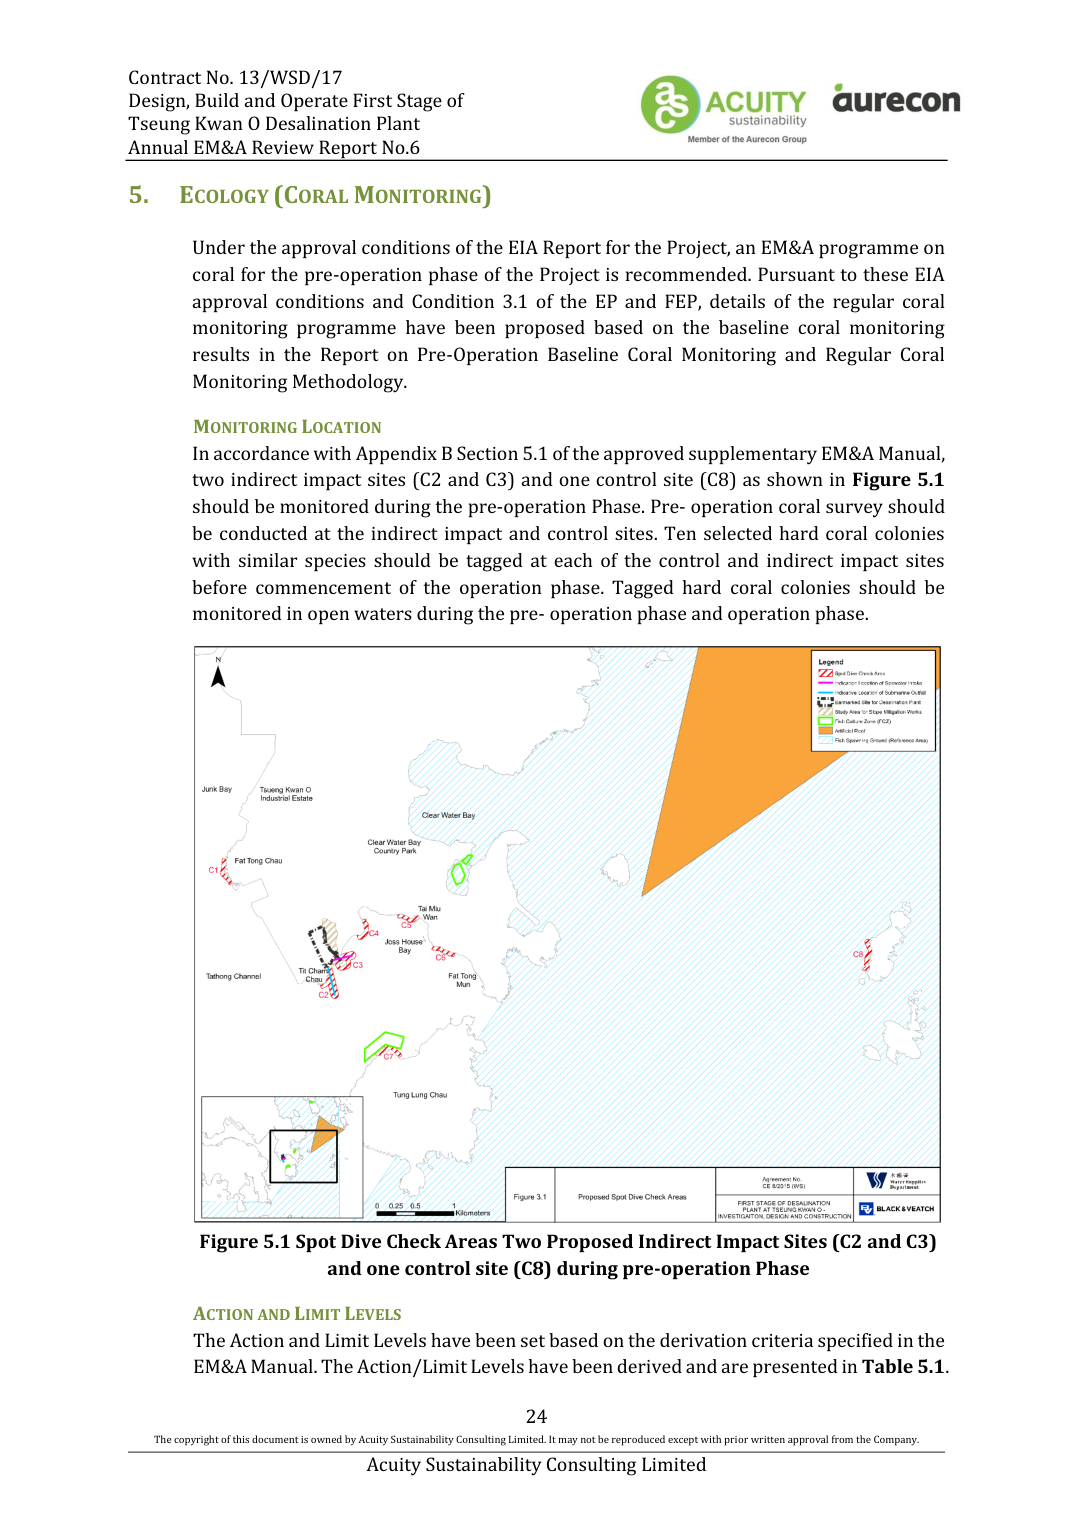
Table 5.1 Action and Limit Level for Coral Monitoring Equipment
Parameter | Action Level Definition | Limit Level Definition |
Mortality | If during Impact Monitoring a | If during Impact Monitoring a |
Note: If the defined Action Level or Limit Level for coral monitoring is exceeded, the actions as set out in Table E3 of Appendix E will be implemented.
If non-compliance were found during the construction works, the actions in accordance with the Event and Action Plan will be carried out according to Appendix H.
MONITORING FREQUENCY Operation phase coral monitoring shall be monitored once per month as the requirement of the first year of operational phase.
According to the approved proposal to change the operation phase EM&A programme for the 2nd to 10th year, coral monitoring will be conducted on a quarterly basis starting from August 2025.
MONITORING RESULT AND OBSERVATION
A total of eight (8) operation phase coral monitoring were conducted. There were no AL/LL exceedances observed during the reporting period. The detailed result of the monitoring is presented in Appendix I of the Monthly EM&A Report.
6. ECOLOGY (FISHERY MONITORING)
The purpose of the operation phase regular fisheries monitoring programme is to monitor the potential impacts on fisheries resources in the vicinity of the project site. Apart from the regular fisheries monitoring programme, a water quality monitoring programme in addition to the water quality monitoring programme in the approved EM&A Manual is also described in Section 2.4 to (i) provide supplementary information in the interpretation of the findings of the fisheries monitoring and (ii) assist the monitoring of the potential impact on the Tung Lung Chau Fish Culture Zone (FCZ) in Joss House Bay.
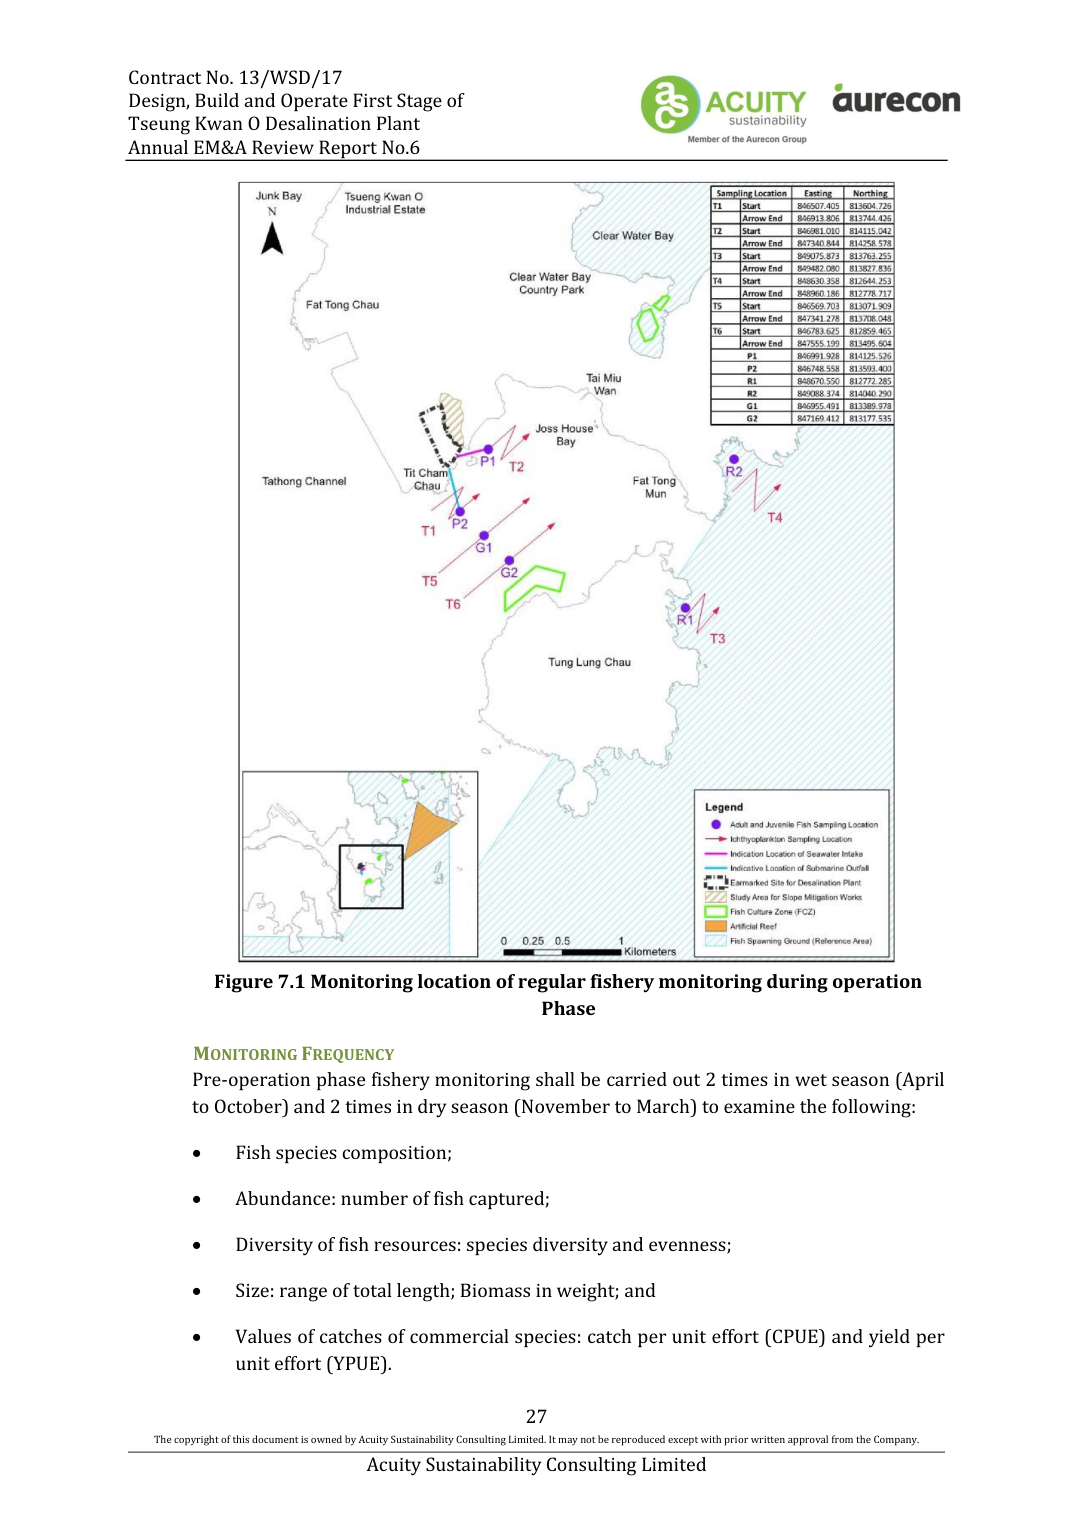
MONITORING LOCATION In accordance with Section 2.3 of the approved Methodology Paper on Regular Fisheries Monitoring, it is recommended to set up six (6) fisheries monitoring locations in Joss House Bay and its vicinity to monitor the fisheries resources.
Two (2) sampling locations are set up in close proximity of the direct footprint of the proposed submarine utilities around TKO Area 137. These sampling locations represent the potential Project impact zones (i.e. areas at and in close proximity to the footprint of the proposed submarine utilities that will be directly affected by the Project works).
Two (2) gradient locations are proposed between the proposed submarine utilities and Tung Lung Chau FCZ to assist in the interpretation and identification of any potential fisheries impact in the vicinity of the FCZ.
Two (2) reference locations are proposed in the outer Joss House Bay between the waters of Tung Lung Chau and Fat Tong Mun. These reference locations are further away and will not be affected by the Project discharge (based on the EIA prediction) and will serve as control stations. Any significant fisheries impact identified at the reference locations should be caused by other natural factors or non-Project activities. The trends of fisheries conditions recorded in the reference locations will be used to assist in the interpretation of the trends of fisheries impact identified in the impact and gradient locations.
The coordinates of the proposed monitoring locations are shown in Figure 7.1.
MONITORING RESULT AND OBSERVATION Four (4) operation phase fishery monitoring were conducted during the reporting period. For wet season was carried out in 16 and 23 August 2025 and for dry season was carried out in 7 and 15 February 2026. No AL/LL exceedance was recorded during the reporting period. The detailed result of the monitoring is presented in the Monthly EM&A Report.
Operation Phase Impact Water Quality Monitoring was conducted from 1 May 2025 and completed on 30 June 2025. A total of three (3) action level exceedances and eleven (11) limit level exceedances of SS were recorded.
The continuous monitoring of effluent quality was conducted from 1 May 2025 to 31 July 2025. No exceedance of the sampling was obtained during the reporting period.
According to the approved proposal to change the operation phase EM&A programme for the 2nd to 10th year, continuous monitoring of effluent quality was discontinued and replaced with effluent water monitoring in compliance with discharge license requirements starting from 15 August 2025.
Weekly in-situ monitoring and monthly laboratory measurements of the effluent quality were conducted from September 2025 to April 2026. No exceedance of the results was obtained during the reporting period. The detail results can be referred to the Monthly EM&A Report.
Monthly operational landfill gas monitoring was conducted from 1 May 2025 to 31 July 2025.
According to the approved proposal to change the operation phase EM&A programme for the 2nd to 10th year, landfill gas monitoring will be conducted on a six-month basis starting from August 2025.
A total of five (5) landfill gas monitoring was conducted during the reporting period. No exceedances of the Action or Limit Levels were recorded during the reporting period.
According to the approved proposal to change the operation phase EM&A programme for the 2nd to 10th year, coral monitoring will be conducted on a quarterly basis starting from August 2025.
A total of eight (8) operation phase coral monitoring was conducted. There were no AL/LL exceedances observed during the reporting period.
Four (4) operation phase fishery monitoring were conducted during the reporting period. For wet season was carried out in 16 and 23 August 2025 and for dry season was carried out in 7 and 15 February 2026. No AL/LL exceedance was recorded during the reporting period.
No complaint, notification of summons and prosecution was received in the reporting period. Summary of complaint log are presented in Appendix G.
8. EM&A SITE INSPECTION
Site inspections were carried out on a weekly basis to monitor the implementation of proper environmental pollution control and mitigation measures under the Contract from May 2025 to August 2025.
According to the approved proposal to change the operation phase EM&A programme for the 2nd to 10th year, site inspection will be conducted on a bi-weekly basis starting from 15 August 2025.
Thirty-seven (37) site inspections were carried out in the reporting period.
Environmental deficiencies were observed during weekly site inspection. Key observations during the site inspections and during the reporting period could be referring to Appendix D and corresponding Monthly Report.
According to the EIA Study Report, Environmental Permit, contract documents and EM&A Manual, the mitigation measures detailed in the documents should be implemented as much as practical during the reporting period. An updated Implementation Status of Environmental Mitigation Measures (EMIS) is provided in Appendix B.
9. CONCLUSIONS AND RECOMMENDATIONS
This is the 6th Annual EM&A Review Report for the Project which summarizes the key findings of the EM&A programme during the reporting period from 1 May 2025 to 30 April 2026, in accordance with the EM&A Manual and the requirement under FEP – 01/503/2015/A and FEP – 01/503/2015/B.
Operation Phase Impact Water Quality Monitoring was conducted from 1 May 2025 and completed on 30 June 2025. A total of three (3) action level exceedances and eleven (11) limit level exceedances of SS were recorded.
The continuous monitoring of effluent quality was conducted from 1 May 2025 to 31 July 2025. No exceedance of the sampling was obtained during the reporting period.
According to the approved proposal to change the operation phase EM&A programme for the 2nd to 10th year, continuous monitoring of effluent quality was discontinued and replaced with effluent water monitoring in compliance with discharge license requirements starting from 15 August 2025.
Weekly in-situ monitoring and monthly laboratory measurements of the effluent quality were conducted from September 2025 to April 2026. No exceedance of the results was obtained during the reporting period. The detail results can be referred to the Monthly EM&A Report.
Monthly operational landfill gas monitoring was conducted from 1 May 2025 to 31 July 2025.
According to the approved proposal to change the operation phase EM&A programme for the 2nd to 10th year, landfill gas monitoring will be conducted on a six-month basis starting from August 2025.
A total of five (5) landfill gas monitoring was conducted during the reporting period. No exceedances of the Action or Limit Levels were recorded during the reporting period.
According to the approved proposal to change the operation phase EM&A programme for the 2nd to 10th year, coral monitoring will be conducted on a quarterly basis starting from August 2025.
A total of six (6) operation phase coral monitoring was conducted. There were no AL/LL exceedances observed during the reporting period.
Four (4) operation phase fishery monitoring were conducted during the reporting period. For wet season was carried out in 16 and 23 August 2025 and for dry season was carried out in 7 and 15 February 2026. No AL/LL exceedance was recorded during the reporting period.
Environmental site inspection was conducted during the reporting period. Minor deficiency was observed during site inspection. The environmental performance of the project was therefore considered satisfactory.
According to the environmental site inspections performed in the reporting period, the Contractor is reminded to pay attention on maintaining proper materials storage, site tidiness and chemical storage on site.
No environmental complaint, notifications of summons and prosecution was received during the reporting period.
The ET will keep track on the construction works to confirm compliance of environmental requirements and the proper implementation of all necessary mitigation measures.
Appendix A
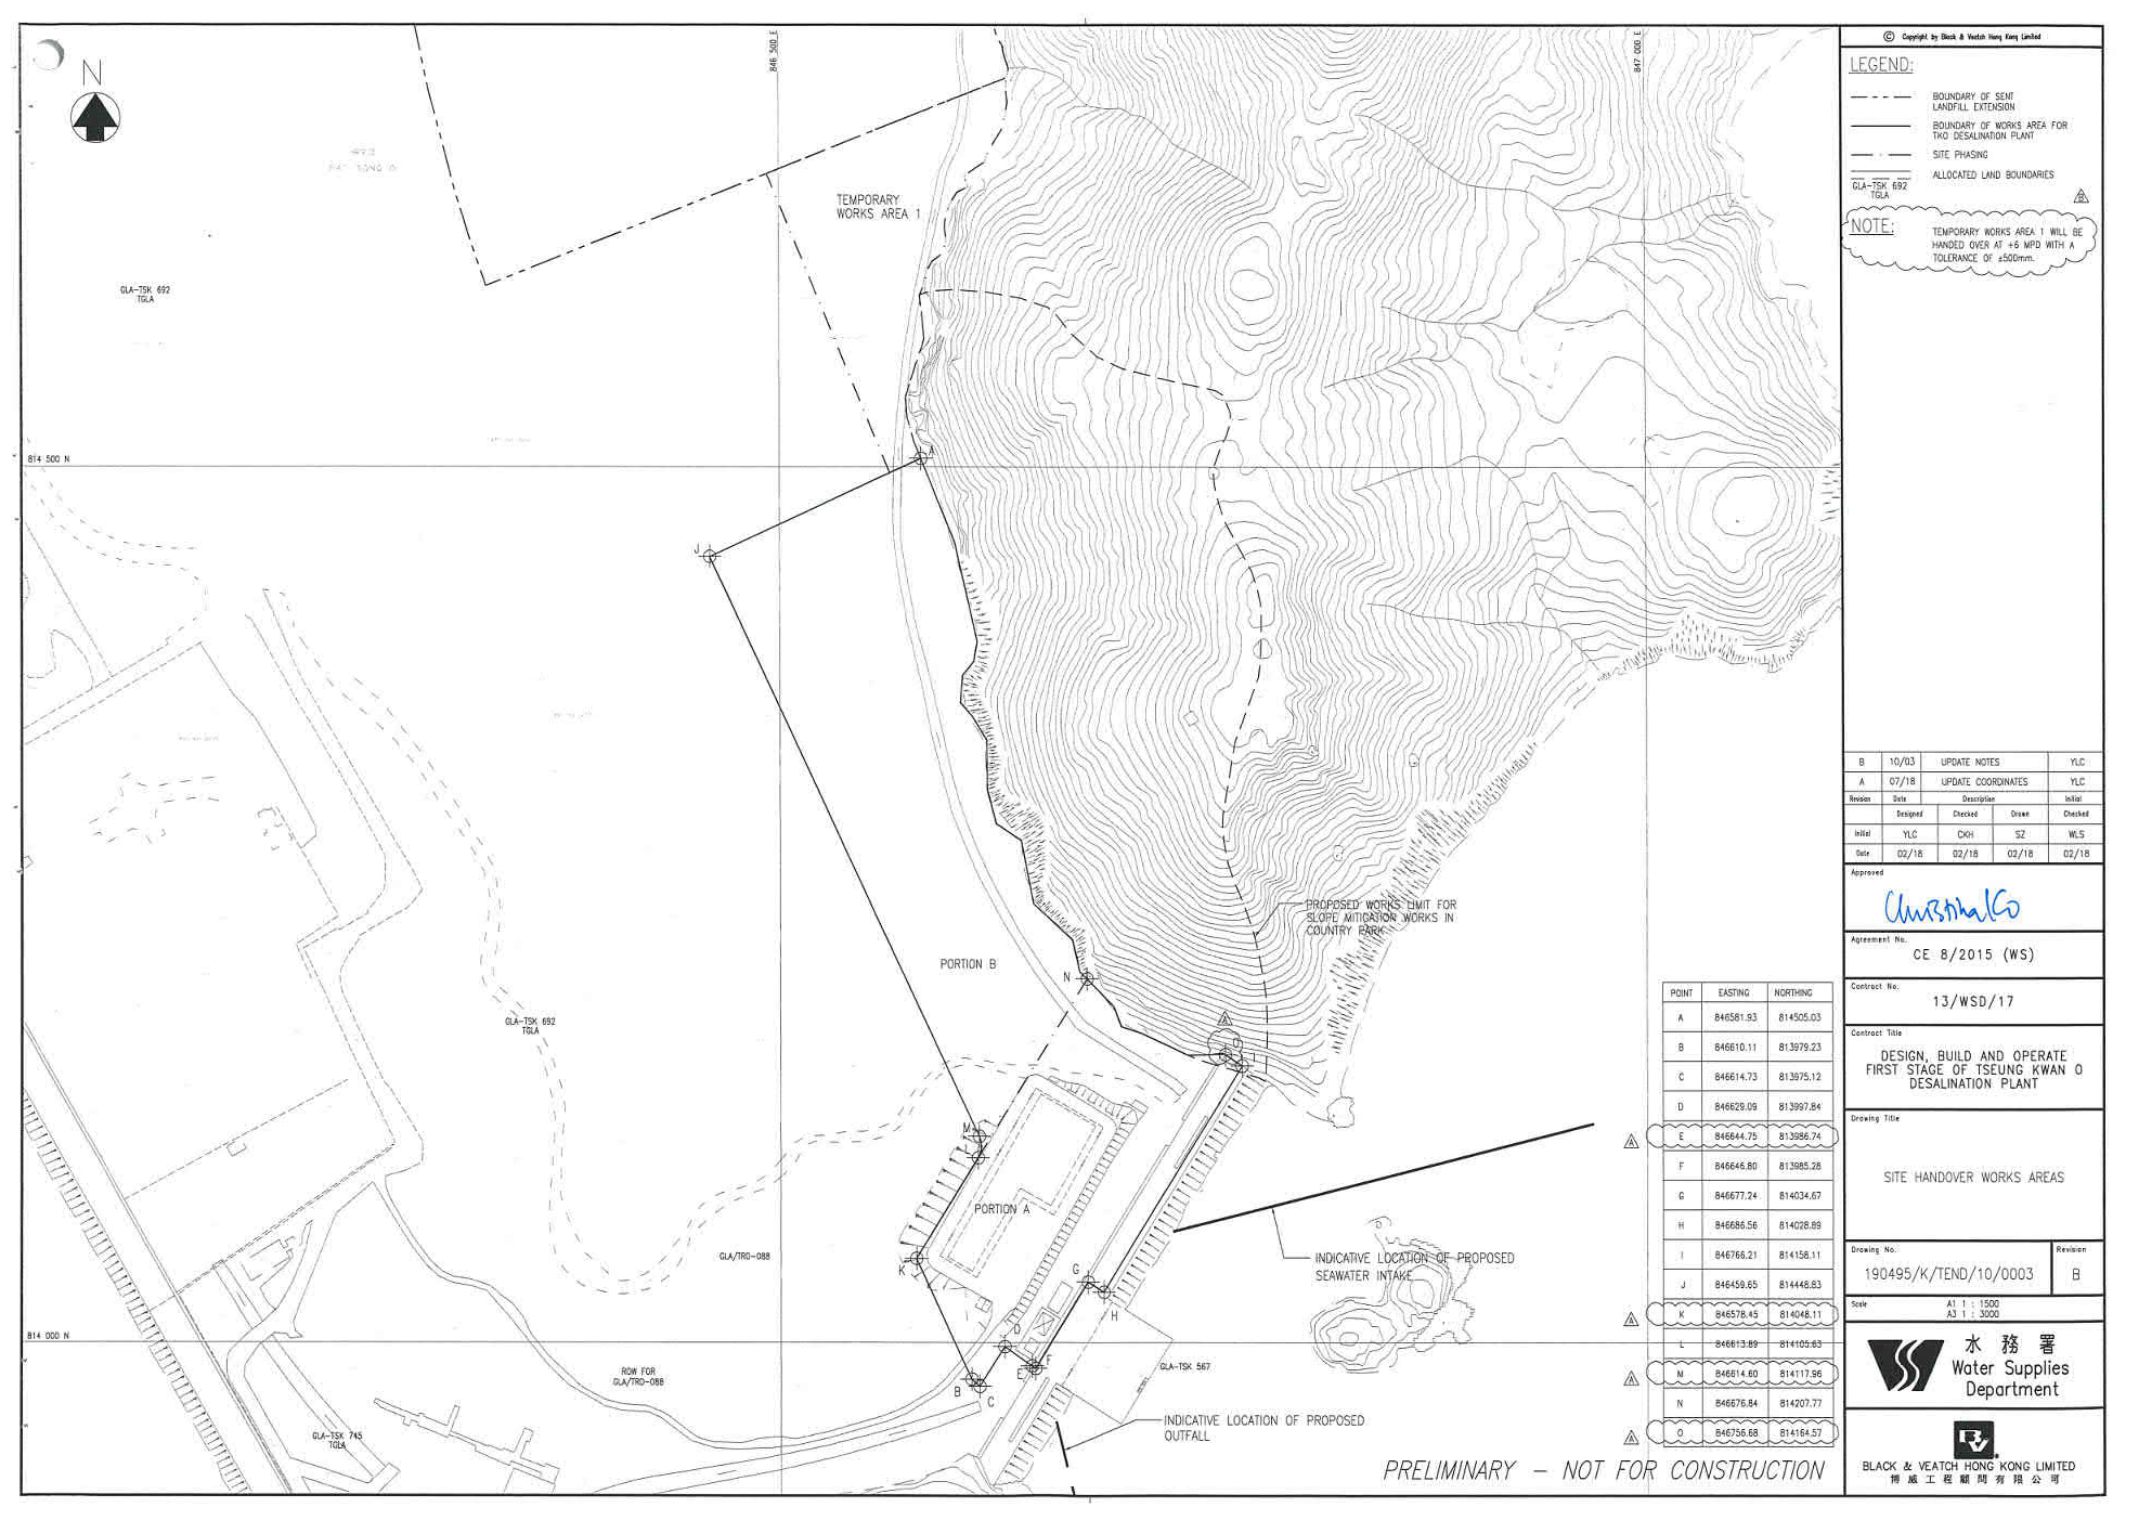
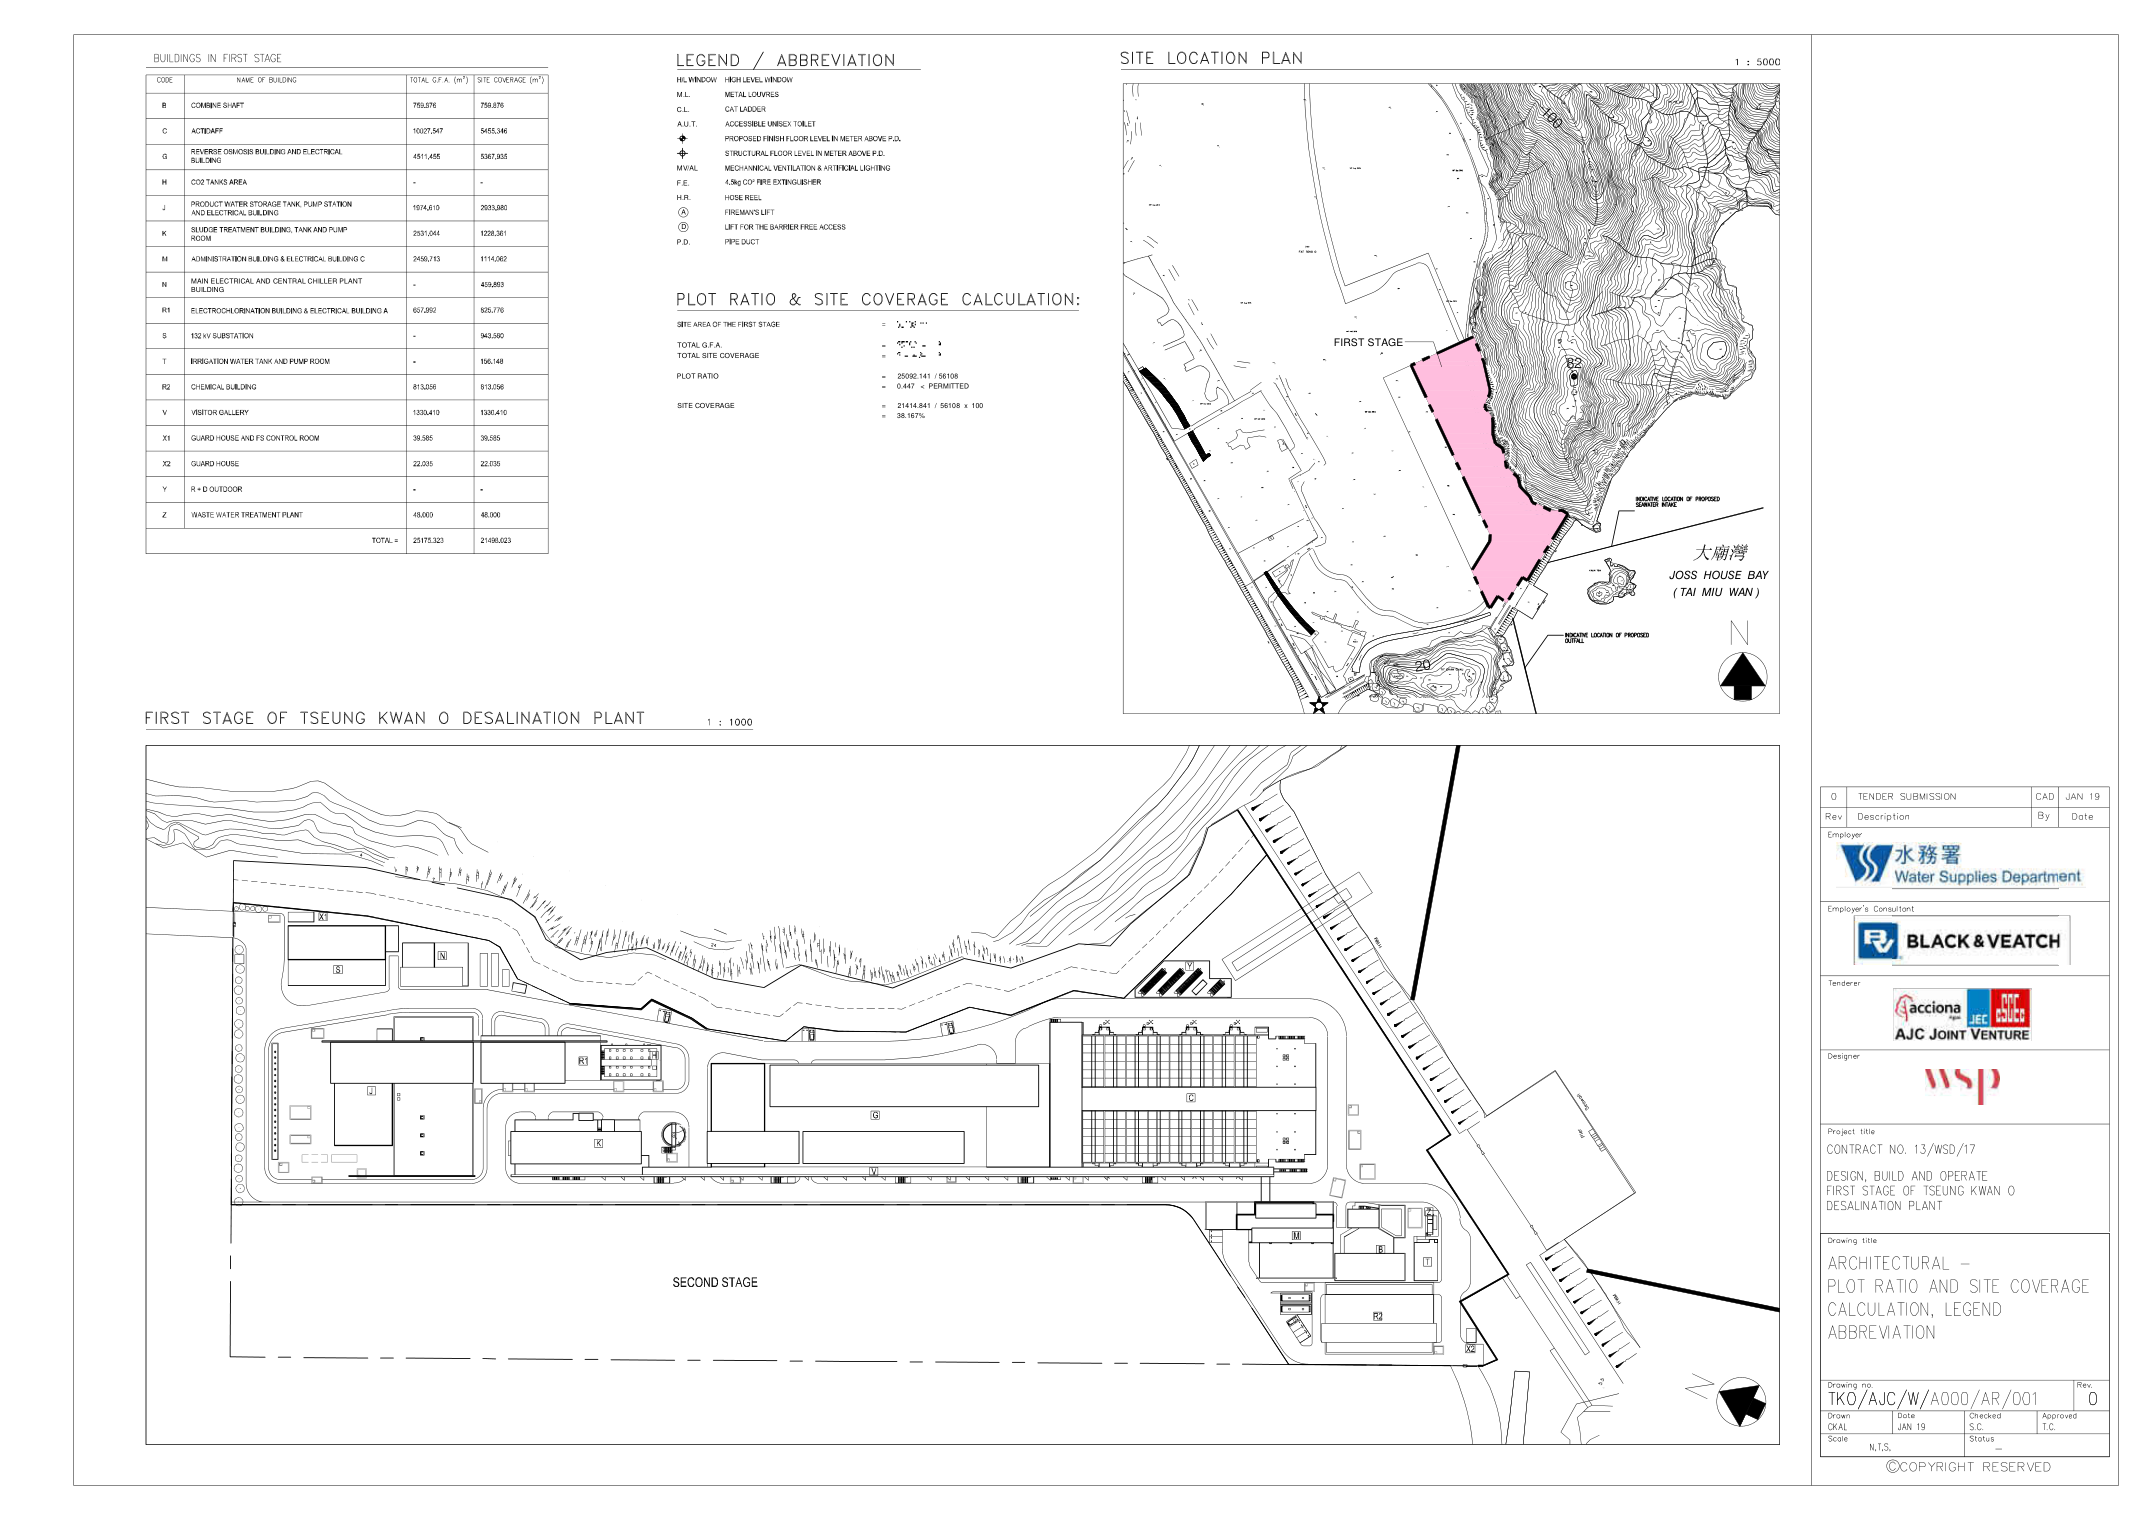
Overview of Desalination Plant in Tseung Kwan O
Appendix B
Summary of Implementation Status of Environmental Mitigation
EIA | Recommended Environmental Protection Measures/ | Objectives of the | Implementation Agent | Implementation | Implementation | Relevant Legislation | ||
D | C | O | ||||||
Air Quality | ||||||||
S4.8.1 | Ultra-low-sulphur diesel (ULSD) will be used for all construction | Land site/ During | Contractor(s) | ✓ | ✓ | Implemented | Environment, Transport | |
Water Quality | ||||||||
S6.9 and | The sterilization water should be dechlorinated with total residual | Sterilization of water mains | Contractor(s) | ✓ | ✓ | Implemented | Technical | |
S6.9 | The cleaning and flushing water should also be treated and desilted | Sterilization of water mains | Contractor(s) | ✓ | ✓ | Implemented | ||
S6.9 | Site drainage should be well maintained, and good construction | Land site & drainage/ During | Contractor(s) | ✓ | ✓ | Implemented | - | |
Waste Management | ||||||||
S8.5 | Provision of sufficient waste disposal points and regular collection | All area/ During construction/ | Contractor(s) | ✓ | ✓ | Implemented | DEVB TC(W) No. | |
S8.5 | Chemical waste container shall be suitable for the substance they | All area/ During | Contractor(s)/ WSD | ✓ | ✓ | Implemented | Waste Disposal | |
S8.5 | Chemical waste container shall have a capacity of less than 450 L | All area/ During | Contractor(s)/ WSD | ✓ | ✓ | Implemented | ||
S8.5 | A label in English and Chinese shall be displayed on the chemical | All area/ During | Contractor(s)/ WSD | ✓ | ✓ | Implemented |
EIA | Recommended Environmental Protection Measures/ | Objectives of the | Implementation Agent | Implementation | Implementation | Relevant Legislation | ||
D | C | O | ||||||
S8.5 | Storage areas for chemical waste shall be enclosed on at least 3 | All area/ During | Contractor(s)/ WSD | ✓ | ✓ | Implemented | ||
S8.5 | Storage areas for chemical waste shall have an impermeable floor | All area/ During | Contractor(s)/ WSD | ✓ | ✓ | Implemented | ||
S8.5 | Storage areas for chemical waste shall have adequate ventilation. | All area/ During | Contractor(s)/ WSD | ✓ | ✓ | Implemented | ||
S8.5 | Storage areas for chemical waste shall be covered to prevent | All area/ During | Contractor(s)/ WSD | ✓ | ✓ | Implemented | ||
S8.5 | Storage areas for chemical waste shall be arranged so that | All area/ During | Contractor(s)/ WSD | ✓ | ✓ | Implemented | ||
S8.5 | General refuse will be stored in enclosed bins or compaction units | All area/ During | Contractor(s)/ WSD | ✓ | ✓ | Implemented | ||
S8.5 | Adequate number of waste containers will be provided to avoid | All area/ During | Contractor(s)/ WSD | ✓ | ✓ | Implemented | DEVB TC(W) No. | |
S8.5 | A reputable waste collector will be employed by the Contractor to | All area/ During | Contractor(s)/ WSD | ✓ | ✓ | Implemented | - | |
S8.5 | Recycling bins will be provided at strategic locations within the Site | All area/ During | Contractor(s)/ WSD | ✓ | ✓ | Implemented | - | |
Landscape & Visual | ||||||||
S11.10 & | The construction area and area allowed for temporary structures, | All area/ Detailed design/ | WSD/ Contractor(s) | ✓ | ✓ | ✓ | Implemented | - |
EIA | Recommended Environmental Protection Measures/ | Objectives of the | Implementation Agent | Implementation | Implementation | Relevant Legislation | ||
D | C | O | ||||||
S11.10 & | At the detailed design stage, the design team will seek to minimize | All area/ Detailed design/ | WSD/ Contractor(s) | ✓ | ✓ | ✓ | Implemented | - |
S11.10 & | Design principles will be adopted to take into account the | All area/ Detailed design/ | WSD/ Contractor(s) | ✓ | ✓ | ✓ | Implemented | - |
S11.10 & | All trees within the Project Site or the potential slope mitigation | All area/ Detailed design/ | WSD/ Contractor(s) | ✓ | ✓ | ✓ | Implemented | ETWB TCW No. 3/2006 |
S11.10 & | No tree within the Country Park will be felled. Trees within the | All area/ Detailed design/ | WSD/ Contractor(s) | ✓ | ✓ | ✓ | Implemented | DEVB TC(W) No. |
S11.10 & | Any slope mitigation works necessary to address natural terrain | All area/ Detailed design/ | WSD/ Contractor(s) | ✓ | ✓ | ✓ | Implemented | |
S11.10 & | Dredging works for the installation of intake structures and outfall | All area/ Detailed design/ | WSD/ Contractor(s) | ✓ | ✓ | ✓ | Implemented |
EIA | Recommended Environmental Protection Measures/ | Objectives of the | Implementation Agent | Implementation | Implementation | Relevant Legislation | ||
D | C | O | ||||||
installation. (MM7) | ||||||||
S11.10 & | All night-time lighting will be reduced to a practical minimum | All area/ Detailed design/ | WSD/ Contractor(s) | ✓ | ✓ | ✓ | Implemented | - |
Landfill Gas Hazard | ||||||||
S12.7 | During all works, safety procedures should be implemented to | All area/ Detailed design/ | Contractor(s) | ✓ | ✓ | ✓ | Implemented | - |
S12.7 | During trenching and excavation as well as creation of confined | All area/ Detailed design/ | Contractor(s) | ✓ | ✓ | ✓ | Implemented | |
S12.7 | The Contractor should make the workers are aware of potential | All area/ Detailed design/ | Contractor(s) | ✓ | ✓ | ✓ | Implemented | |
S12.7 | Safety officers, specifically trained with regard to landfill gas and | All area/ Detailed design/ | Contractor(s) | ✓ | ✓ | ✓ | Implemented | |
S12.7 | All personnel who work on site and all visitors to the site should be | All area/ Detailed design/ | Contractor(s) | ✓ | ✓ | ✓ | Implemented | |
S12.7 | Monitoring for landfill gas should be undertaken in all excavations, | All area/ Detailed design/ | Contractor(s) | ✓ | ✓ | ✓ | Implemented | |
S12.7 | Monitoring frequency and areas to be monitored should be | All area/ Detailed design/ | Contractor(s) | ✓ | ✓ | ✓ | Implemented |
EIA | Recommended Environmental Protection Measures/ | Objectives of the | Implementation Agent | Implementation | Implementation | Relevant Legislation | ||
D | C | O | ||||||
S12.7 | Proceed drilling with adequate care and precautions against the | All area/ Detailed design/ | Contractor(s) | ✓ | ✓ | ✓ | Implemented | |
S12.7 | Prior to the commencement of the site works, the drilling | All area/ During | Contractor(s) | ✓ | ✓ | ✓ | Implemented | |
S12.7 | Where below ground service entries are necessary to the Incoming | All area/ Detailed design/ | Contractor(s) | ✓ | ✓ | ✓ | Implemented | |
S12.7 | It is recommended regular landfill gas monitoring should be | All area/ Detailed design/ | Contractor(s) | ✓ | ✓ | ✓ | Implemented | |
S12.7 | The manholes and utility pits within the Project Site and along the | All area/ Detailed design/ | Contractor(s) | ✓ | ✓ | ✓ | Implemented | |
S12.7 | All construction, operation and maintenance personnel working | All area/ Detailed design/ | Contractor(s) | ✓ | ✓ | ✓ | Implemented |
Note: D – Design stage C – Construction O – Operation
Appendix C
Water Quality Monitoring Graphical Presentation
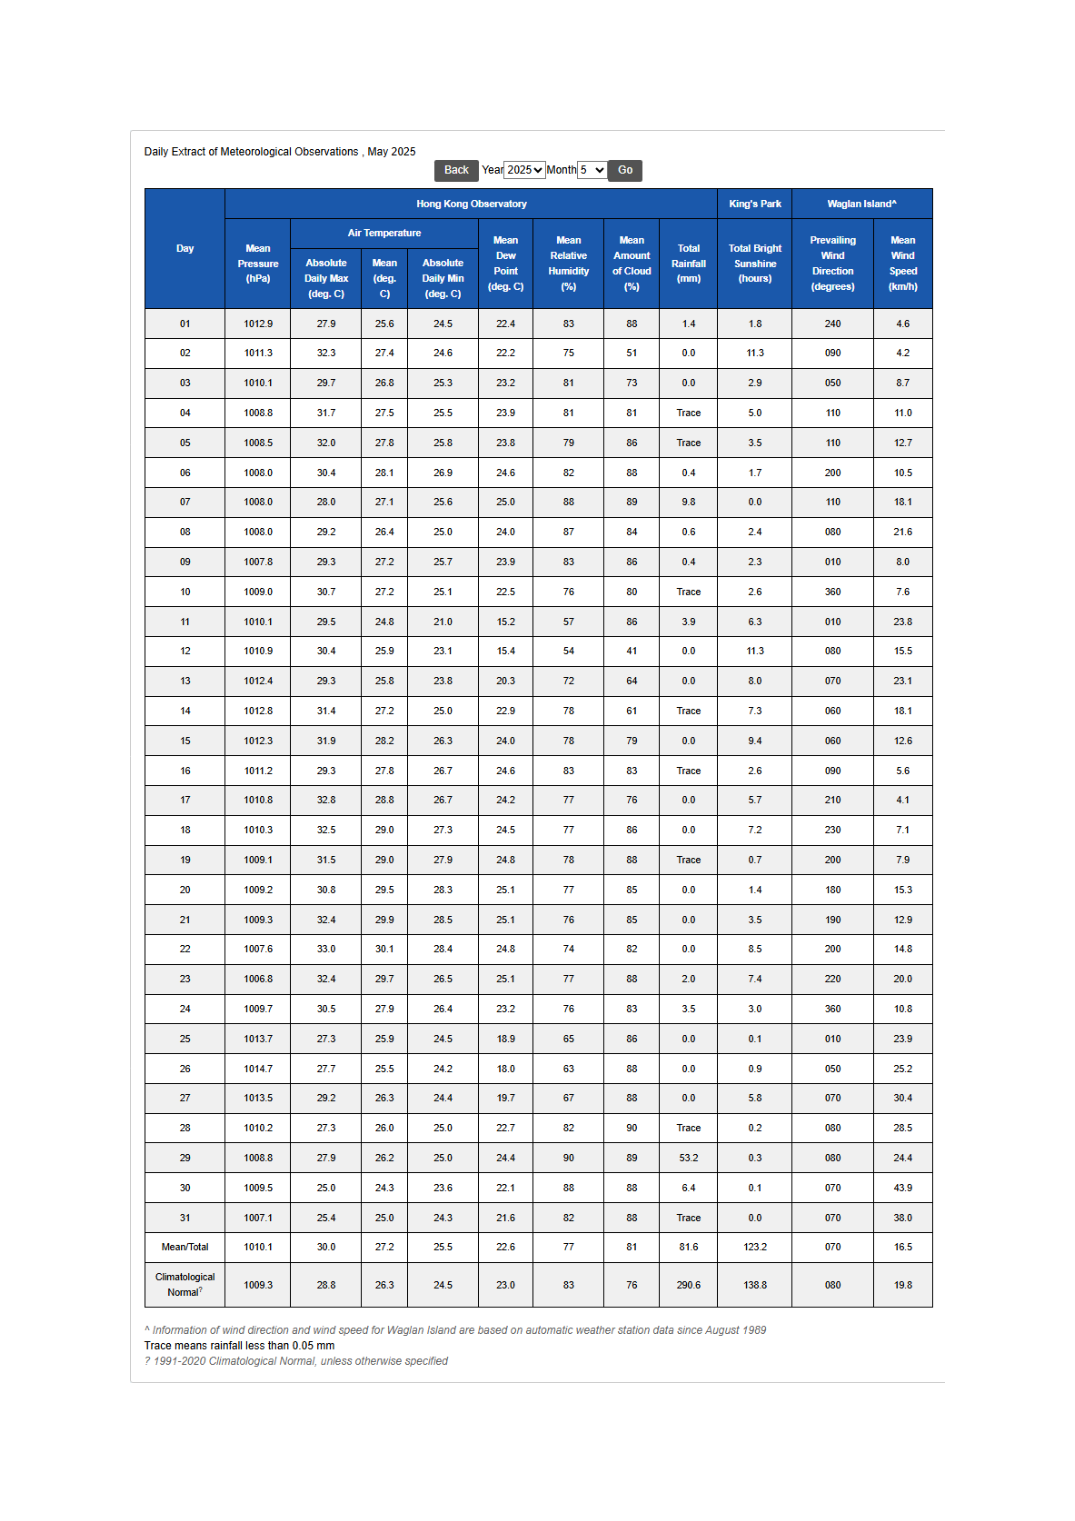
Appendix C.1 Weather Condition
Appendix C.2 Other Factor Might Affect the Monitoring Results
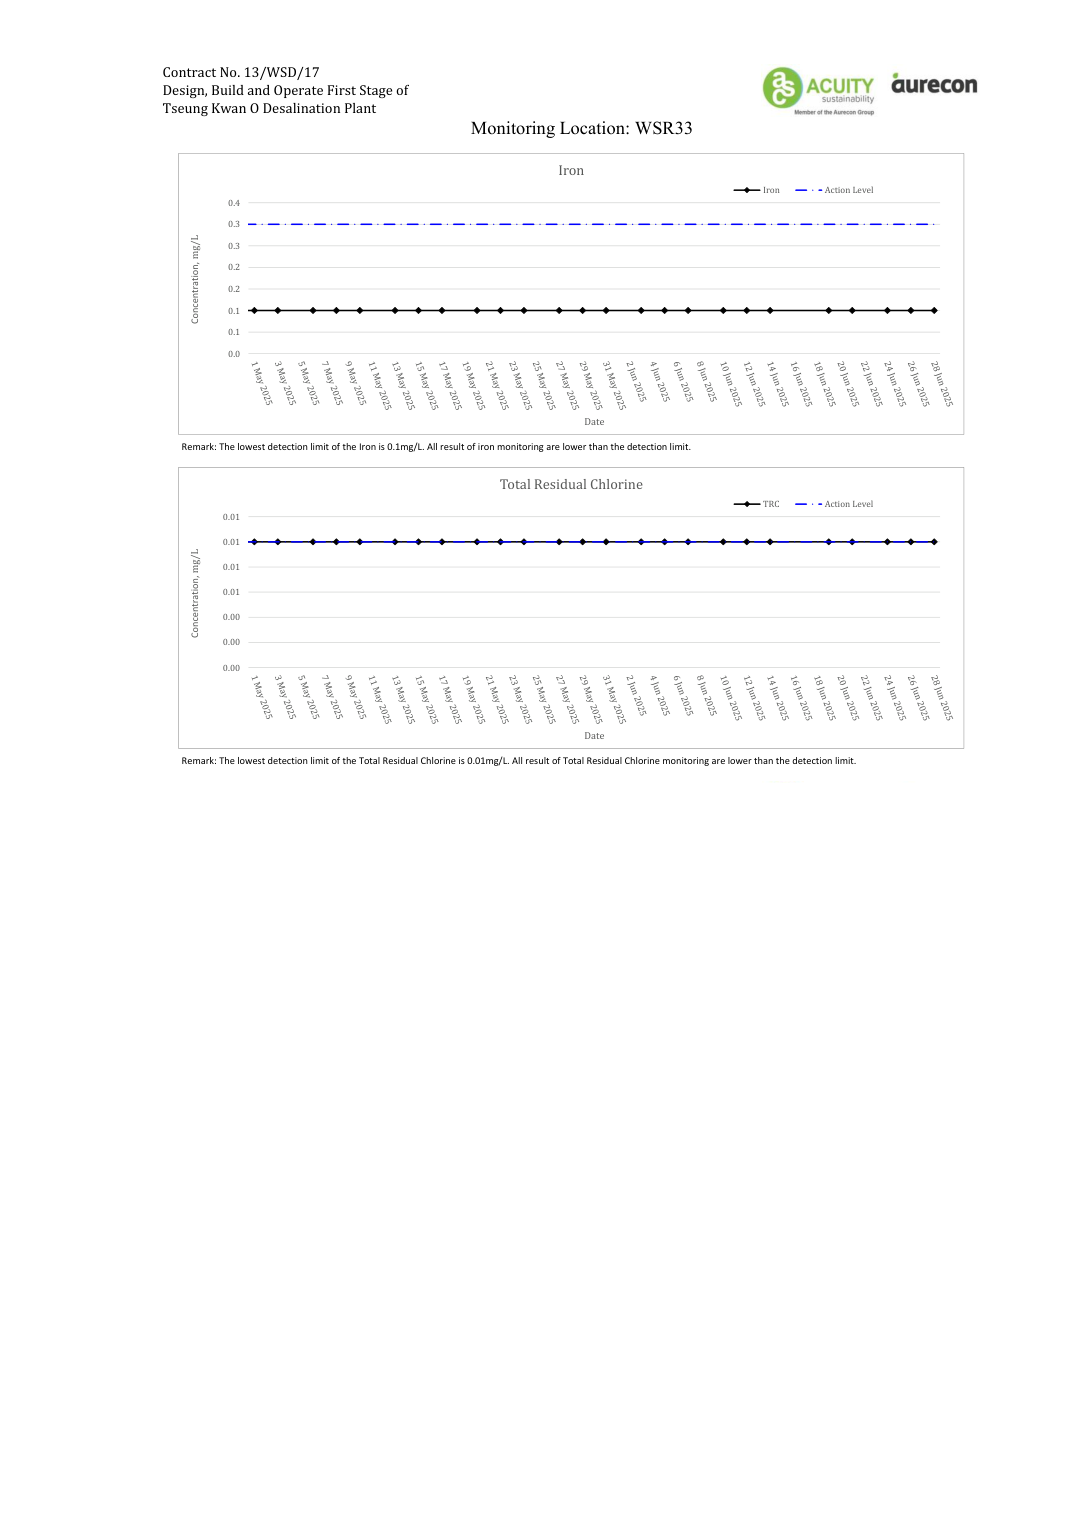
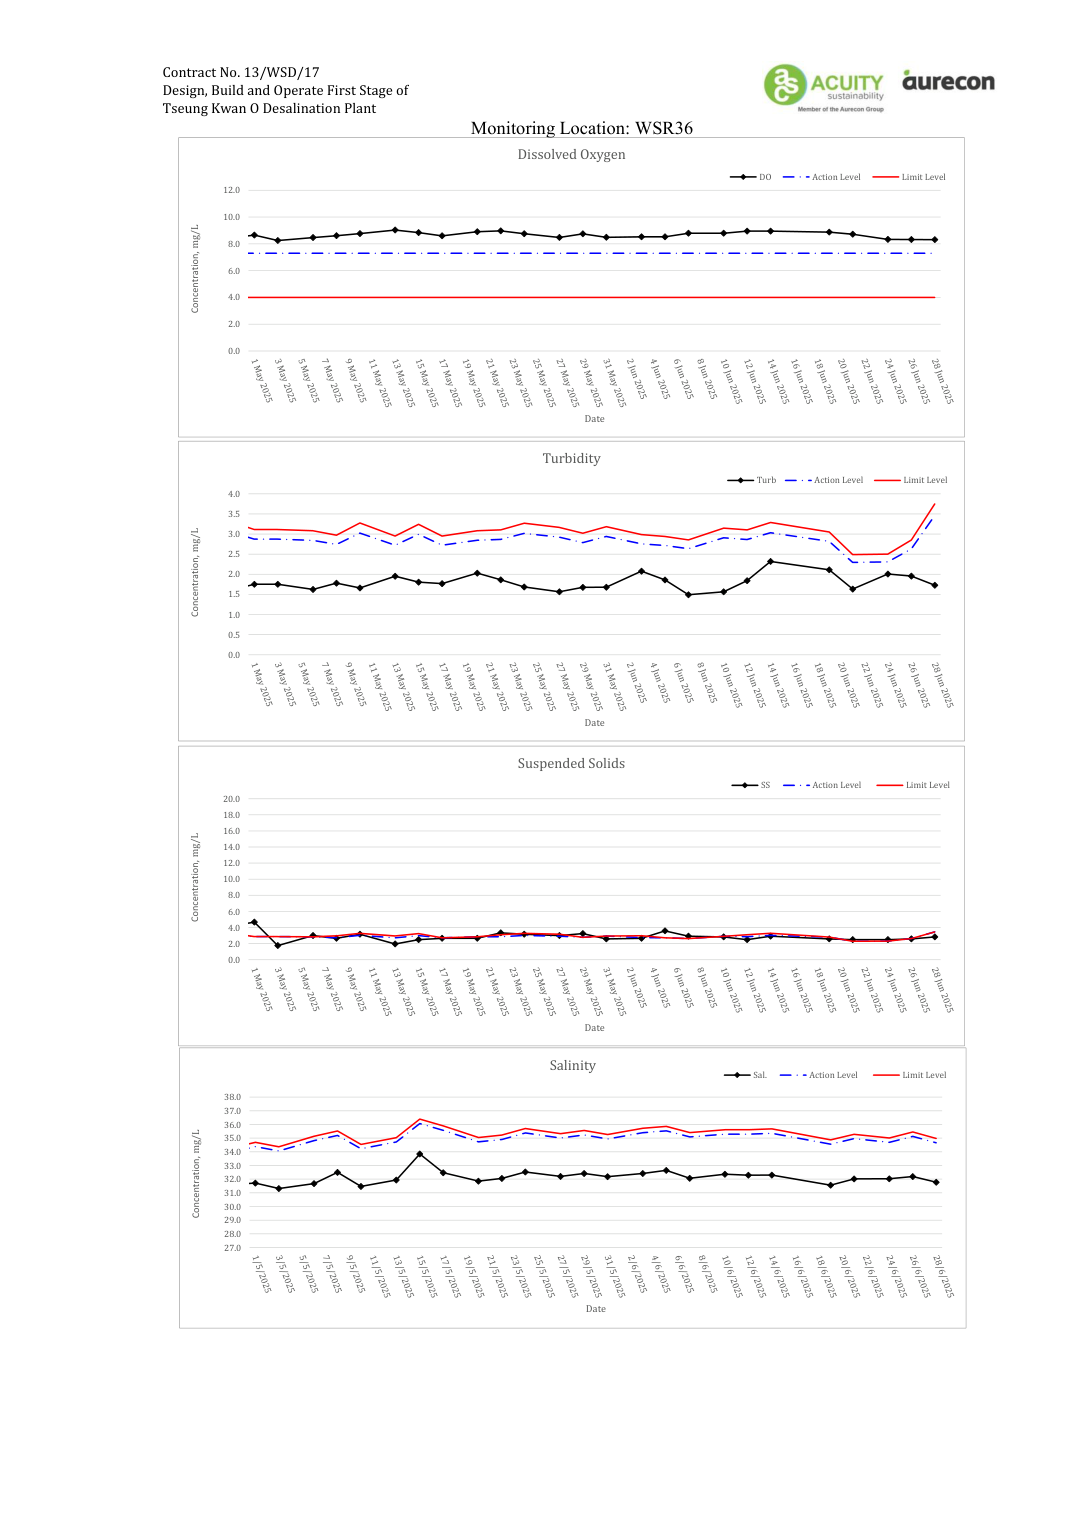
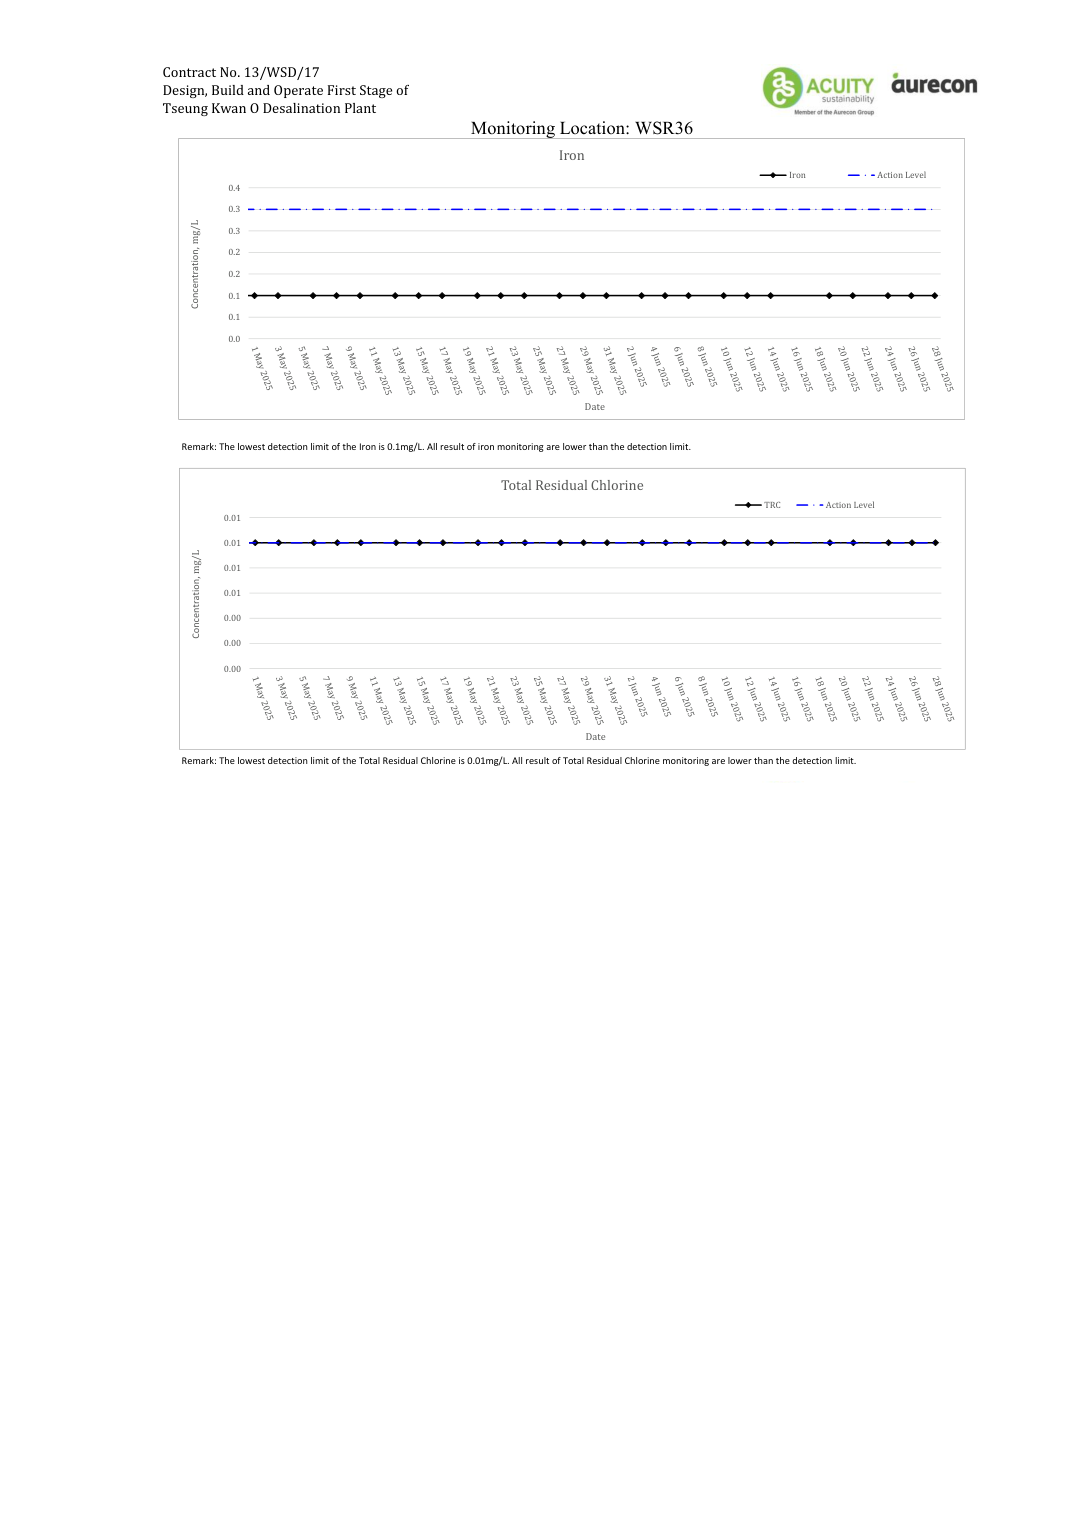
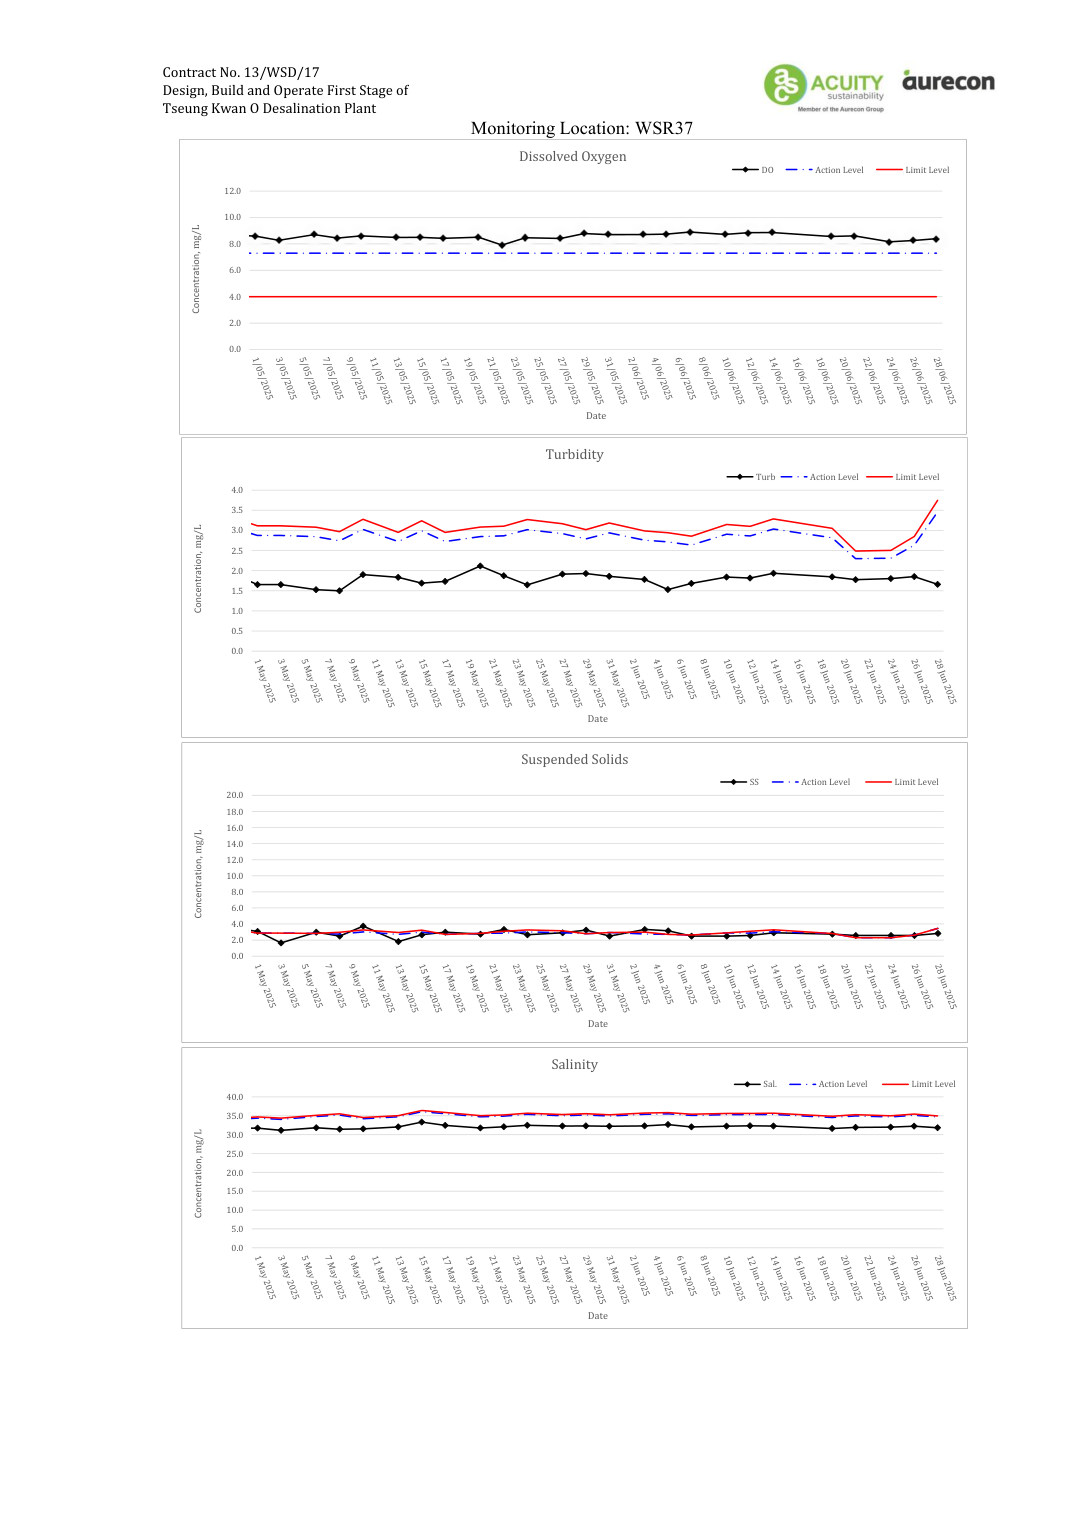
Appendix C.1
Weather Condition
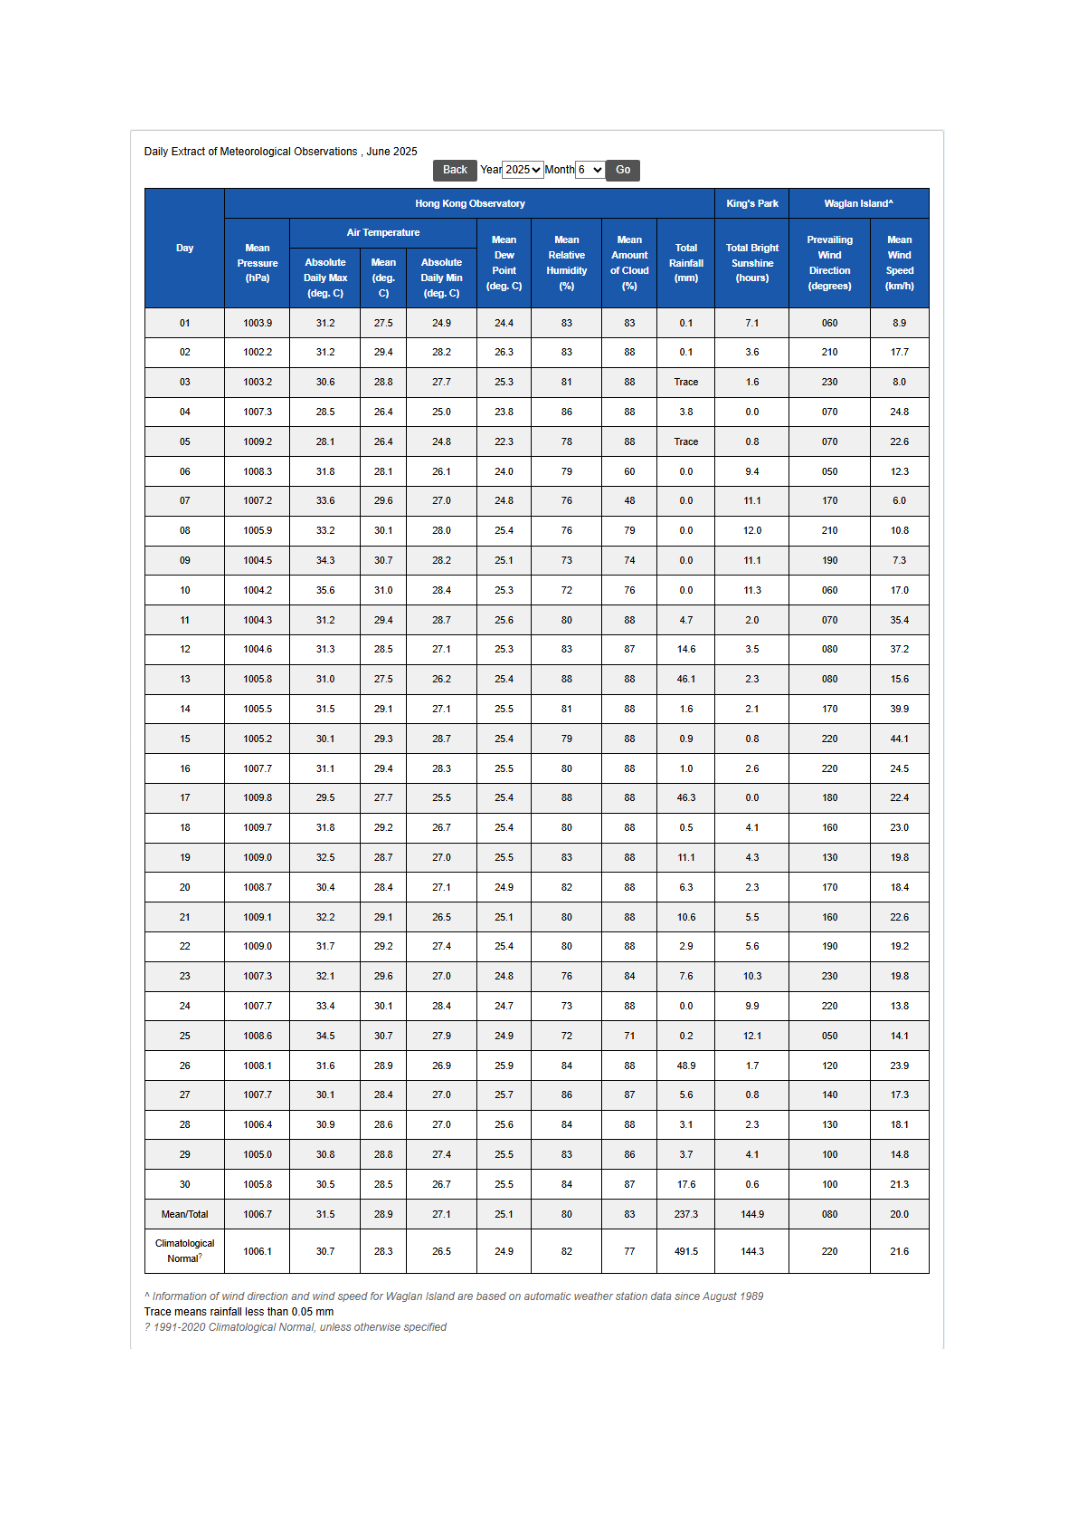
Appendix C.2 Other Factor Might Affect the Monitoring Results
Other Factors might affect the monitoring results | |
Reporting Period | |
May 2025 | Jun 2025 |
N/A | N/A |
Appendix D
Site Inspection Proforma
Table E1 Site Inspection Observation Record
Date | Environmental Observations | Follow-up Status |
May 2025 | ||
7 May 2025 | No major environmental deficiency was | N/A |
13 May 2025 | No major environmental deficiency was | N/A |
20 May 2025 | No major environmental deficiency was | N/A |
30 May 2025 | No major environmental deficiency was | N/A |
June 2025 | ||
3 Jun 2025 | No major environmental deficiency was | N/A |
10 Jun 2025 | No major environmental deficiency was | N/A |
17 Jun 2025 | No major environmental deficiency was | N/A |
23 Jun 2025 | No major environmental deficiency was | N/A |
July 2025 | ||
3 Jul 2025 | No major environmental deficiency was | N/A |
10 Jul 2025 | No major environmental deficiency was | N/A |
17 Jul 2025 | No major environmental deficiency was | N/A |
24 Jul 2025 | No major environmental deficiency was | N/A |
31 Jul 2025 | No major environmental deficiency was | N/A |
Date | Environmental Observations | Follow-up Status |
August 2025 | ||
7 Aug 2025 | No major environmental deficiency was | N/A |
14 Aug 2025 | No major environmental deficiency was | N/A |
28 Aug 2025 | No major environmental deficiency was | N/A |
September 2025 | ||
10 Sept 2025 | No major environmental deficiency was | N/A |
25Sept 2025 | No major environmental deficiency was | N/A |
October 2025 | ||
9 Oct 2025 | No major environmental deficiency was | N/A |
23 Oct 2025 | No major environmental deficiency was | N/A |
November 2025 | ||
3 Nov 2025 | No major environmental deficiency was | N/A |
20 Nov 2025 | No major environmental deficiency was | N/A |
25 Nov 2025 | No major environmental deficiency was | N/A |
December 2025 | ||
11 Dec 2025 | No major environmental deficiency was | N/A |
22 Dec 2025 | No major environmental deficiency was | N/A |
January 2026 | ||
9 Jan 2026 | No major environmental deficiency was | N/A |
21 Jan 2026 | No major environmental deficiency was | N/A |
February 2026 | ||
3 Feb 2026 | No major environmental deficiency was | N/A |
Date | Environmental Observations | Follow-up Status |
16 Feb 2026 | No major environmental deficiency was | N/A |
March 2026 | ||
5 Mar 2026 | No major environmental deficiency was | N/A |
24 Mar 2026 | No major environmental deficiency was | N/A |
April 2026 | ||
13 Apr 2026 | No major environmental deficiency was | N/A |
29 Apr 2026 | No major environmental deficiency was | N/A |
Appendix E
Waste Flow Table
Name of Department: WSD Contract No.: 13/WSD/17
Monthly Summary Waste Flow Table for 2025 (year)
Month | Actual Quantities of Inert C&D Materials Generated Monthly | Actual Quantities of C&D Wastes Generated Monthly | |||||||||
Total Quantity | Hard Rock and | Reused in the | Reused in other | Disposed as | Imported Fill | Metals | Paper/ cardboard | Plastics | Chemical | Others, e.g. | |
(in '000kg) | (in '000kg) | (in '000kg) | (in '000kg) | (in '000kg) | (in '000kg) | (in '000 kg) | (in '000kg) | (in '000kg) | (in '000kg) | (in '000kg) | |
Jan | 0.000 | 0.000 | 0.000 | 0.000 | 0.000 | 0.000 | 0.000 | 0.000 | 0.000 | 0.000 | 38.740 |
Feb | 0.000 | 0.000 | 0.000 | 0.000 | 0.000 | 0.000 | 0.000 | 0.000 | 0.000 | 0.000 | 18.330 |
Mar | 30.520 | 0.000 | 0.000 | 0.000 | 30.520 | 0.000 | 0.000 | 0.000 | 0.000 | 0.000 | 29.050 |
Apr | 21.290 | 0.000 | 0.000 | 0.000 | 21.290 | 0.000 | 0.000 | 0.000 | 0.000 | 0.000 | 73.450 |
May | 0.000 | 0.000 | 0.000 | 0.000 | 0.000 | 0.000 | 0.000 | 0.000 | 0.000 | 0.000 | 35.720 |
Jun | 0.000 | 0.000 | 0.000 | 0.000 | 0.000 | 0.000 | 0.000 | 0.000 | 0.000 | 0.000 | 28.950 |
Sub-total | 51.810 | 0.000 | 0.000 | 0.000 | 51.810 | 0.000 | 0.000 | 0.000 | 0.000 | 0.000 | 224.240 |
Jul | 0.000 | 0.000 | 0.000 | 0.000 | 0.000 | 0.000 | 0.000 | 0.000 | 0.000 | 1.434 | 13.330 |
Aug | 0.000 | 0.000 | 0.000 | 0.000 | 0.000 | 0.000 | 0.000 | 0.000 | 0.000 | 0.000 | 27.340 |
Sep | 0.000 | 0.000 | 0.000 | 0.000 | 0.000 | 0.000 | 0.000 | 0.000 | 0.000 | 0.000 | 0.000 |
Oct | 0.000 | 0.000 | 0.000 | 0.000 | 0.000 | 0.000 | 0.000 | 0.000 | 0.000 | 0.000 | 13.710 |
Nov | 0.000 | 0.000 | 0.000 | 0.000 | 0.000 | 0.000 | 0.000 | 0.000 | 0.000 | 0.000 | 14.270 |
Dec | 0.000 | 0.000 | 0.000 | 0.000 | 0.000 | 0.000 | 0.000 | 0.000 | 0.000 | 0.000 | 70.660 |
Total | 51.810 | 0.000 | 0.000 | 0.000 | 51.810 | 0.000 | 0.000 | 0.000 | 0.000 | 1.434 | 363.550 |
Notes: (1) The performance targets are given in Section 1.69 of Specification B (2) The waste flow table shall also include C&D materials that are specified in the Contract to be imported for use at the Site.
(3) Plastics refer to plastic bottles/containers, plastic sheets/ foam from packaging material
Name of Department: WSD Contract No.: 13/WSD/17
Monthly Summary Waste Flow Table for 2026 (year)
Month | Actual Quantities of Inert C&D Materials Generated Monthly | Actual Quantities of C&D Wastes Generated Monthly | |||||||||
Total Quantity | Hard Rock and | Reused in the | Reused in other | Disposed as | Imported Fill | Metals | Paper/ cardboard | Plastics | Chemical | Others, e.g. | |
(in '000kg) | (in '000kg) | (in '000kg) | (in '000kg) | (in '000kg) | (in '000kg) | (in '000 kg) | (in '000kg) | (in '000kg) | (in '000kg) | (in '000kg) | |
Jan | 0.000 | 0.000 | 0.000 | 0.000 | 0.000 | 0.000 | 0.000 | 0.000 | 0.000 | 0.000 | 22.300 |
Feb | 0.000 | 0.000 | 0.000 | 0.000 | 0.000 | 0.000 | 0.000 | 0.000 | 0.000 | 0.000 | 18.070 |
Mar | 0.000 | 0.000 | 0.000 | 0.000 | 0.000 | 0.000 | 0.000 | 0.000 | 0.000 | 0.000 | 66.120 |
Apr | 0.000 | 0.000 | 0.000 | 0.000 | 0.000 | 0.000 | 0.000 | 0.000 | 0.000 | 0.000 | 88.530 |
May | |||||||||||
Jun | |||||||||||
Sub-total | 0.000 | 0.000 | 0.000 | 0.000 | 0.000 | 0.000 | 0.000 | 0.000 | 0.000 | 0.000 | 195.020 |
Jul | |||||||||||
Aug | |||||||||||
Sep | |||||||||||
Oct | |||||||||||
Nov | |||||||||||
Dec | |||||||||||
Total | 0.000 | 0.000 | 0.000 | 0.000 | 0.000 | 0.000 | 0.000 | 0.000 | 0.000 | 0.000 | 195.020 |
Notes: (1) The performance targets are given in Section 1.69 of Specification B (2) The waste flow table shall also include C&D materials that are specified in the Contract to be imported for use at the Site.
(3) Plastics refer to plastic bottles/containers, plastic sheets/ foam from packaging material
Appendix F
Summary of Exceedances
Table G1 Cumulative Statistics on Exceedances
Environmental | Parameter | No. of non-Project | Total No. of non- | No. of Project | Total No. of Project | Total No. recorded | ||
AL | LL | AL | LL | |||||
Noise | L | N/A | N/A | N/A | N/A | N/A | N/A | N/A |
Water Quality | DO | 0 | 0 | 0 | 0 | 0 | 0 | 0 |
Turbidity | 0 | 0 | 0 | 0 | 0 | 0 | 0 | |
SS | 3 | 11 | 14 | 0 | 0 | 0 | 3237 | |
pH | 0 | 0 | 0 | 0 | 0 | 0 | 0 | |
Landfill Gas | O | 0 | 0 | 0 | 0 | 0 | 0 | 0 |
CH | 0 | 0 | 0 | 0 | 0 | 0 | 0 | |
CO | 0 | 0 | 0 | 0 | 0 | 0 | 0 |
Appendix G
Complaint Log
Statistical Summary of Environmental Complaints
Reporting Period | Environmental Complaint Statistics | ||
Frequency | Cumulative | Complaint Nature | |
1 May 2025 | 0 | 3 | Air Quality, Noise and Water |
Statistical Summary of Environmental Summons
Reporting Period | Environmental Summons Statistics | ||
Frequency | Cumulative | Details | |
1 May 2025 | 0 | 0 | N/A |
Statistical Summary of Environmental Prosecution
Reporting Period | Environmental Prosecution Statistics | ||
Frequency | Cumulative | Details | |
1 May 2025 | 0 | 0 | N/A |
Appendix H
Event / Action Plan
Table I1 Event and Action Plan for Construction Noise Monitoring
Event | Action | |||
ET | IEC | ER | Contractor | |
Action Level | 1. Carry out investigation to identify the | 1. Review the analyzed results | 1. Confirm receipt of Notification of | 1. Submit noise mitigation |
Limit Level | 1. Carry out investigation to identify the | 1. Review the analyzed results | 1. Confirm receipt of Notification of | 1. Take immediate action to |
Table I2 Event and Action Plan for Water Quality Monitoring
Event | Action | |||
ET | IEC | Contract(s) | ER | |
Action Level | 1. Repeat in situ measurement on the | 1. Check monitoring data | 1. Confirm receipt of notification of | 1. Confirm receipt of notification of |
Action Level | 1. Repeat in situ measurement on the | 1. Check monitoring data | 1. Confirm receipt of notification of | 1. Confirm receipt of notification of |
Limit Level being | 4. Repeat in situ measurement on the | 1. Check monitoring data | 1. Confirm receipt of notification of | 1. Confirm receipt of notification of |
Event | Action | |||
ET | IEC | Contract(s) | ER | |
Limit Level being | 1. Repeat in situ measurement on the | 1. Check monitoring data | 1. Confirm receipt of notification of | 1. Confirm receipt of notification of |