EXECUTIVE SUMMARY
Introduction
A1. The
Project, Design, Build and Operate First Stage of Tseung Kwan O Desalination
Plant (TKODP), is a Designated Project under the Environmental Impact
Assessment Ordinance (Cap. 499) (EIAO) and is currently governed by a Further
Environmental Permit (EP No. FEP - 01/503/2015/A) for the construction and
operation of the Project.
A2. In
accordance with the approved Environmental Monitoring and Audit (EM&A)
Manual for the Project, baseline environmental monitoring for marine water
quality should be carried out by Environmental Team (ET), Acuity Sustainability
Consulting Limited (ASCL) prior to the commencement of marine construction
works. Pursuant to FEP Condition 3.4, Baseline Monitoring Report shall be
submitted to the Director within 2 weeks before the commencement of
construction of the Project for record.
A3. This
is the Baseline Water Quality Monitoring Report, prepared by ASCL, for the
Project summarizing the baseline water quality monitoring results at and around
Tseung Kwan O Area 137 (TKO 137) during the period from 12 May 2020 to 6 June
2020.
1.
BASIC PROJECT INFORMATION
1.1.
BACKGROUND
1.1.1.
The
Jardine Engineering Corporation, Limited, China State Construction Engineering
(Hong Kong) Limited and Acciona Agua, S.A. Trading As AJC Joint Venture (AJCJV)
is contracted to carry out the Design, Build and Operate First Stage of Tseung
Kwan O Desalination Plant (DPTKO) under Contract No. 13/WSD/17 (the Project).
1.1.2.
Acuity
Sustainability Consulting Limited (ASCL) is commissioned by AJCJV to undertake
the Environmental Team (ET) services as required and/or implied, both
explicitly and implicitly, in the Environmental Permit (EP), Environmental
Impact Assessment Report (EIA Report) (Register No. AEIAR-192/2015) and
Environmental Monitoring and Audit Manual (EM&A Manual) for the Project;
and to carry out the Environmental Monitoring and Audit (EM&A) programme in
fulfillment of the EIA Report��s EM&A requirements and Contract No.
13/WSD/17 Specification requirements.
1.1.3.
Pursuant
to the Environmental Impact Assessment Ordinance (EIAO), the Director of
Environmental Protection granted the Environmental Permit (No. EP-01/503/2015)
and Variation of Environmental Permit (No. EP-01/503/2015/A) to Water Supplies
Department (WSD); and granted the Further Environmental Permit (No. FEP-01/503/2015/A)
to AJCJV for the Project.
1.1.4.
According
to the approved EM&A Manual, baseline environmental monitoring for marine
water quality should be conducted to review the baseline conditions prior to
the commencement of marine construction works for and establish Action and
Limit Levels.
1.1.5.
Pursuant
to Condition 3.4 of the FEP, the AJCJV shall submit a Baseline Monitoring
Report at least 2 weeks before the commencement of construction of the Project.
1.1.6.
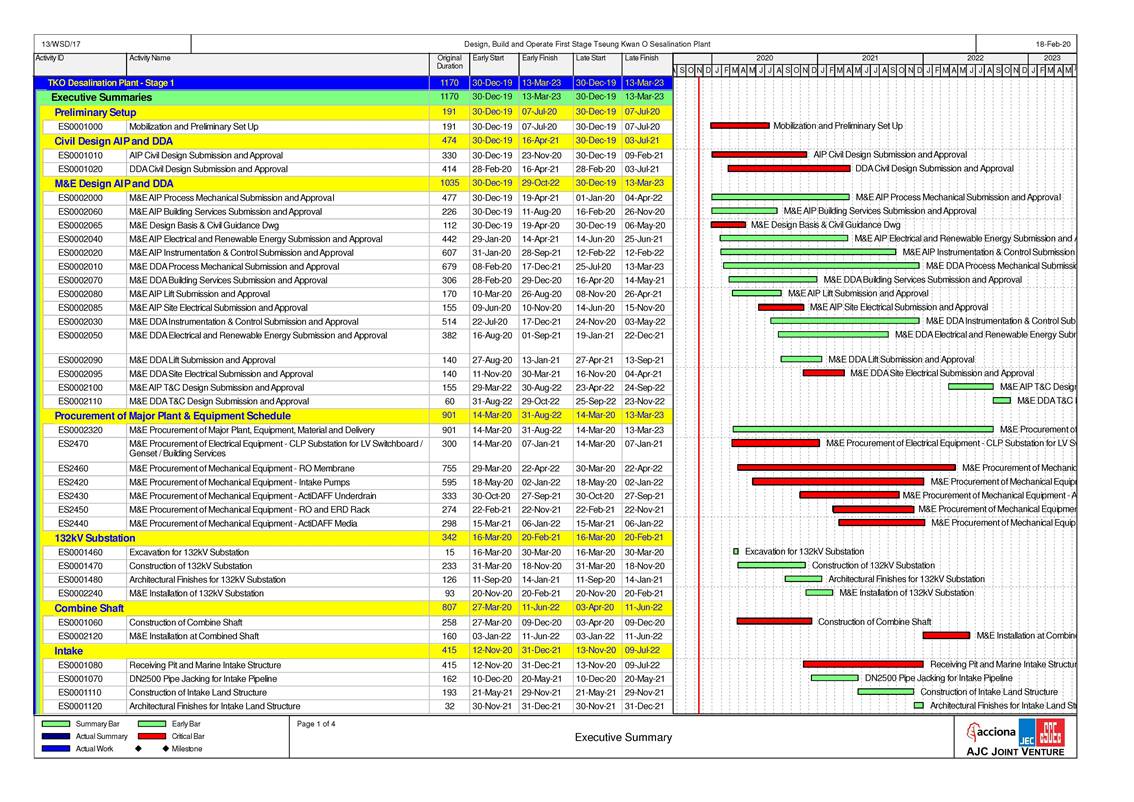
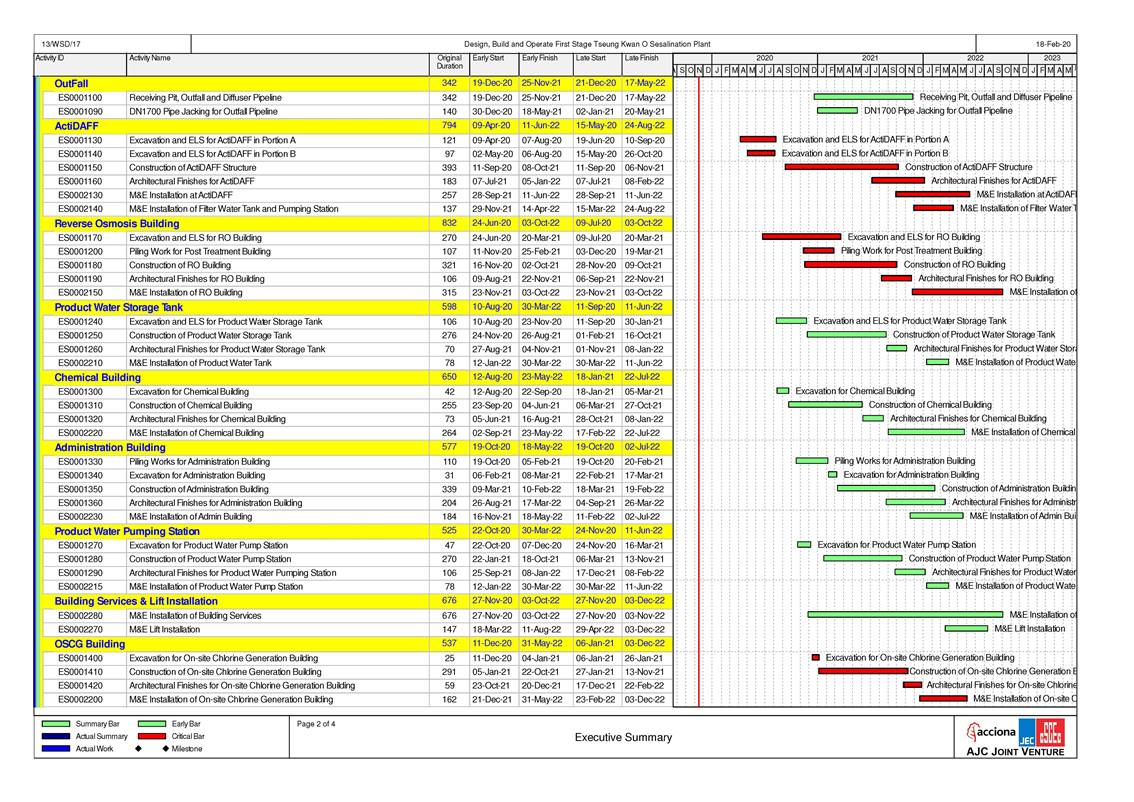
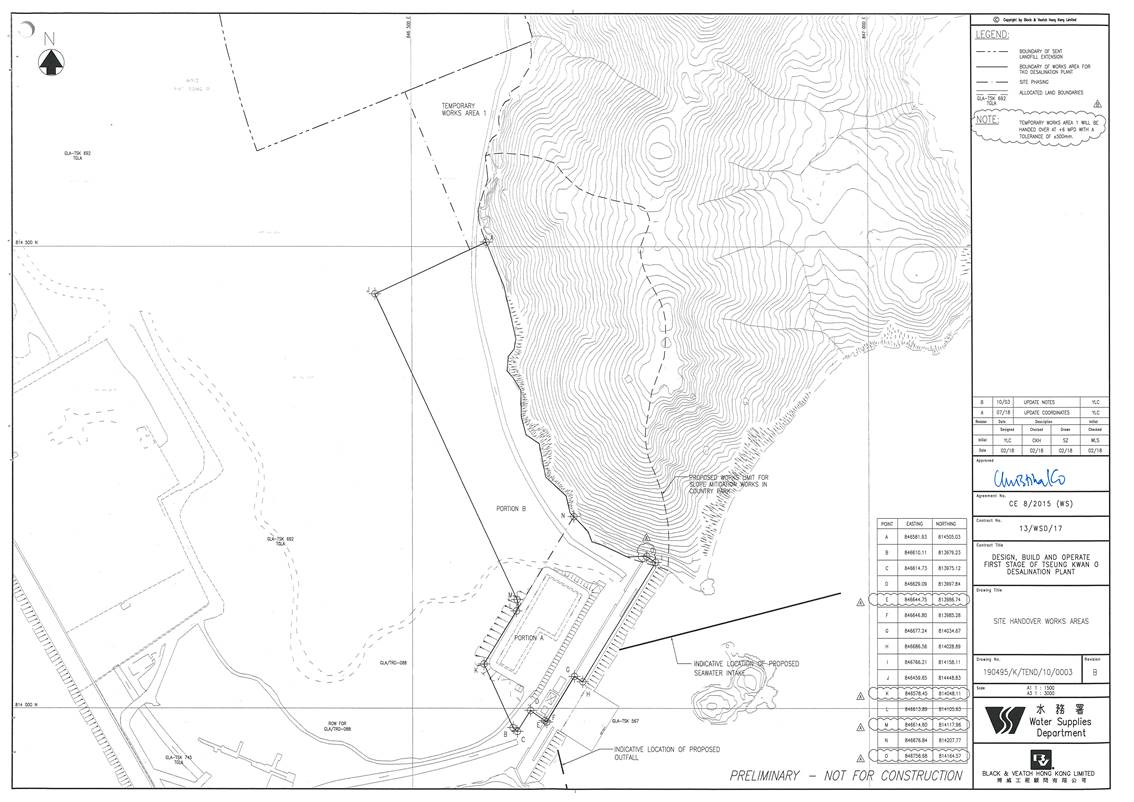
The master
programme and overall view of TKODP alignment is shown in Appendix A and Appendix B respectively.
1.2.
PURPOSE OF THE BASELINE
WATER QUALITY MONITORING REPORT
1.2.1.
The purposes of
this Baseline Water Quality Monitoring Report are to:
-
Summarise
and present the findings of baseline marine water quality including monitoring
locations, equipment, period, methodology, results and observations: and
-
Establish
the Action and Limit (A/L) levels in accordance with the EM&A Manual for
the subsequent impact monitoring during marine construction stage.
Water Quality
1.2.2.
Baseline
water quality monitoring was carried at thirteen monitoring stations, which are
located at and around TKO 137 area. This Baseline Water Quality Monitoring
Report contains baseline findings of these thirteen monitoring stations.
1.3.
REPORT
STRUCTURE
1.3.1.
This Baseline
Water Quality Monitoring Report comprises the following sections:
-
Section 1 introduces
the background of the Project and purpose of this Report;
-
Section
2 presents the baseline water quality monitoring methodologies, requirements,
results, influencing factors including major site activities and weather
conditions, as well as determination of the action and limit levels of marine
water quality; and
-
Section 3
presents concludes the findings of baseline water quality monitoring.
2.
WATER QUALITY
2.1.
MONITORING REQUIREMENTS
2.1.1.
To
ensure no adverse water quality impact, water quality monitoring is recommended
to be carried out at the nearby
water sensitive receivers (WSRs) during construction phase including dredging
activities and marine construction works.
2.1.2.
In
accordance with the EM&A Manual, baseline water quality monitoring should
be conducted 3 days per week for 4 weeks to obtain background water quality
levels at thirteen monitoring stations. The interval between two sets of
monitoring shall not be less than 36 hours.
2.2.
WATER QUALITY PARAMETERS,
TIME AND FREQUENCY
2.2.1.
Baseline
Marine Water Quality Monitoring was conducted 3 days per week for 4 weeks
between 12 May 2020 and 6 June 2020.
2.2.2.
Dissolved
oxygen (DO), turbidity, suspended solids (SS) levels, salinity, pH and temperature
were monitored at all monitoring stations during mid-flood and mid-ebb tides at
three water depths for Baseline Marine Water Quality Monitoring.
2.2.3. Table 2.1 summarizes the monitoring parameters,
frequency and duration of the baseline water quality monitoring. The monitoring
location/position, time, water depth, sampling depth, tidal stages, weather
conditions, sea conditions, current direction, velocity and any special
phenomena or work underway nearby were also recorded. The monitoring schedule is
provided in Appendix C.
Table 2.1 Water
Quality Monitoring Parameters, Frequency and Duration
|
Parameter, unit
|
Frequency
|
No. of Depths
|
|
-
Water Depth(m)
-
Temperature(oC)
-
Salinity(ppt)
-
pH (pH unit)
-
Dissolved Oxygen (DO)(mg/L and % of saturation)
-
Turbidity(NTU)
-
Suspended Solids (SS), mg/L
-
Iron
-
Current Direction
-
Current Velocity
(m/s)
|
Baseline water quality monitoring:
3
days per week, at mid-flood and mid-ebb tides, for a period of 4 weeks
|
3
water depths: 1m below sea surface, mid-depth and 1m above sea bed.
If
the water depth is less than 3m, mid-depth sampling only.
If
water depth less than 6m, mid- depth may be omitted.
|
2.3.
WATER QUALITY MONITORING LOCATIONS
2.3.1.
Monitoring Equipment
For
baseline water quality monitoring, the following equipment will be used:
Dissolved
Oxygen and Temperature Measuring Equipment - The instrument will be a
portable, weatherproof dissolved oxygen measuring instrument complete with
cable, sensor, comprehensive operation manuals, and will be operable from a DC
power source. It will be capable of measuring: dissolved oxygen levels in the
range of 0 - 20 mg/L and 0 - 200% saturation; and a temperature of 0 - 45
degrees Celsius. It shall have a membrane electrode with automatic temperature
compensation complete with a cable of not less than 35 m in length. Sufficient
stocks of spare electrodes and cables shall be available for replacement where
necessary (e.g. YSI model 59 DO meter, YSI 5739 probe, YSI 5795A submersible
stirrer with reel and cable or an approved similar instrument).
Turbidity Measurement Equipment - The instrument will be a
portable, weatherproof turbidity- measuring unit complete with cable, sensor
and comprehensive operation manuals. The equipment will be operated from a DC
power source, it will have a photoelectric sensor capable of measuring
turbidity between 0 - 1000 NTU and will be complete with a cable with at least
35 m in length (for example Hach 2100P or an approved similar instrument).
Salinity Measurement Instrument - A portable salinometer
capable of measuring salinity in the range of 0 - 40 ppt will be provided for
measuring salinity of the water at each monitoring location.
Water Depth Gauge - A portable, battery-operated echo
sounder (for example Seafarer 700 or a similar approved instrument) will be
used for the determination of water depth at each designated monitoring
station. This unit will preferably be affixed to the bottom of the work boat if
the same vessel is to be used throughout the monitoring programme. The echo
sounder should be suitably calibrated. The ET shall seek approval for their
proposed equipment with the client prior to deployment.
Current Velocity and Direction - No specific equipment is
recommended for measuring the current velocity and direction. The environmental
contractor shall seek approval of their proposed equipment with the client
prior to deployment.
Positioning Device - A Global Positioning System (GPS)
shall be used during monitoring to allow accurate recording of the position of
the monitoring vessel before taking measurements. The Differential GPS, or
equivalent instrument, should be suitably calibrated at appropriate checkpoint
(e.g. Quarry Bay Survey Nail) to verify that the monitoring station is at the
correct position before the water quality monitoring commence.
Water Sampling Equipment - A water sampler, consisting of
a PVC or glass cylinder of not less than two litres, which can be effectively
sealed with cups at both ends, will be used (e.g. Kahlsico Water Sampler
13SWB203 or an approved similar instrument). The water sampler will have a positive
latching system to keep it open and prevent premature closure until released by
a messenger when the sampler is at the selected water depth.
Total Residual Chlorine for Discharge of Sterilization Water -
Total residual chlorine (TRC) shall be measured in-situ using a handheld
colorimeter with its testing toolkits.
2.3.2.
Sampling /
Testing Protocols
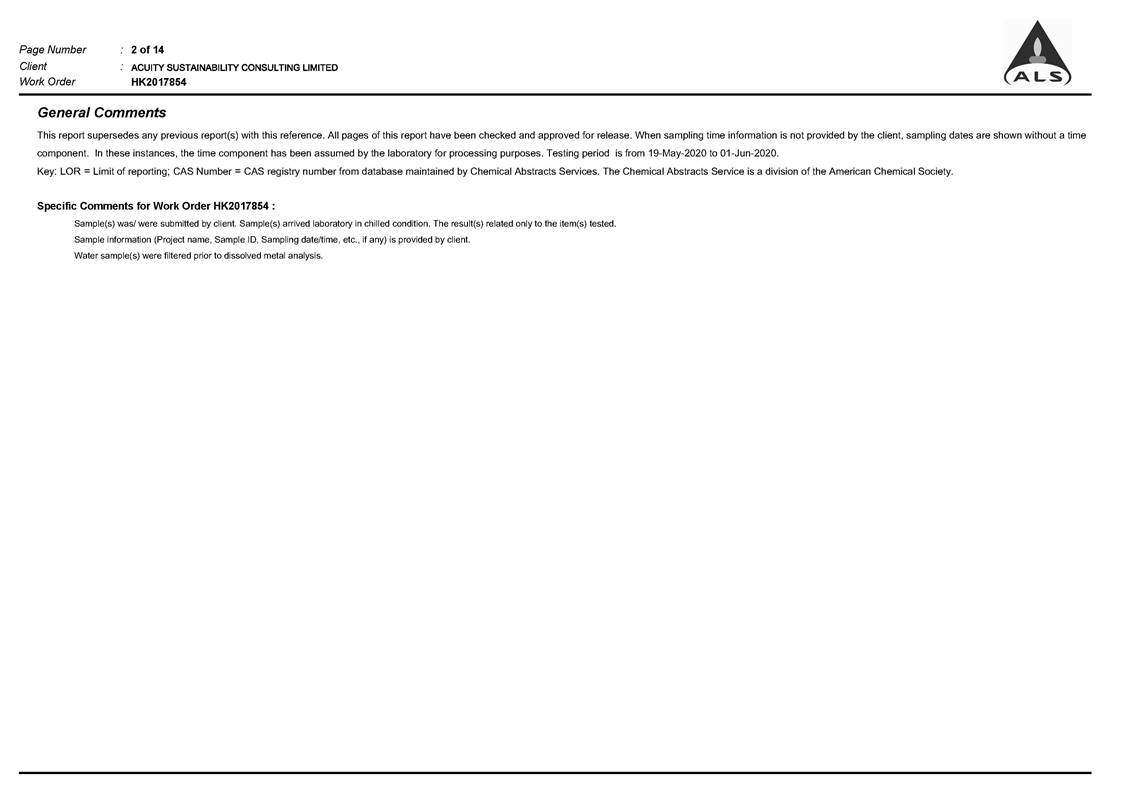
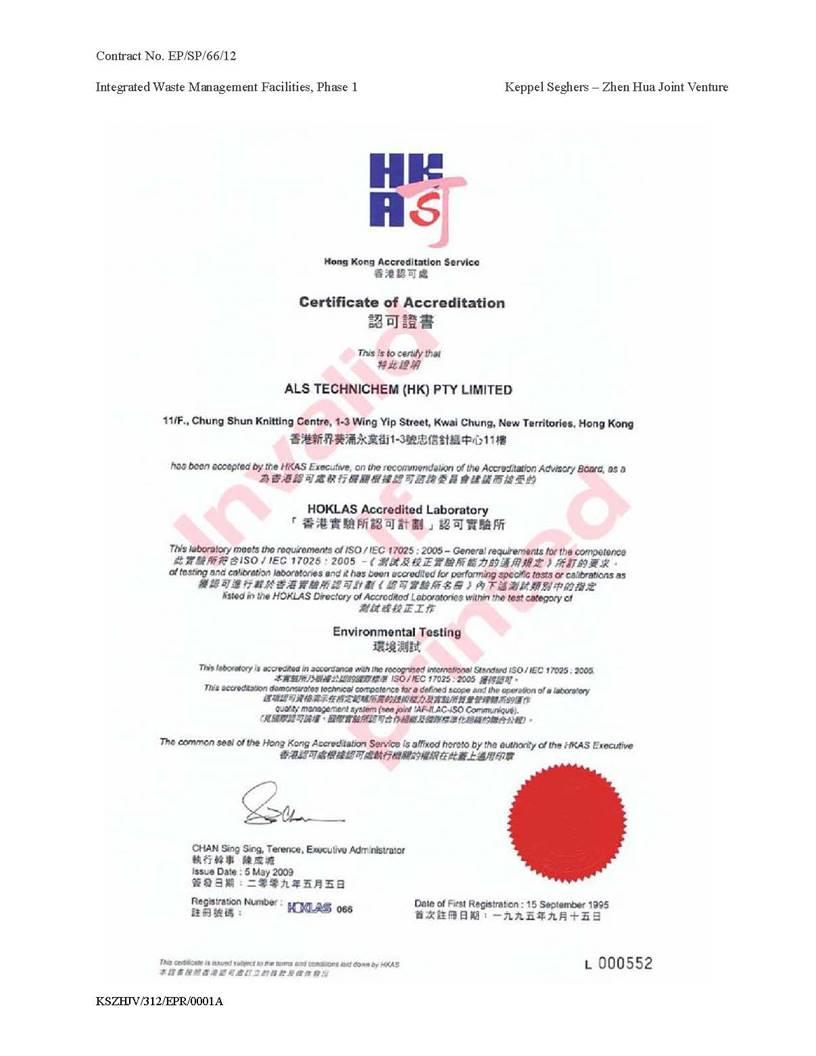
All in situ monitoring instruments will be checked, calibrated
and certified by Australian Laboratory Services (ALS) accredited under HOKLAS
or any other international accreditation scheme before use, and subsequently
re-calibrated at monthly intervals throughout the stages of the water quality
monitoring. Responses of sensors and electrodes will be checked with certified
standard solutions before each use. The HOKLAS laboratory certificate was
presented in Appendix E.
On-site calibration of field equipment shall follow the ��Guide to
On-Site Test Methods for the Analysis of Waters��, BS 1427: 2009. Sufficient
stocks of spare parts shall be maintained for replacements when necessary.
Backup monitoring equipment shall also be made available so that monitoring can
proceed uninterrupted even when equipment is under maintenance, calibration
etc.
2.3.3.
Laboratory
Measurement and Analysis
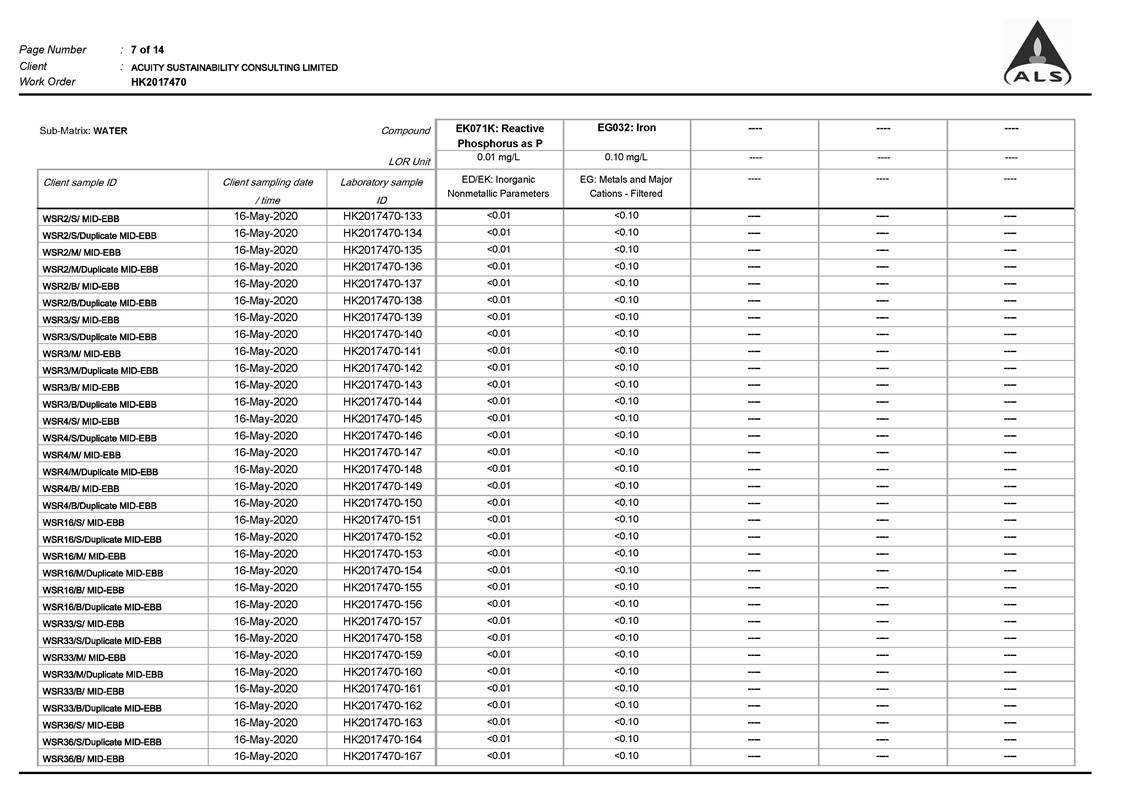
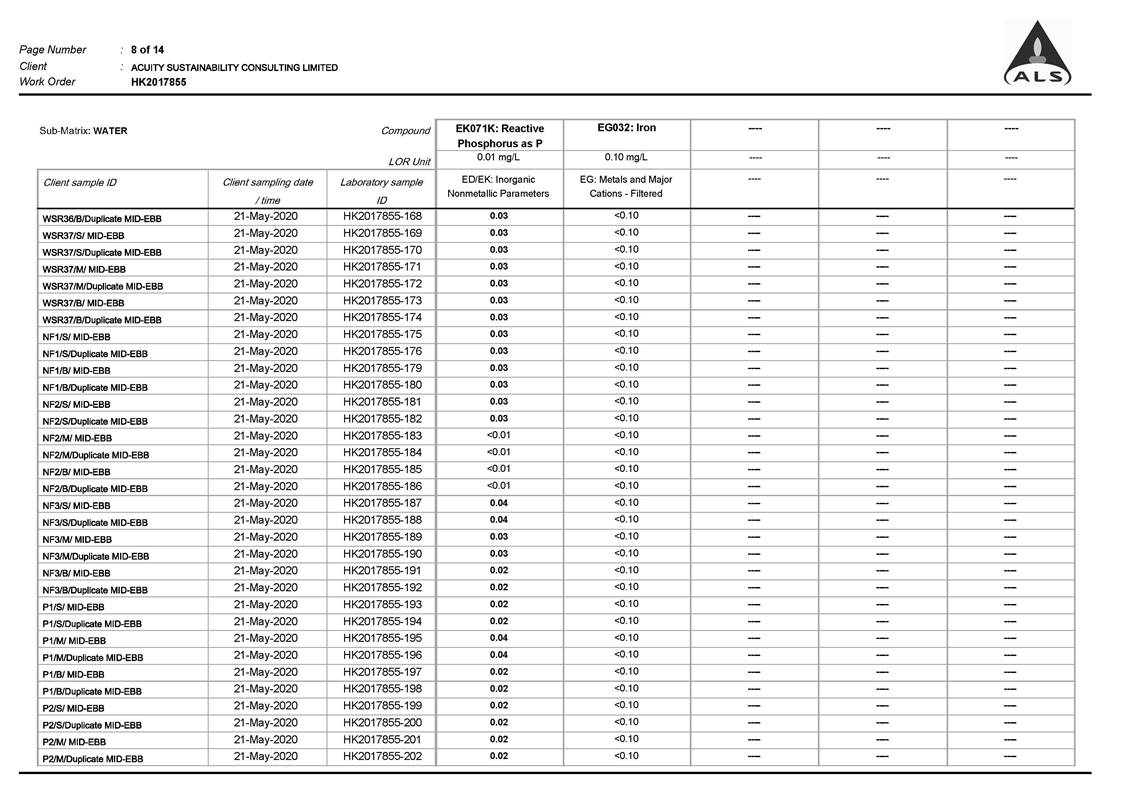
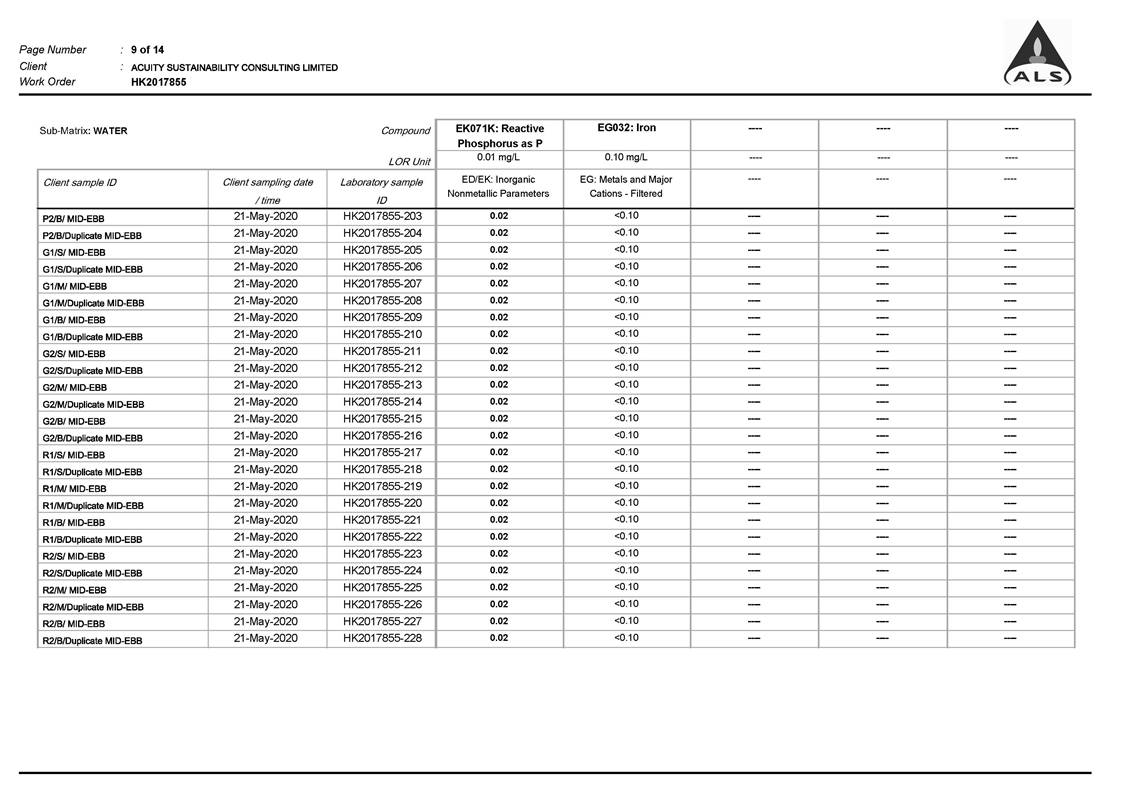
All
laboratory work shall be carried out in ALS (HOKLAS accredited laboratory).
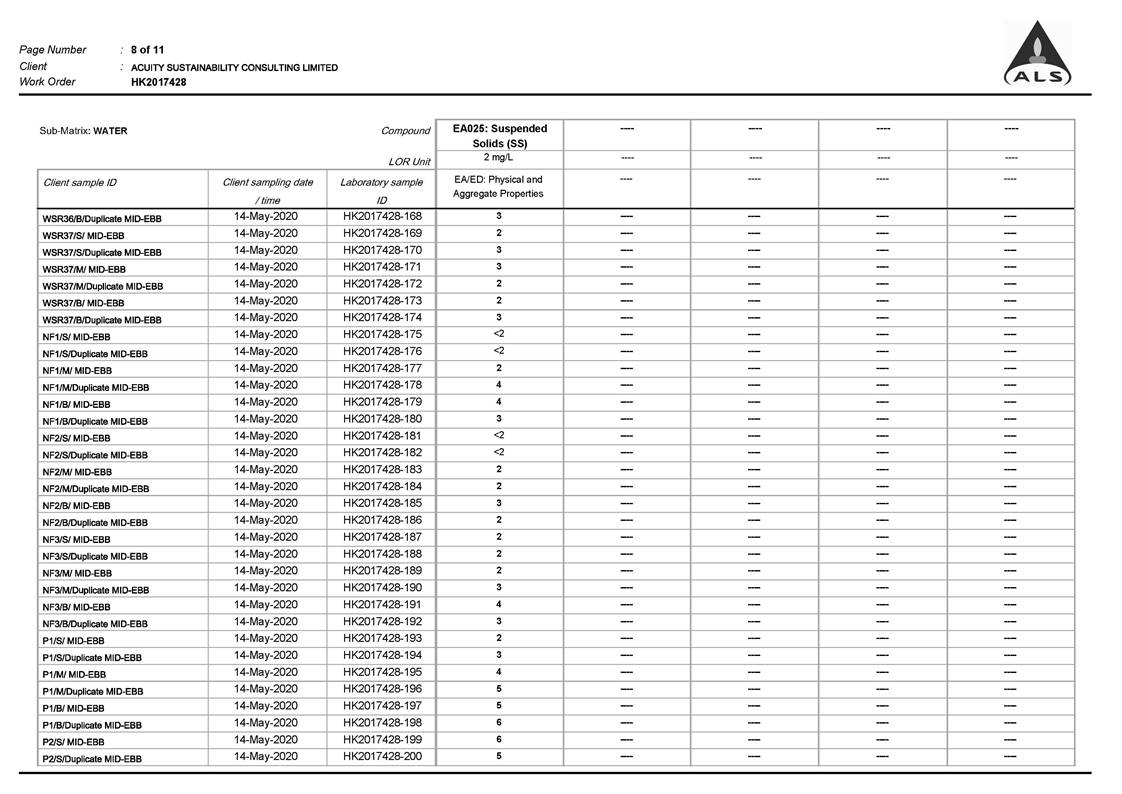
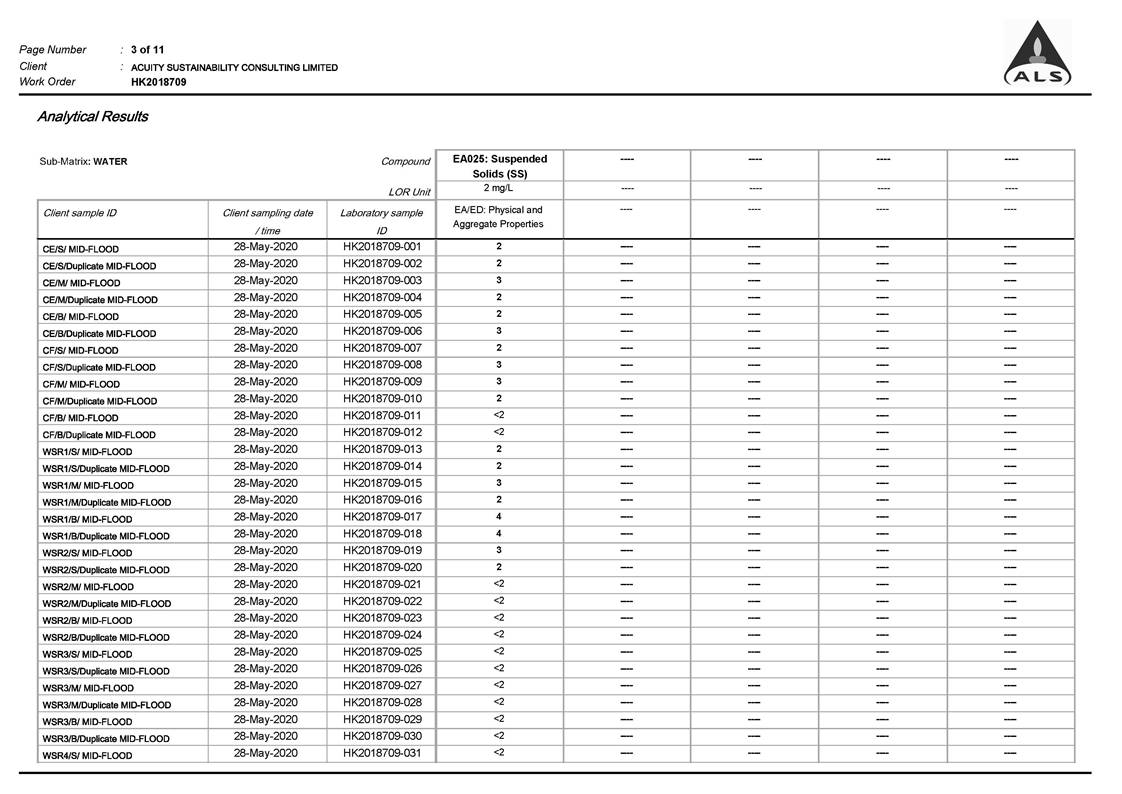
Sufficient volume of each water sample shall be collected at the monitoring
stations for carrying out the laboratory analyses. Using chain of custody
forms, collected water samples will be transferred to an HOKLAS accredited
laboratory for immediate processing. The determination work shall start within
the next working day after collection of the water samples. The laboratory
measurements shall be provided to the client within 5 working days of the
sampling event. Analytical methodology and sample preservation of other
parameters will be based on the latest edition of Standard Methods for the
Examination of Waste and Wastewater published by APHA, AWWA and WPCF and
methods by USEPA, or suitable method in accordance with requirements of HOKLAS
or another internationally accredited scheme. The submitted information should
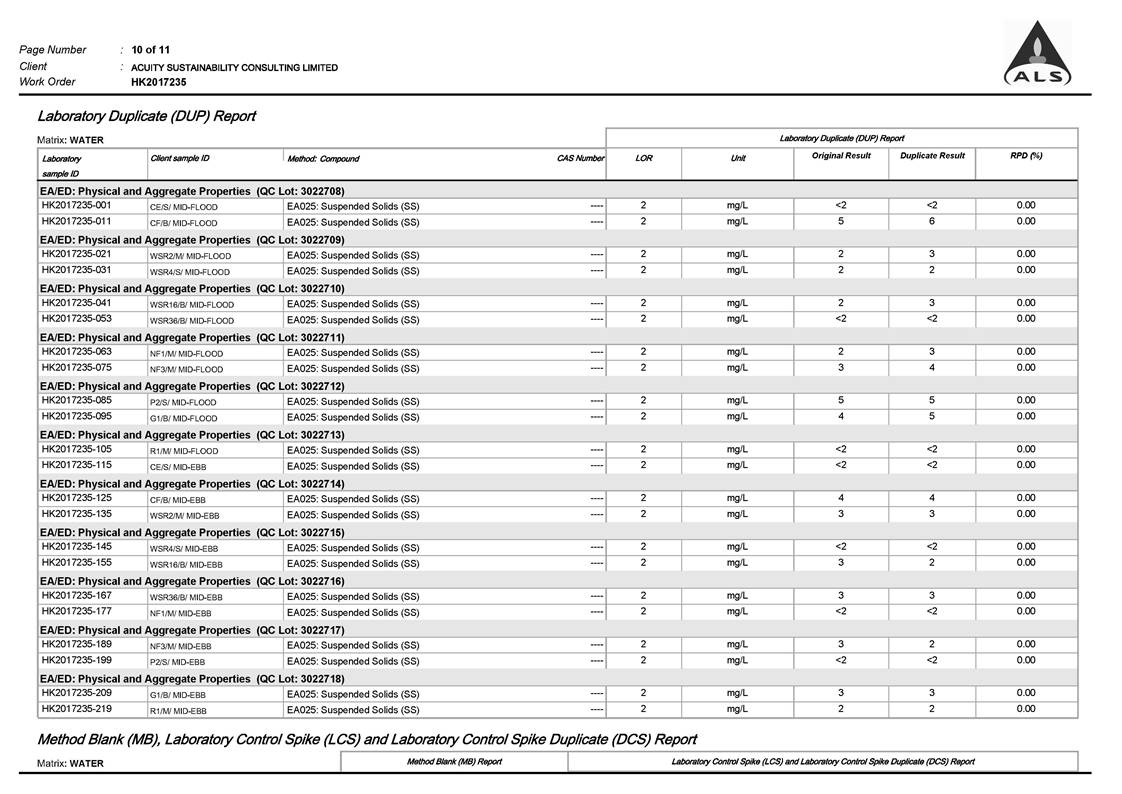
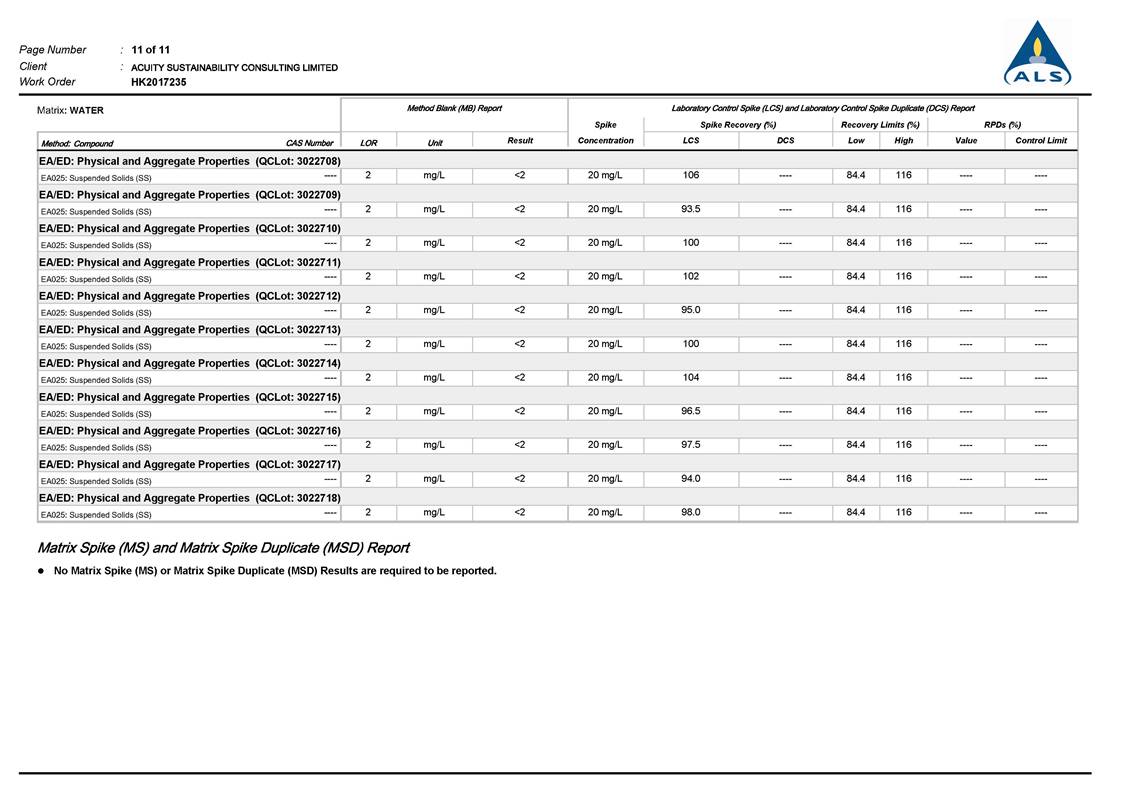
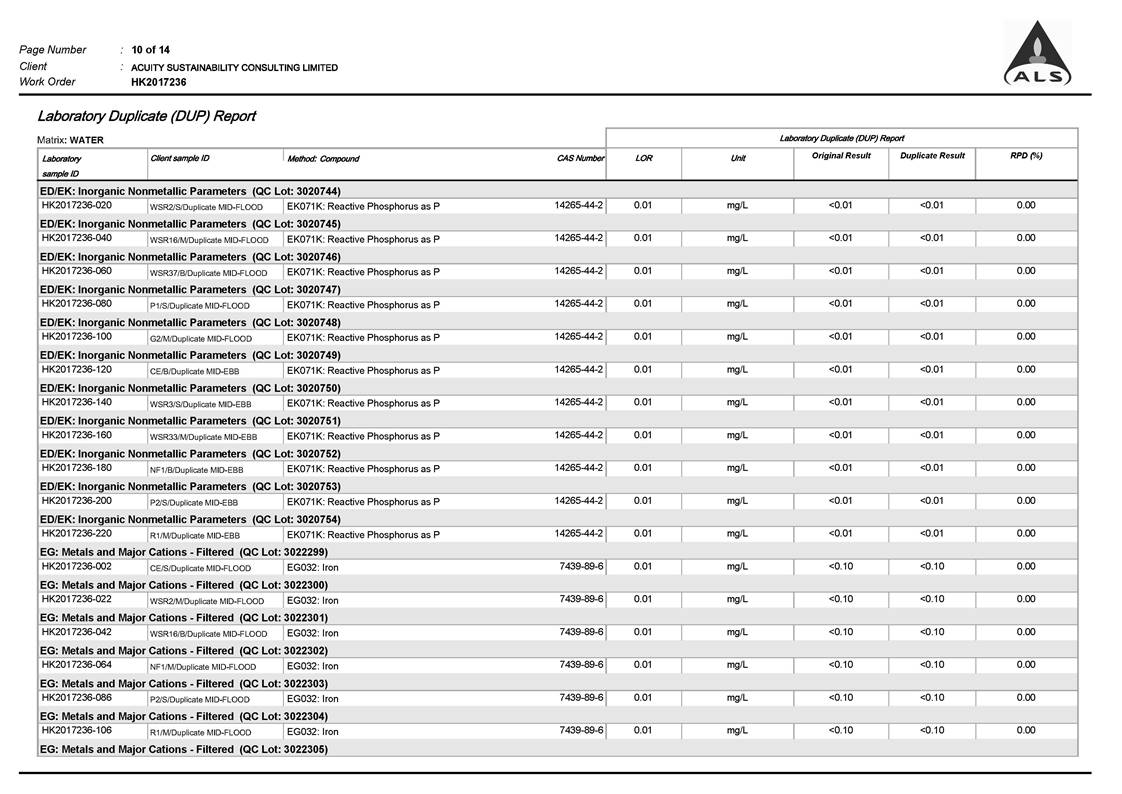
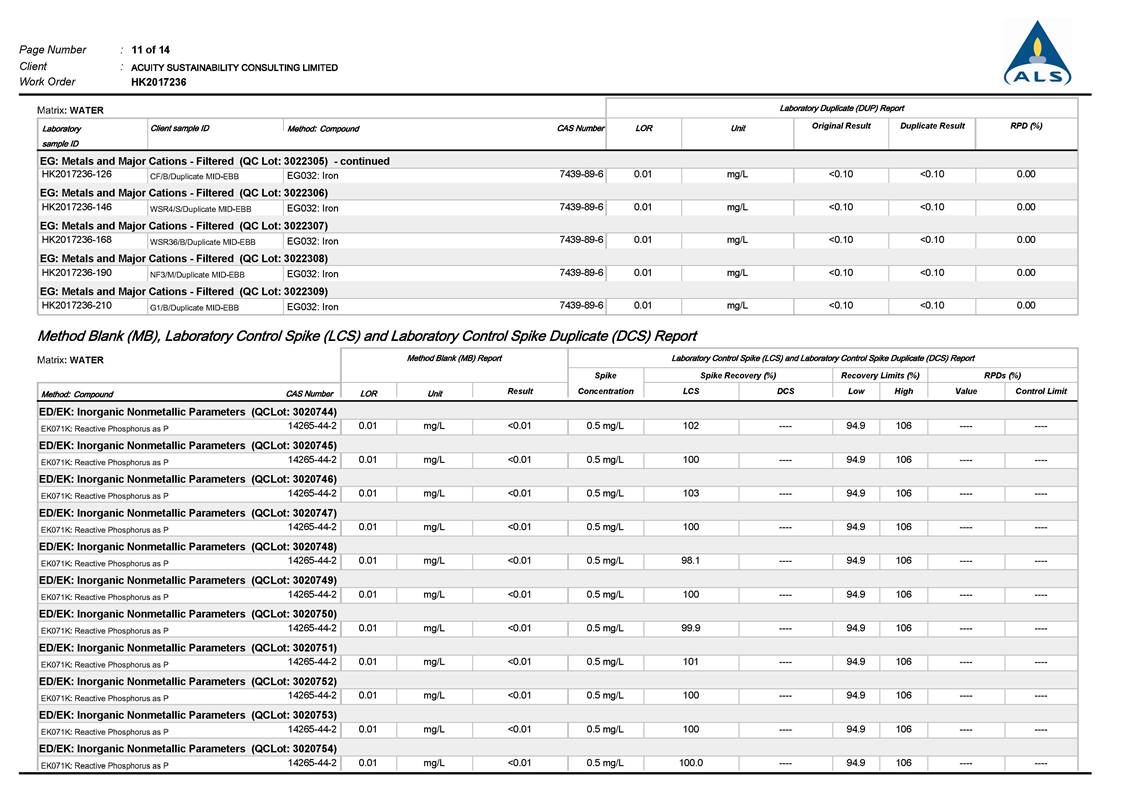
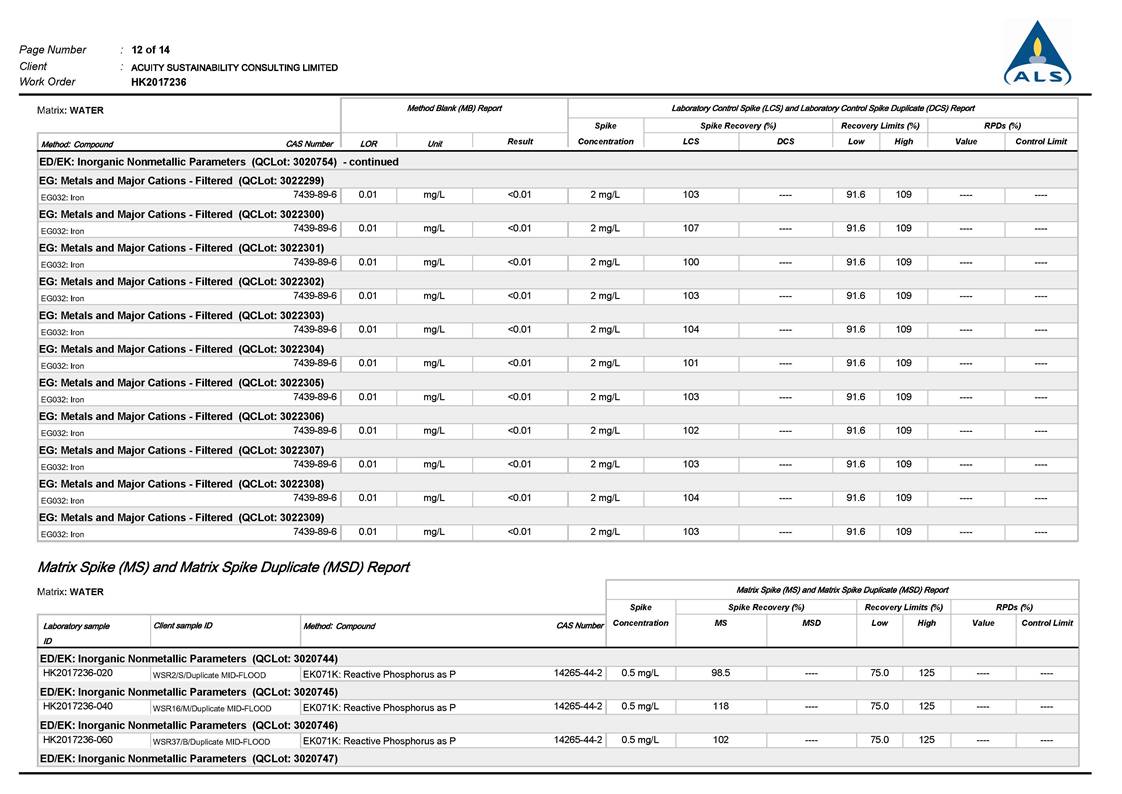
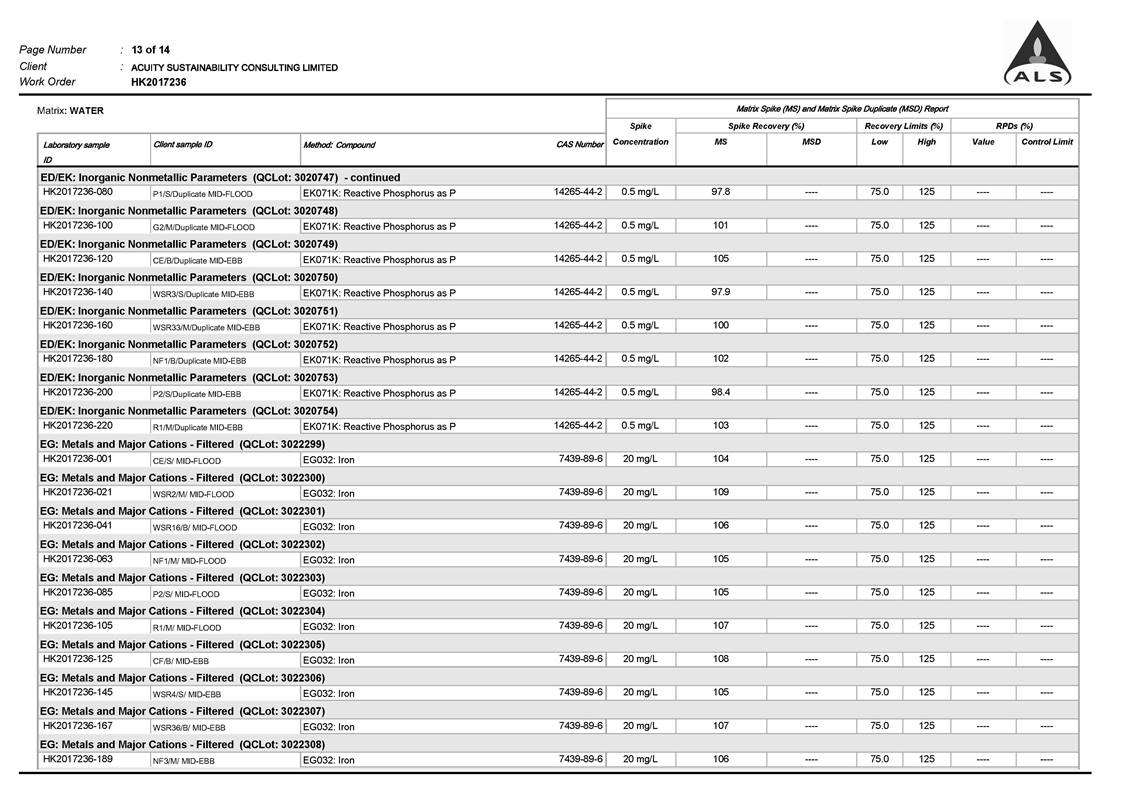
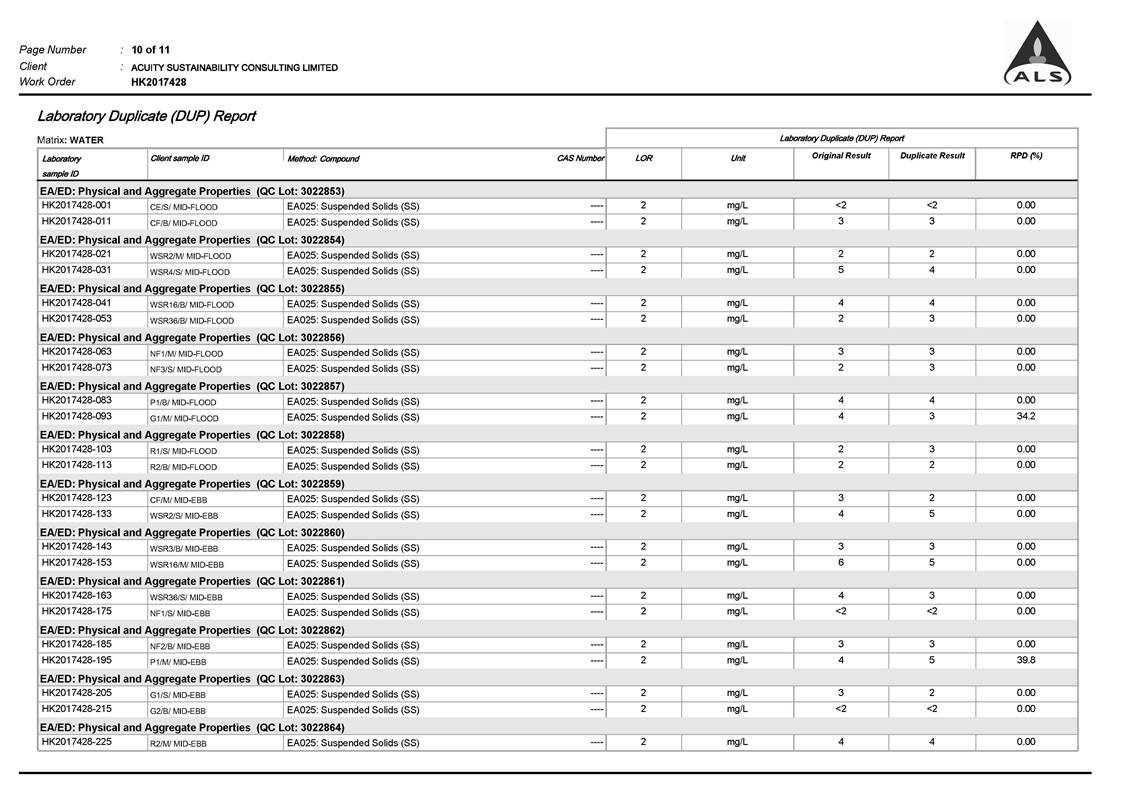
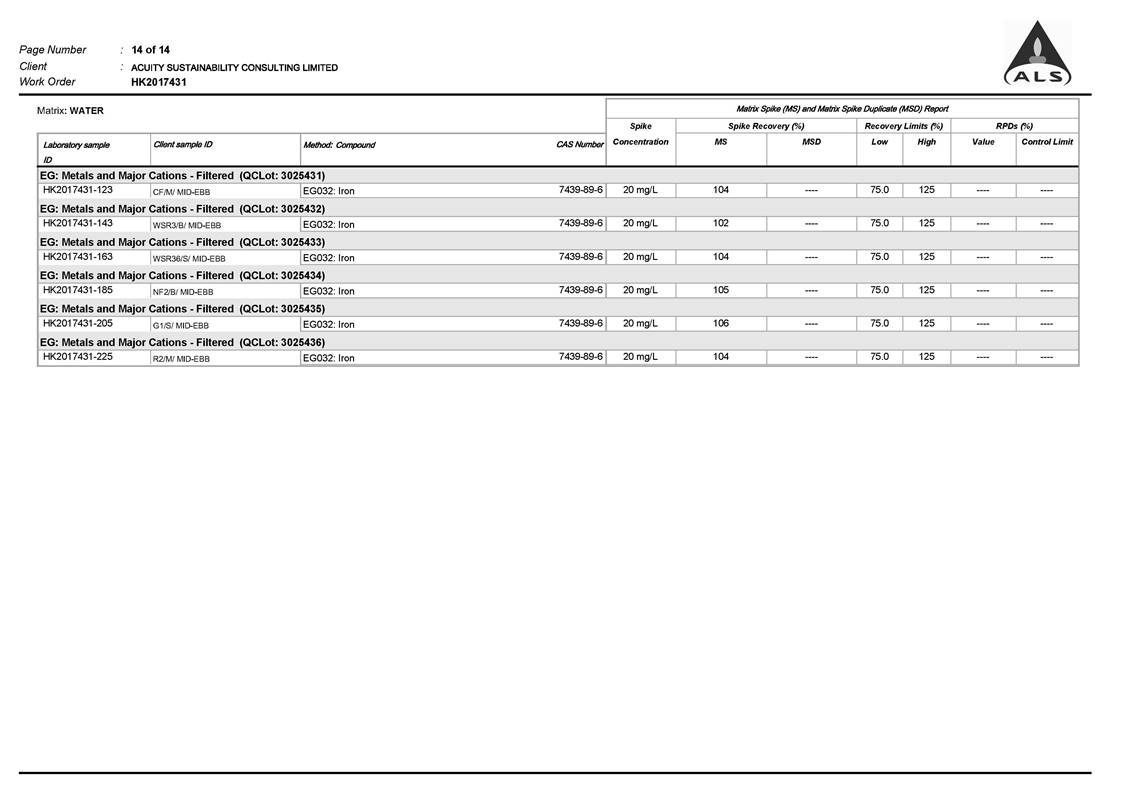
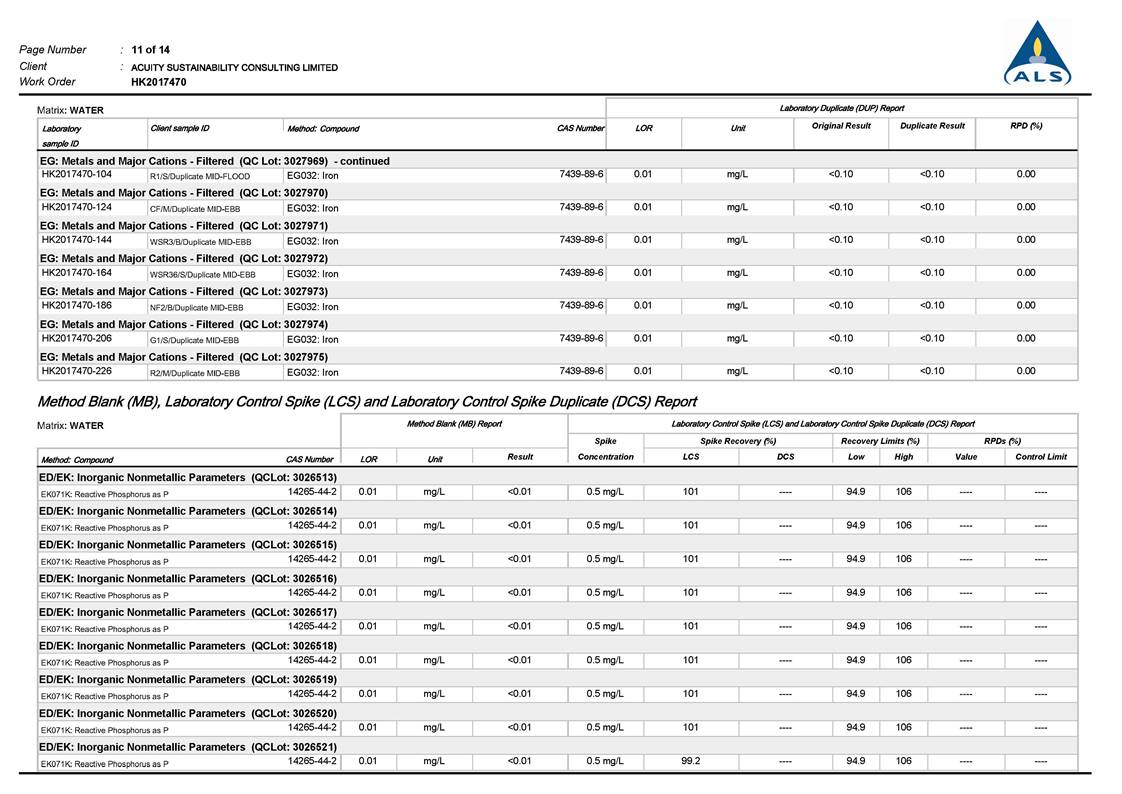
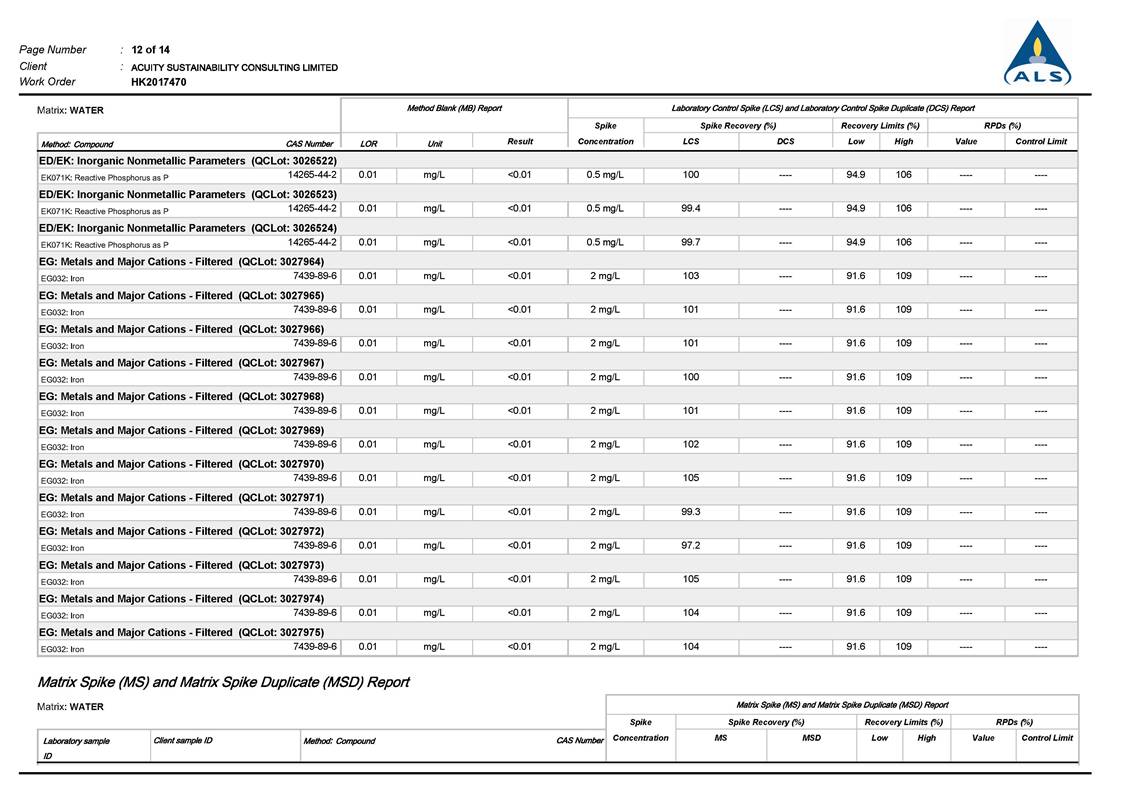
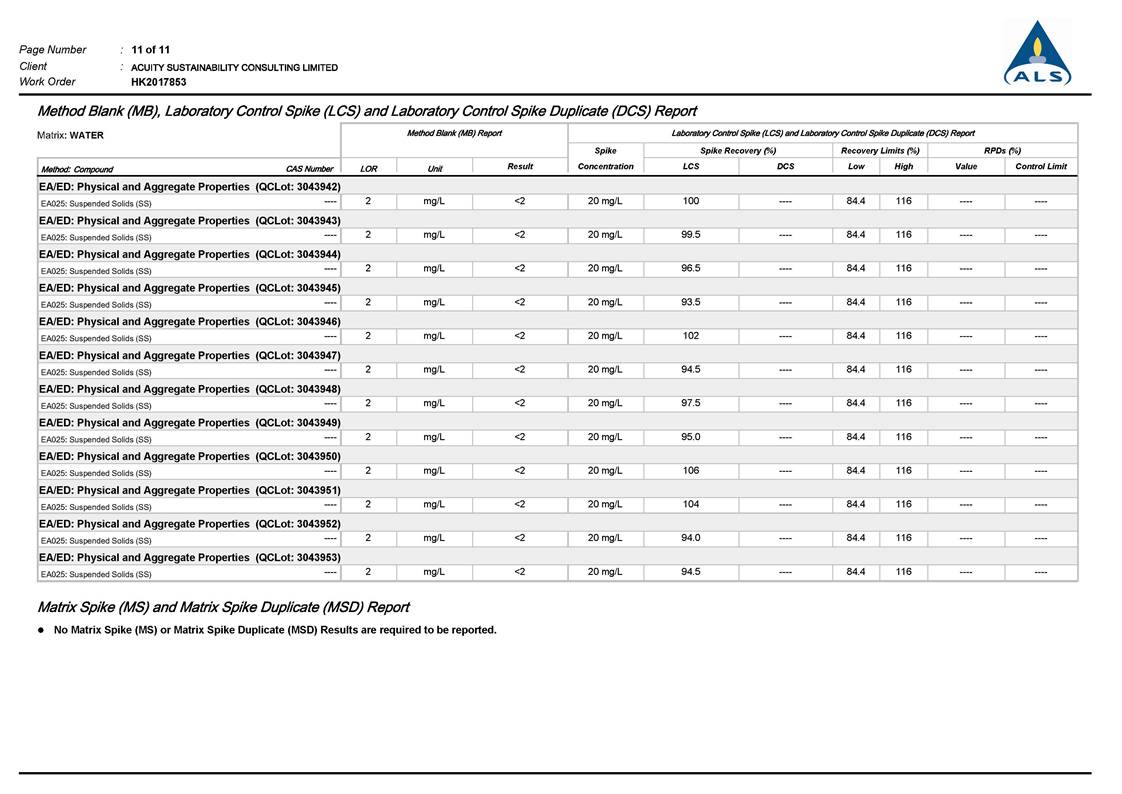
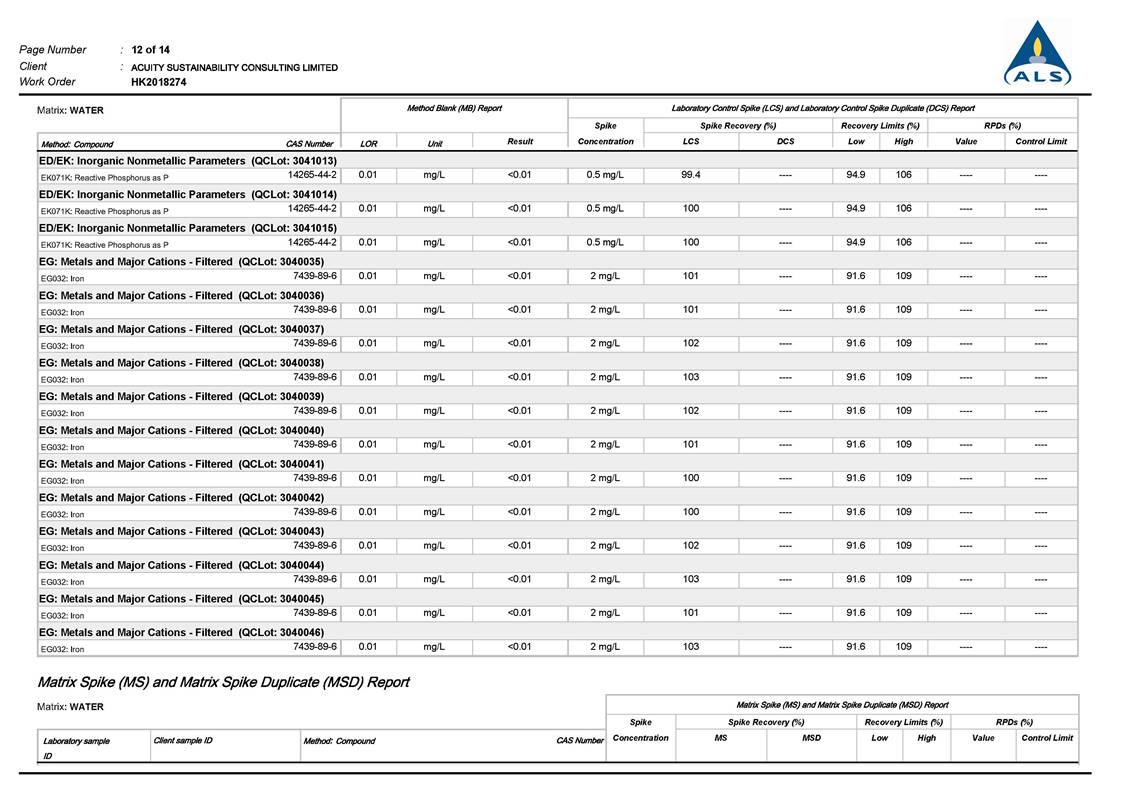
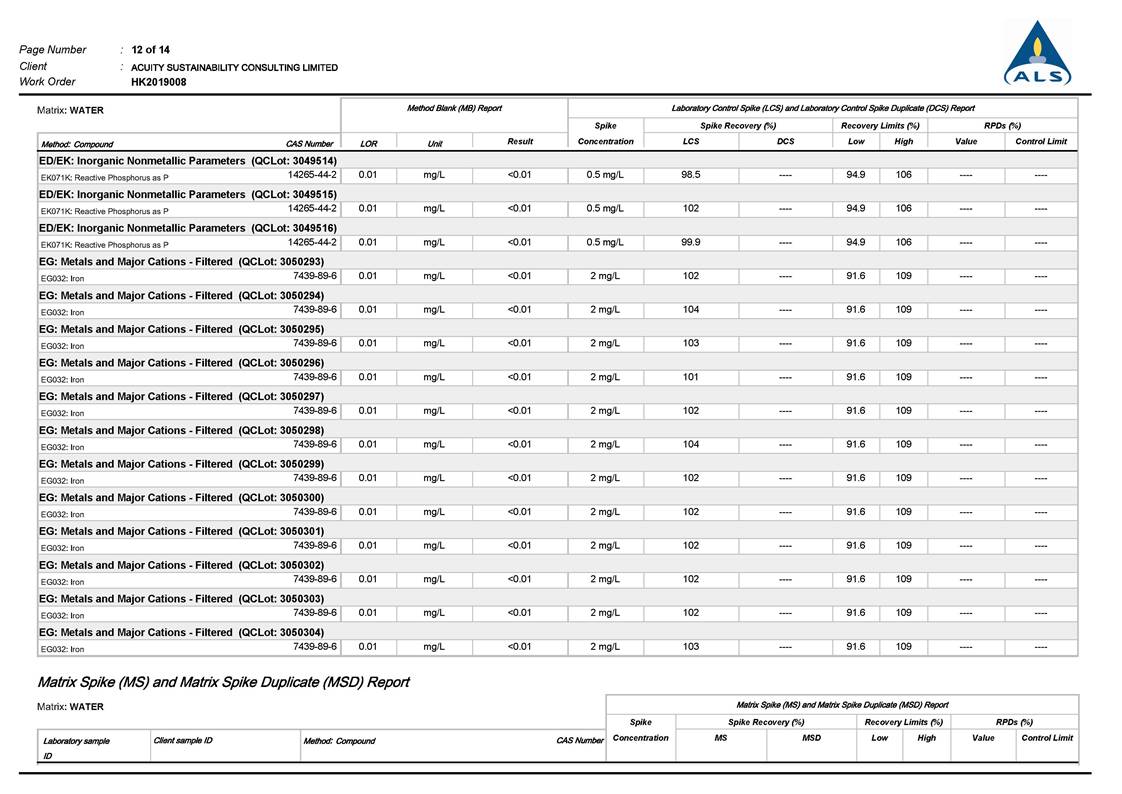
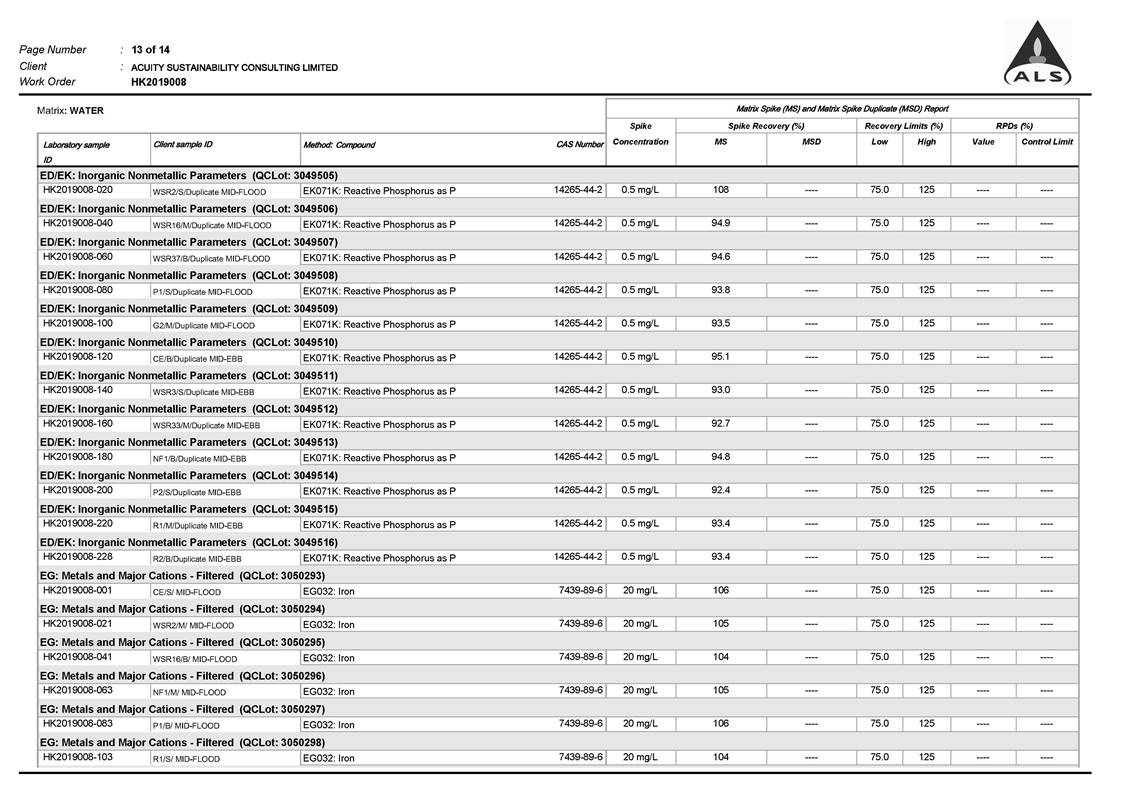
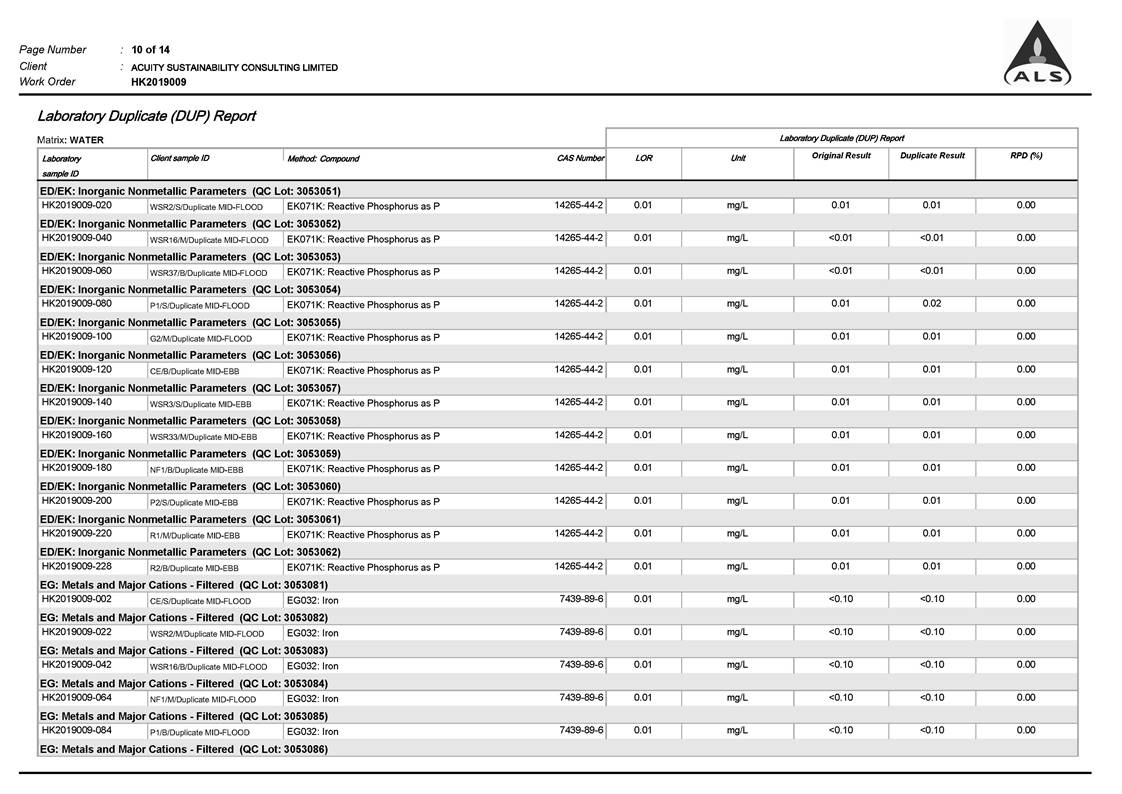
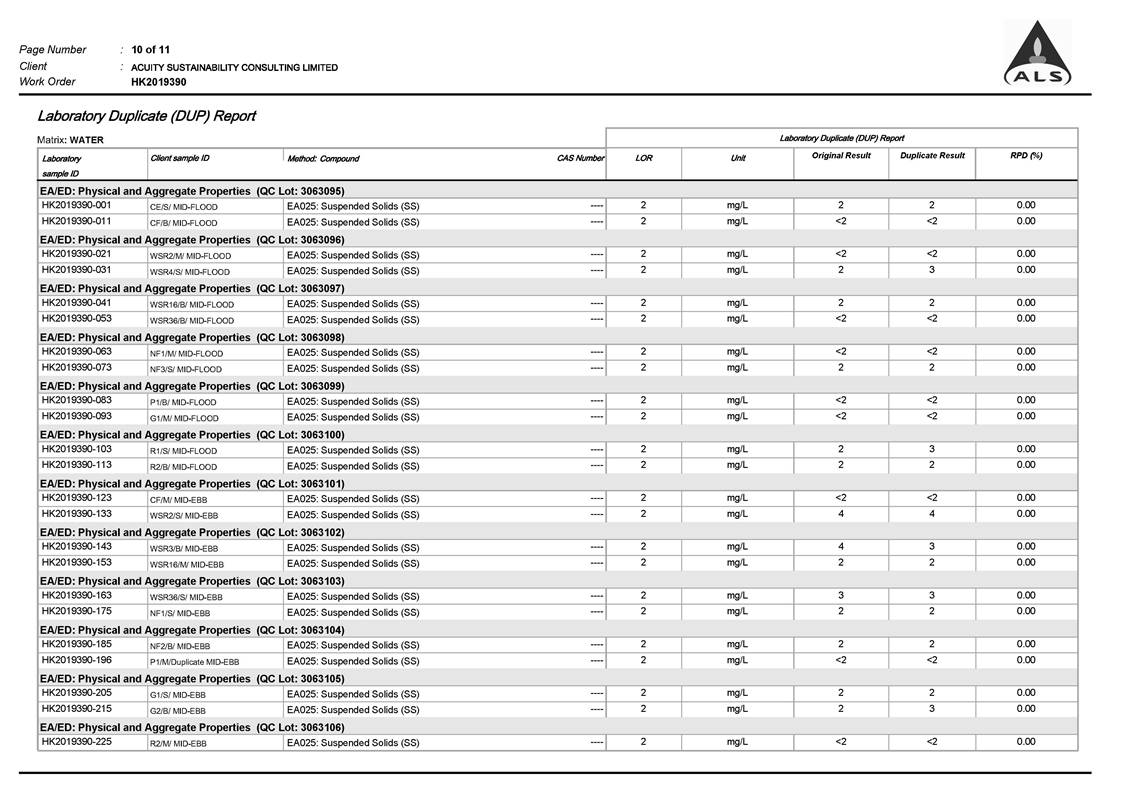
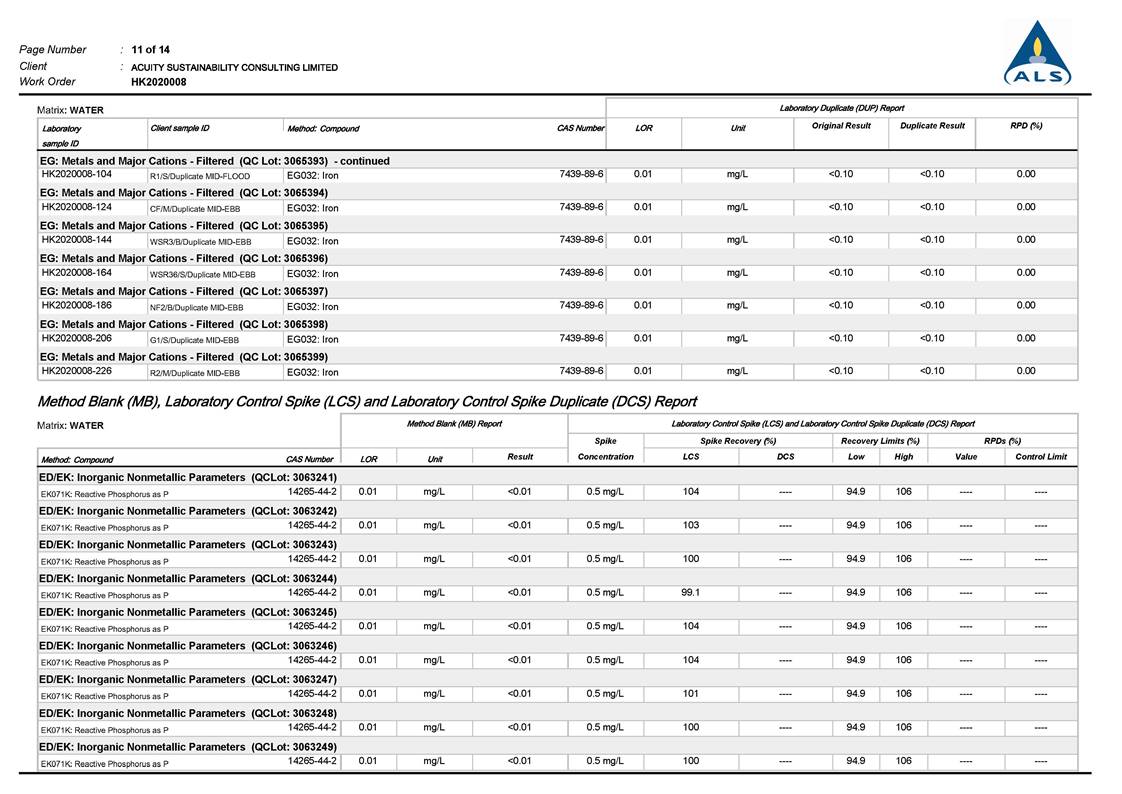
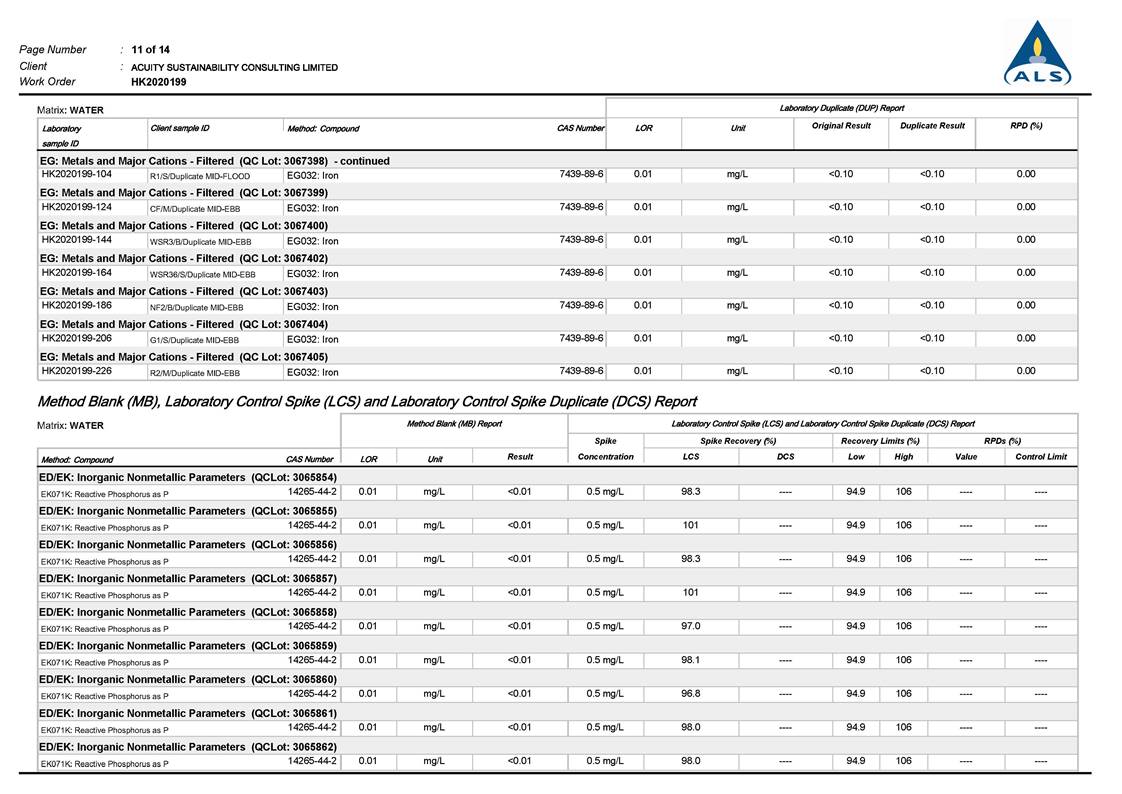
include pre-treatment procedures, instrument use, Quality Assurance/Quality
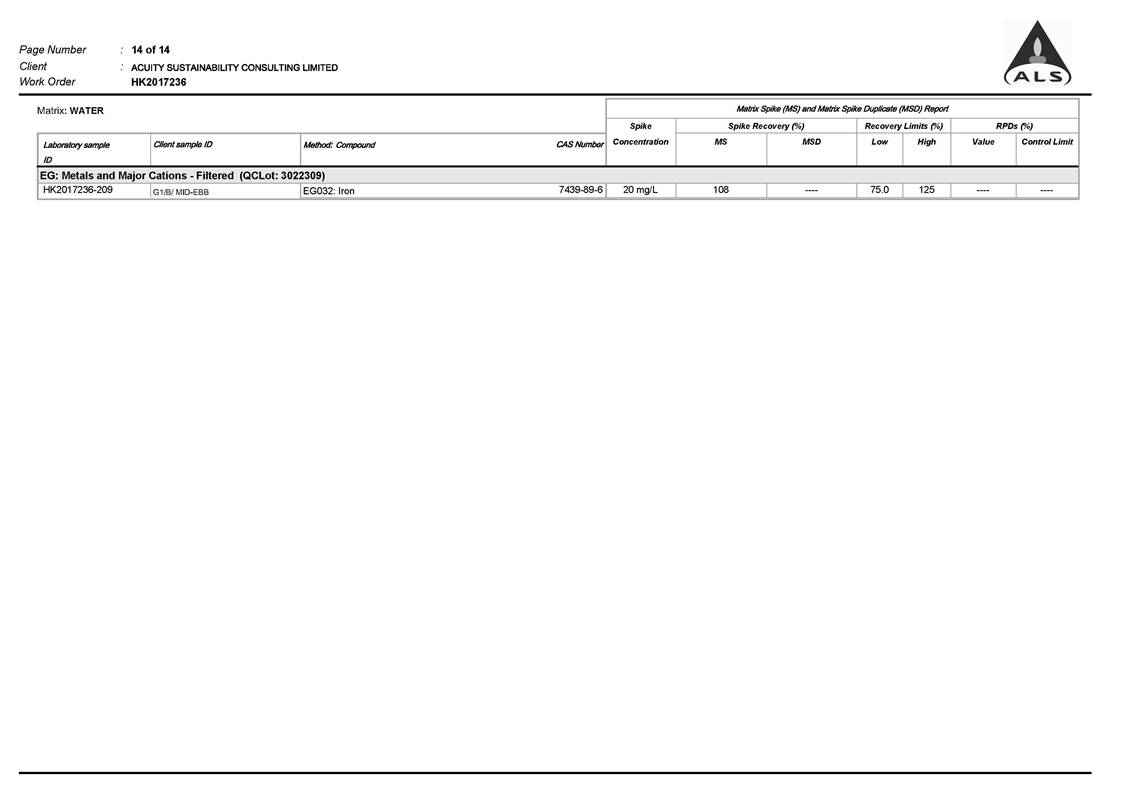
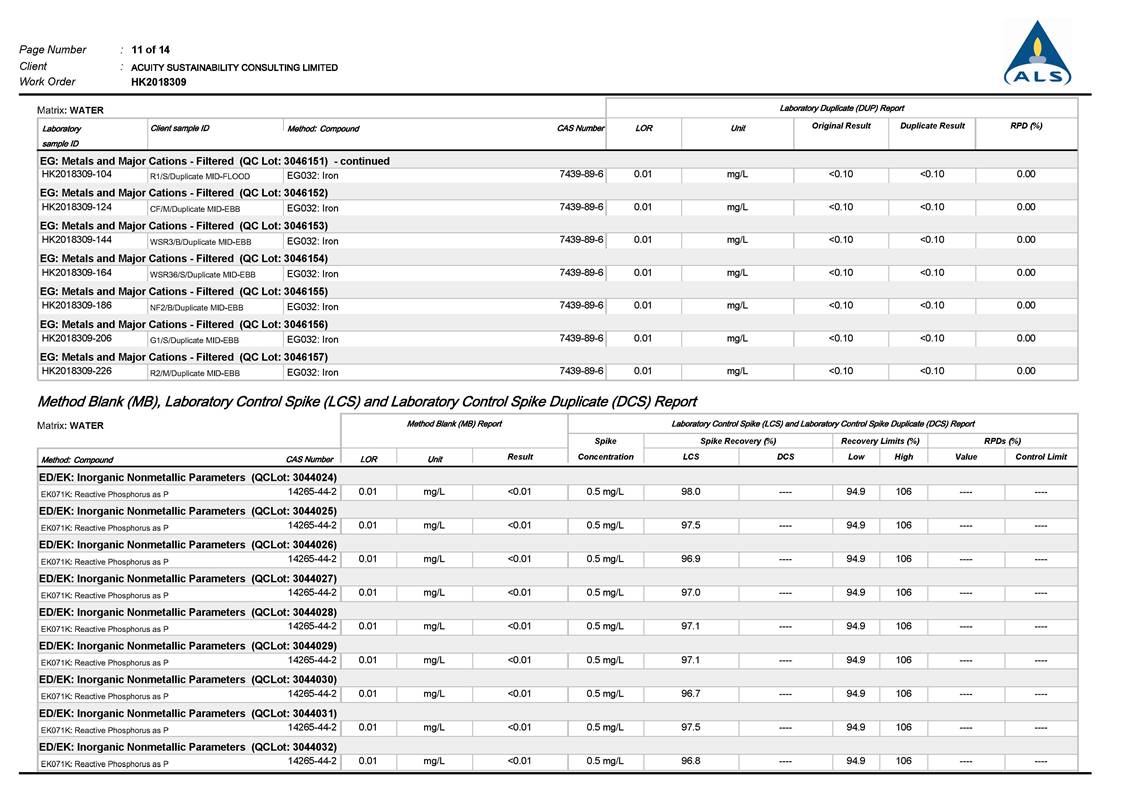
Control (QA/QC) details (such as blank, spike recovery, number of duplicate
samples per-batch etc), detection limits and accuracy. The QA/QC details shall
be in accordance with requirements of HOKLAS or another internationally
accredited scheme.
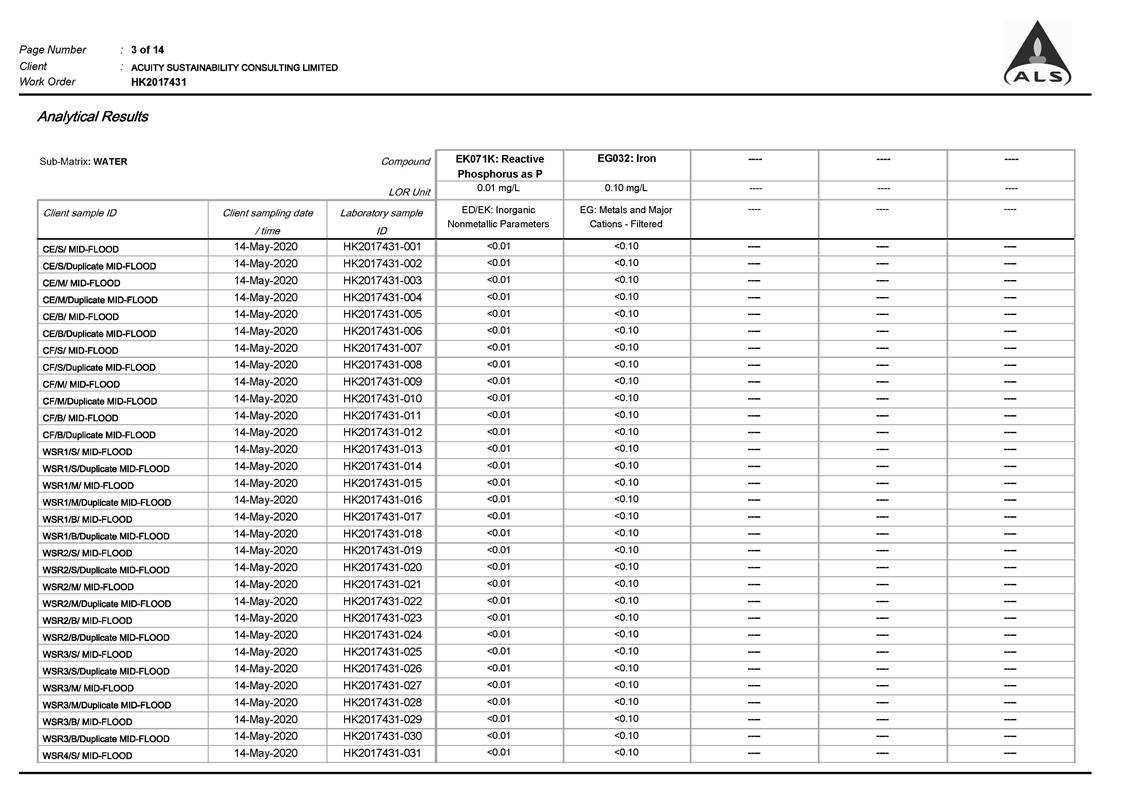
Parameters for laboratory measurements, their standard methods
and their detection limits are presented in Table 2.2.
Table 2.2 Laboratory
measurements, standard methods and corresponding detection limits of marine
water quality monitoring
|
Parameters
|
Standard Methods
|
Detection Limit
|
Reporting Limit
|
Precision
|
|
Dissolved oxygen (mg/L)
|
Instrumental, CTD
|
0.1
|
-
|
��25%
|
|
Temperature (oC)
|
Instrumental, CTD
|
0.1
|
-
|
��25%
|
|
pH
|
Instrumental, CTD
|
0.1
|
-
|
��25%
|
|
Turbidity (NTU)
|
Instrumental, CTD
|
0.1
|
-
|
��25%
|
|
Salinity (0/00)
|
Instrumental, CTD
|
0.1
|
-
|
��25%
|
|
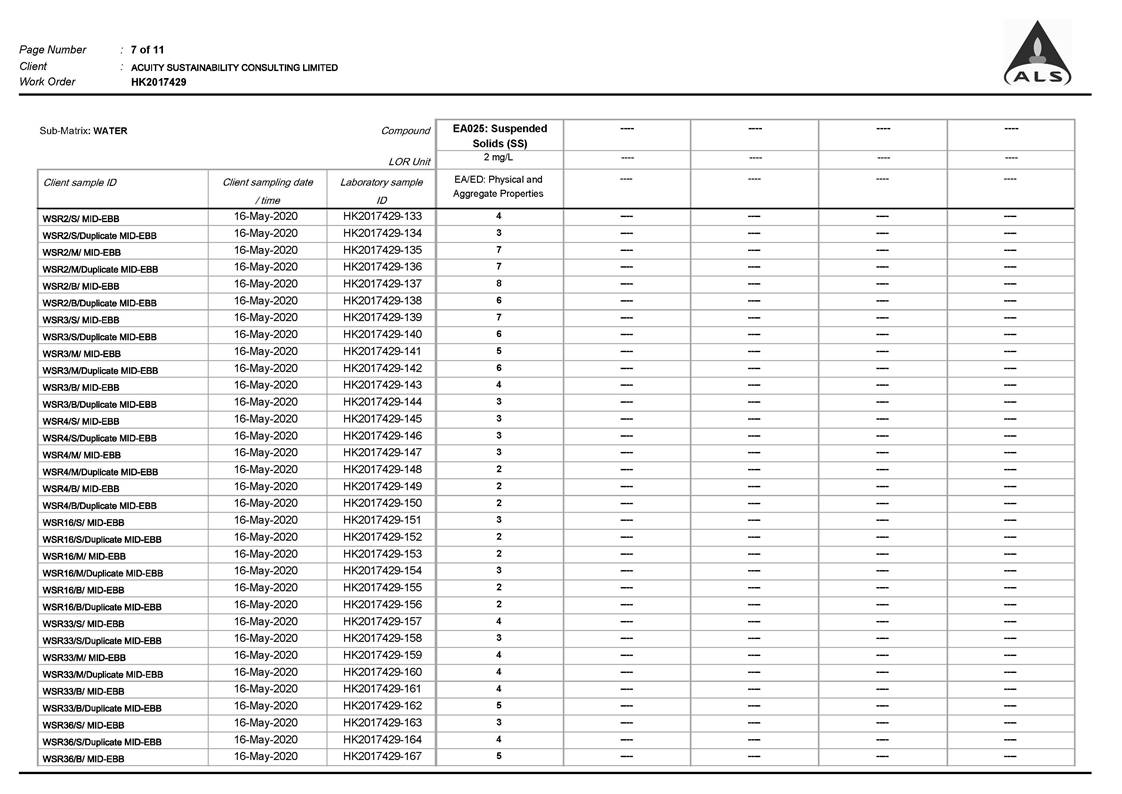
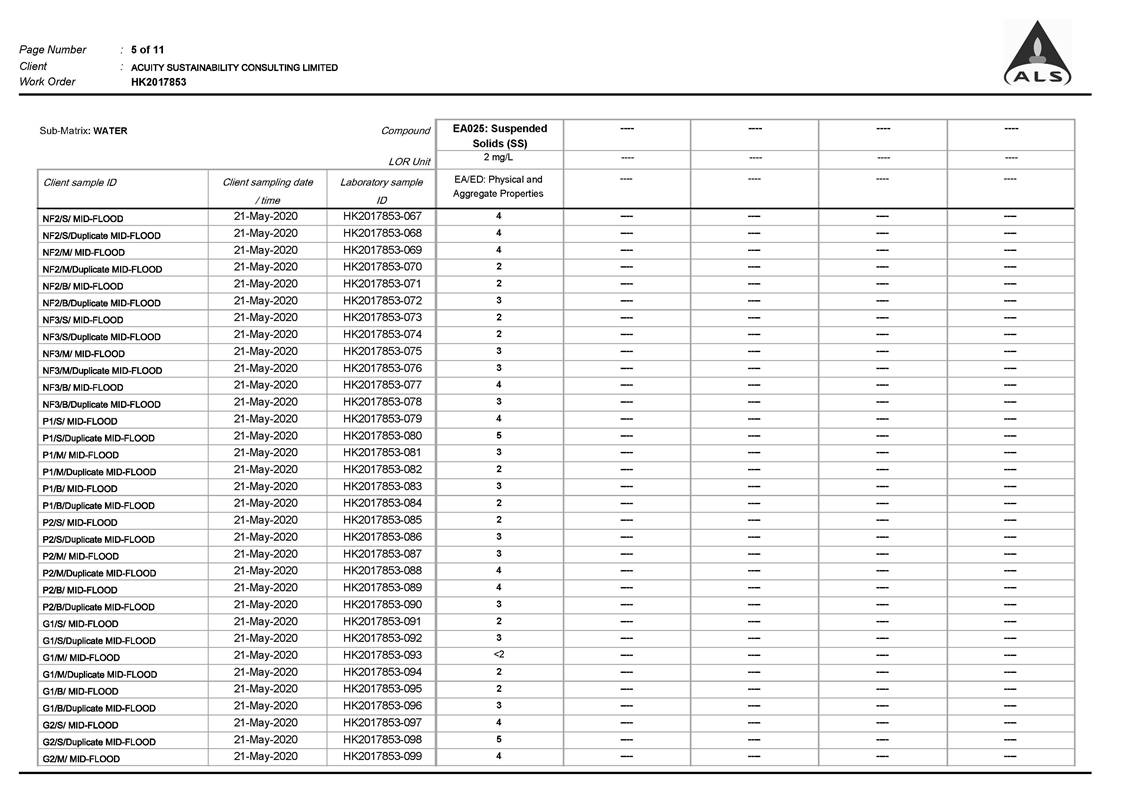
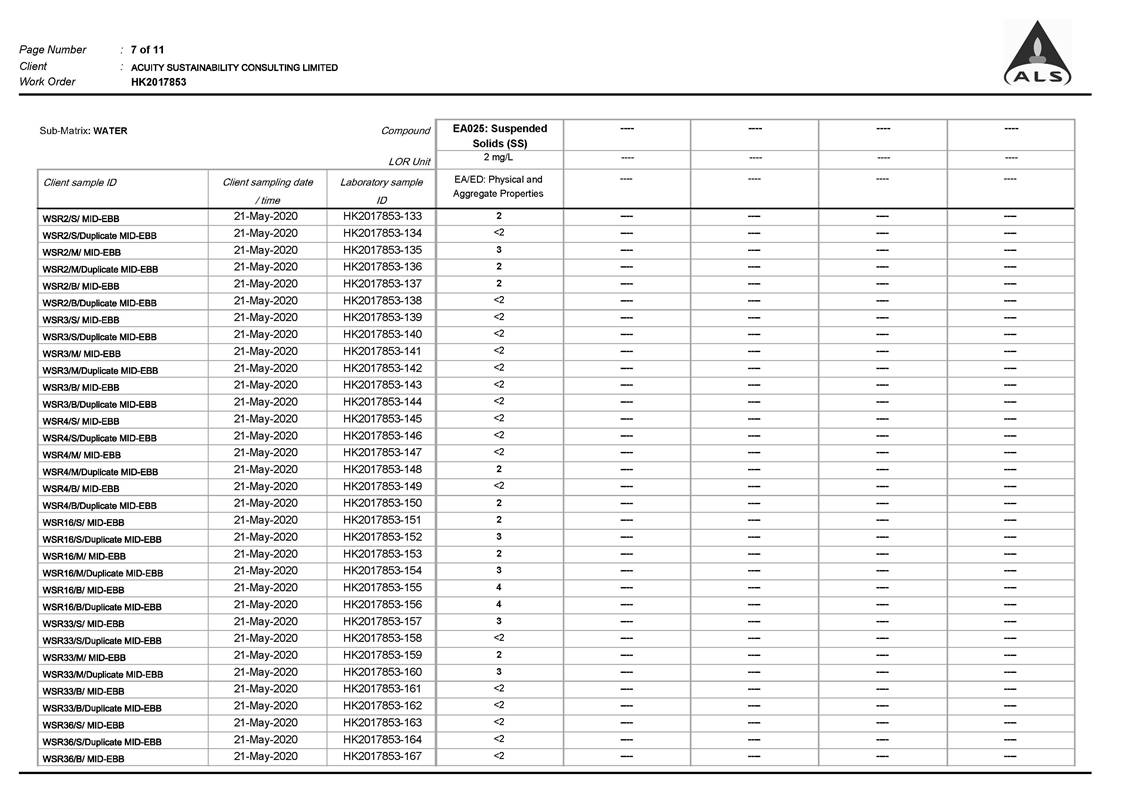
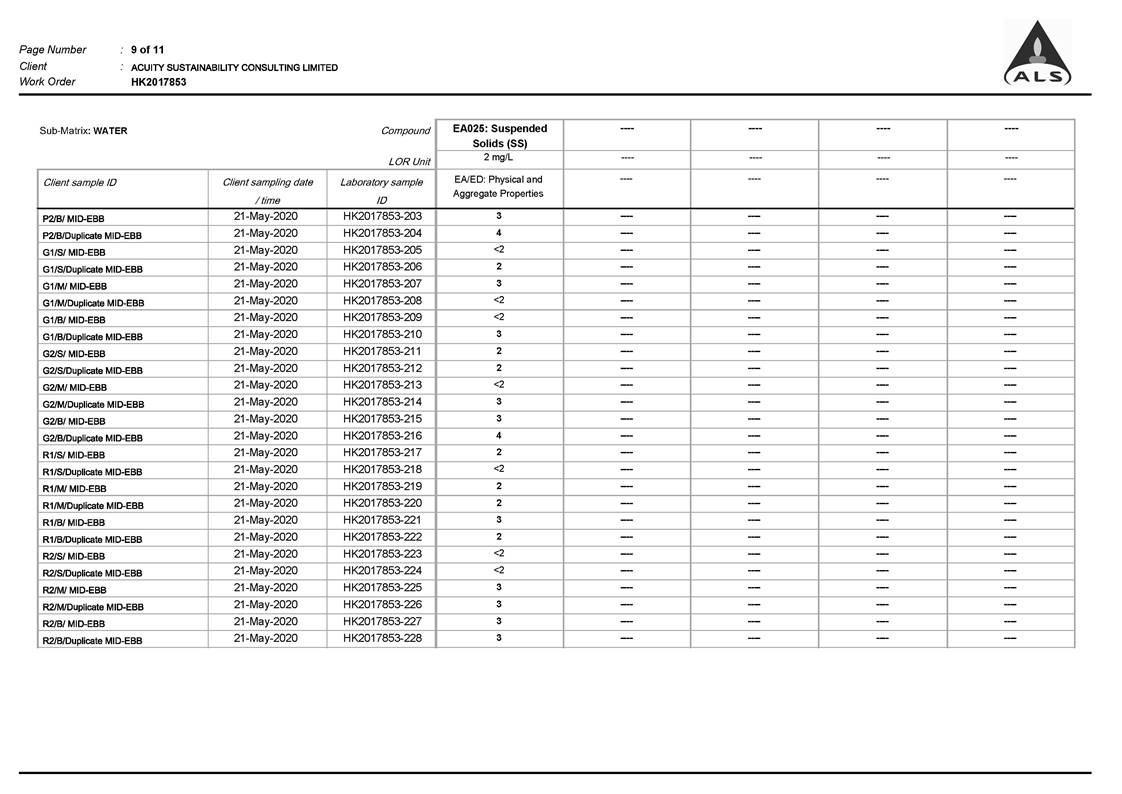
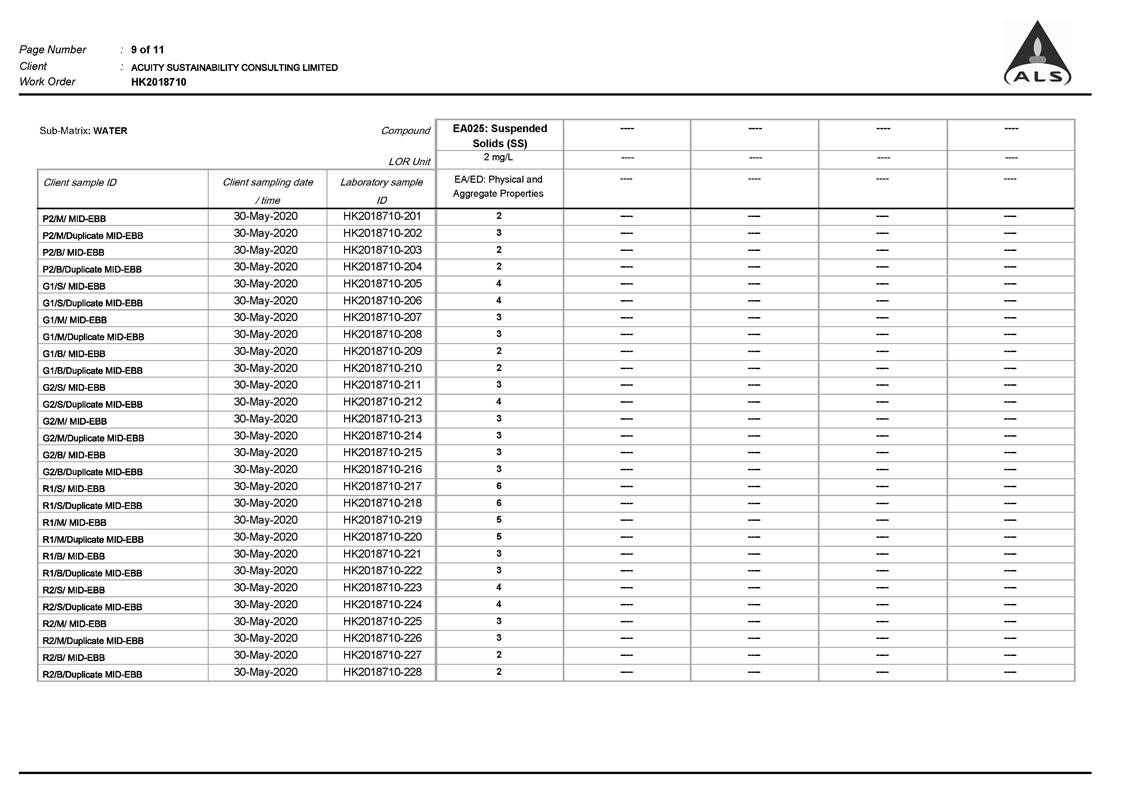
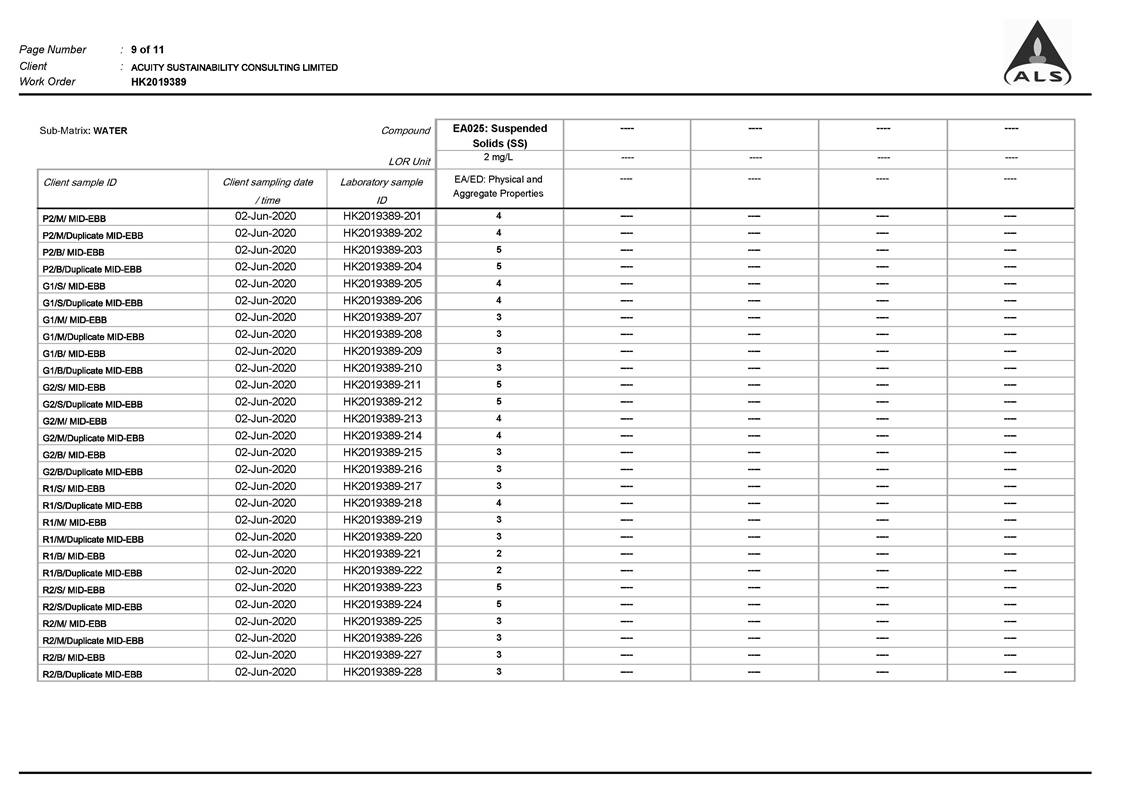
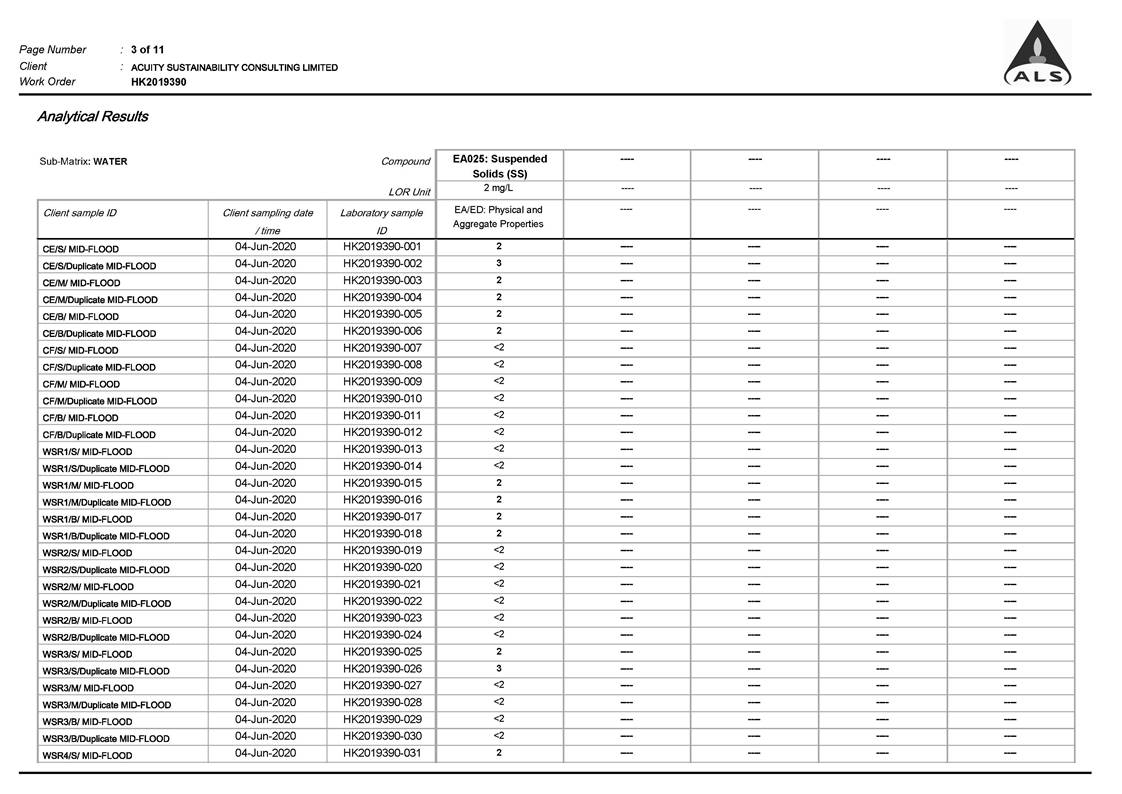
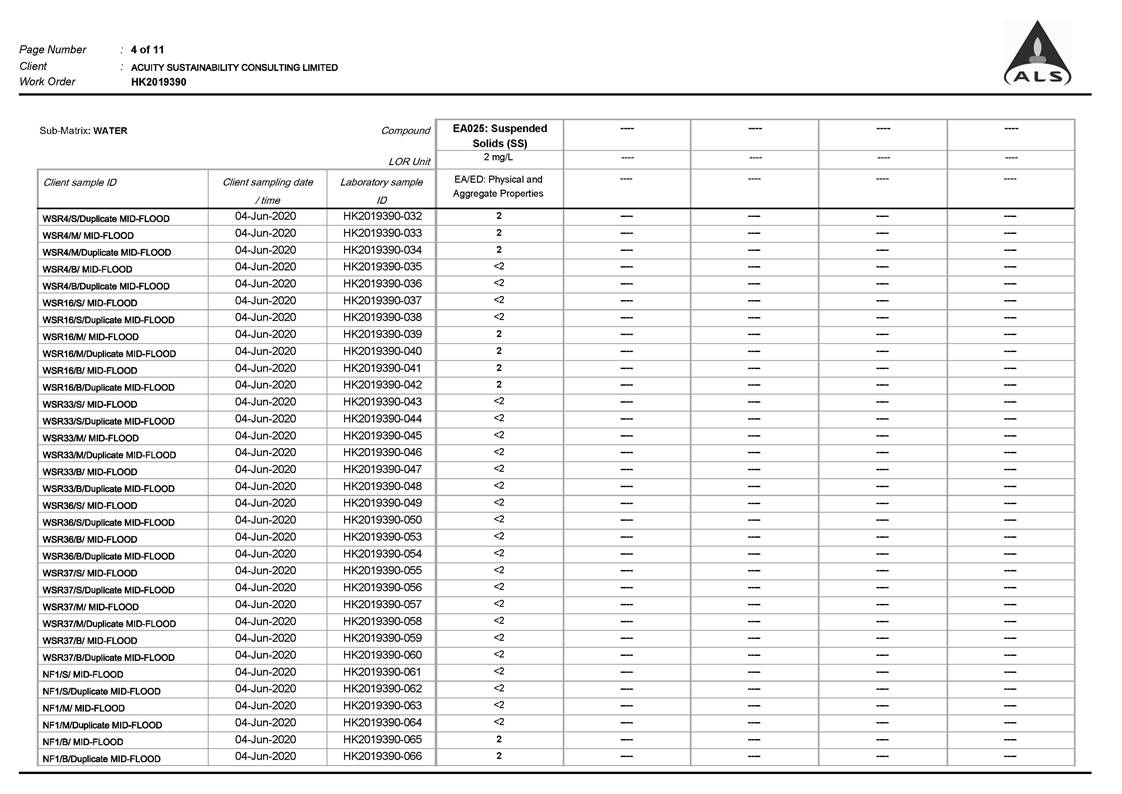
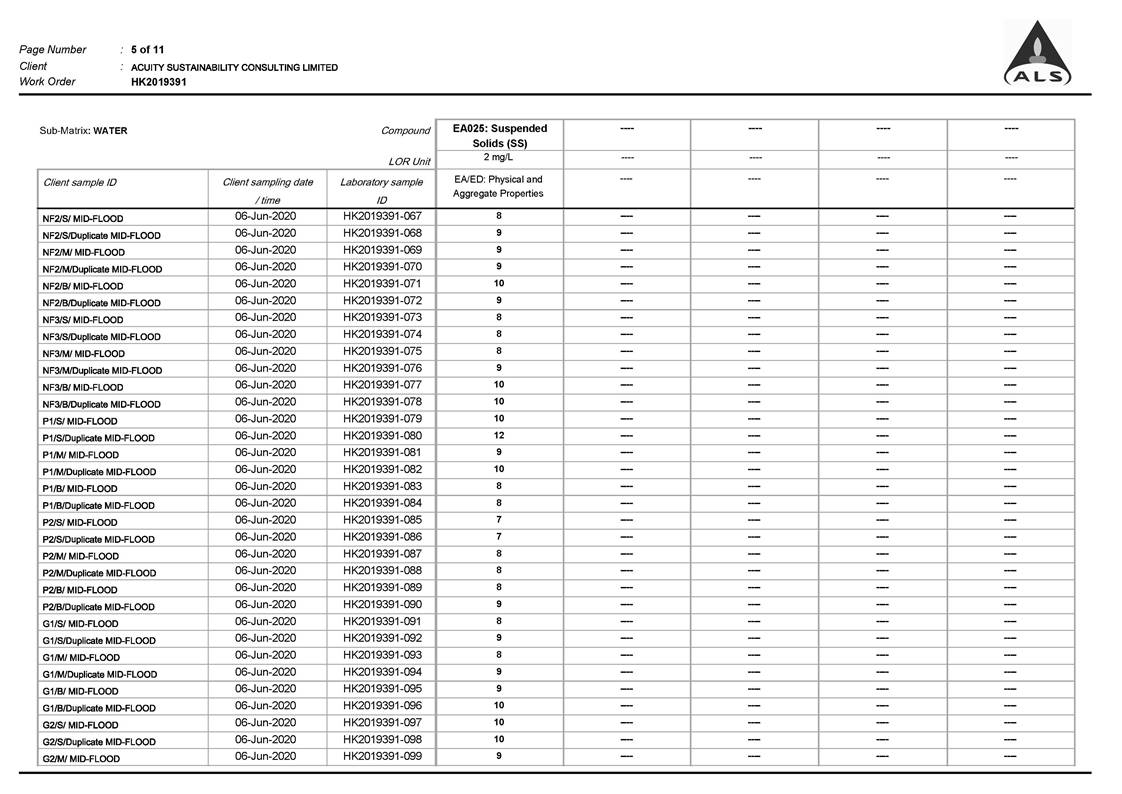
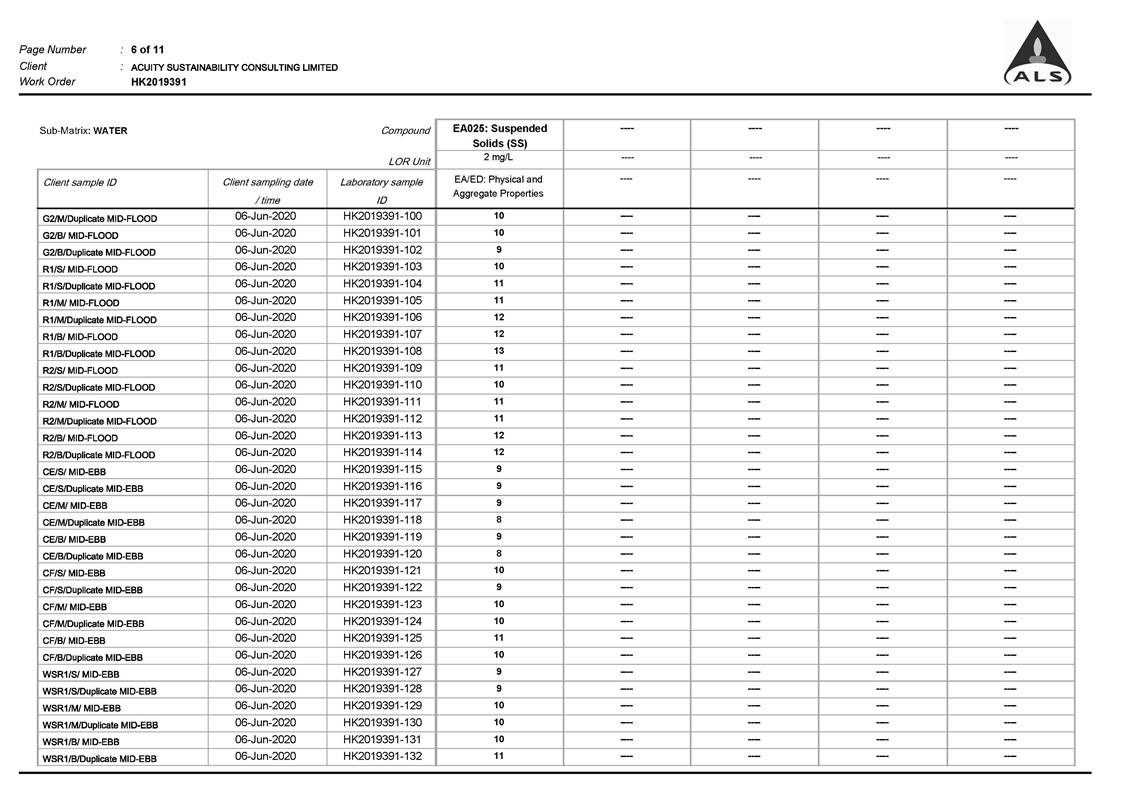
Suspended Solids (mg/L)
|
APHA 17th Ed 2540D
|
1.0
|
2.0
|
��25%
|
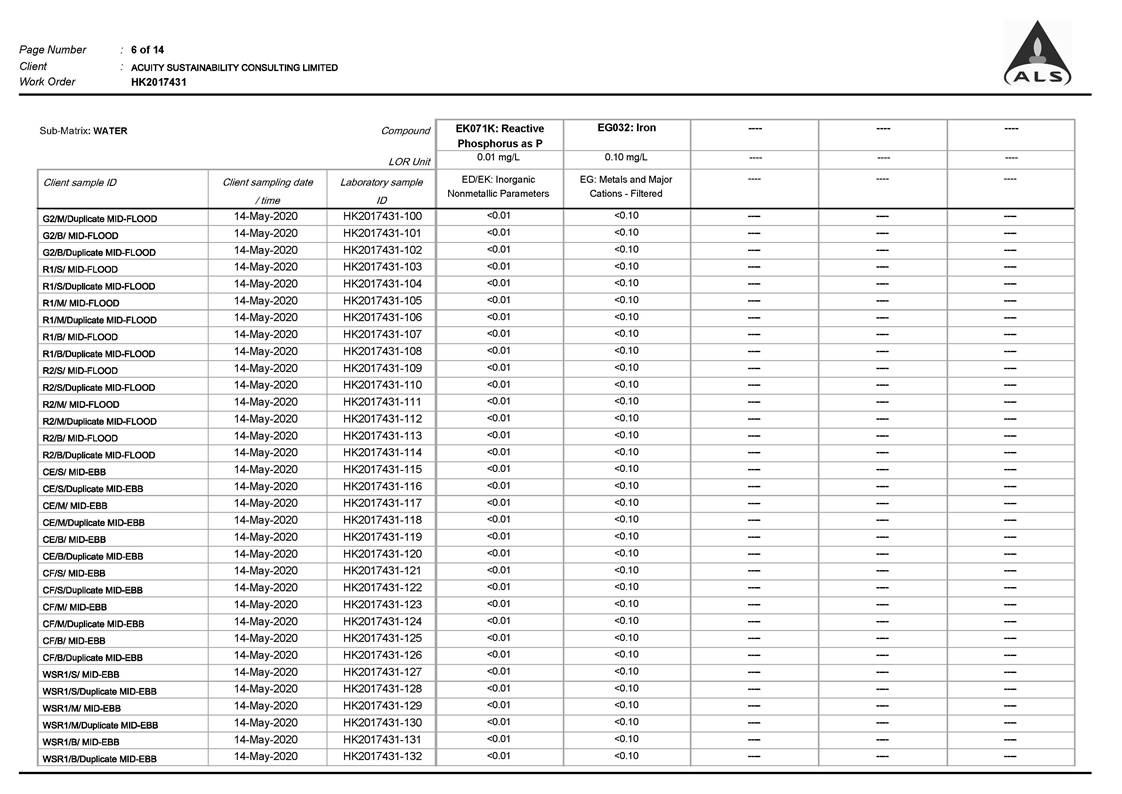
|
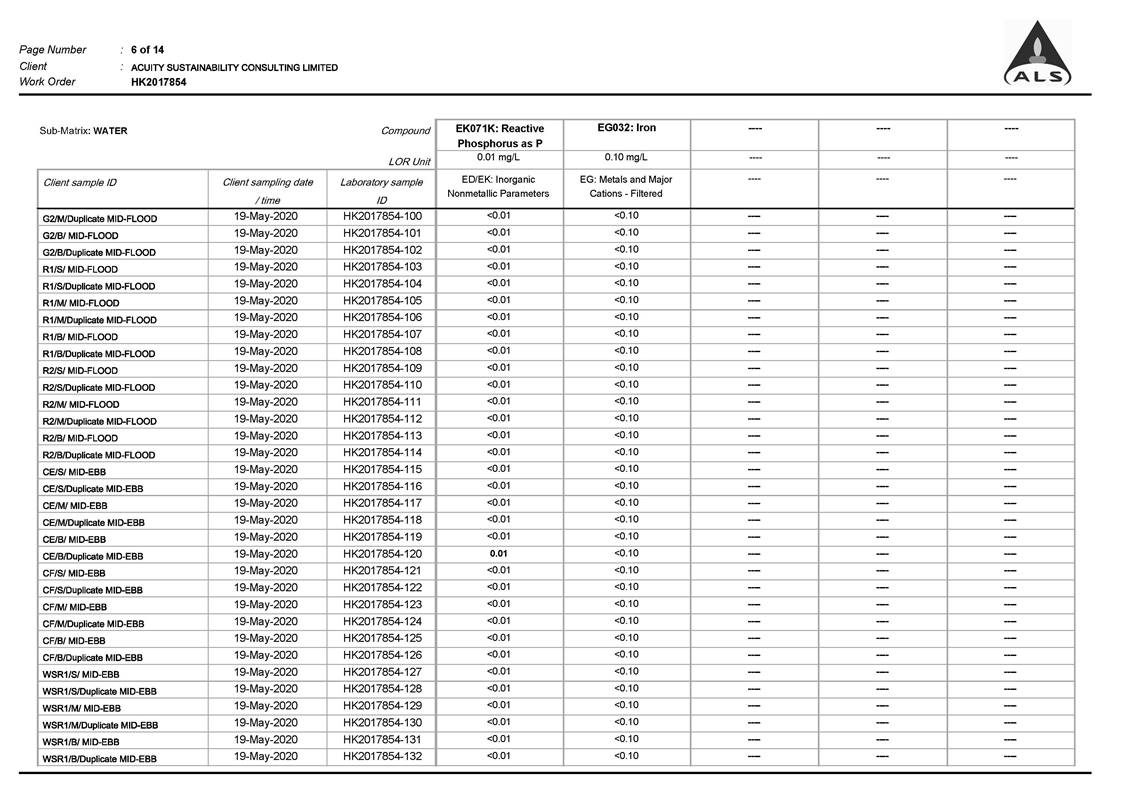
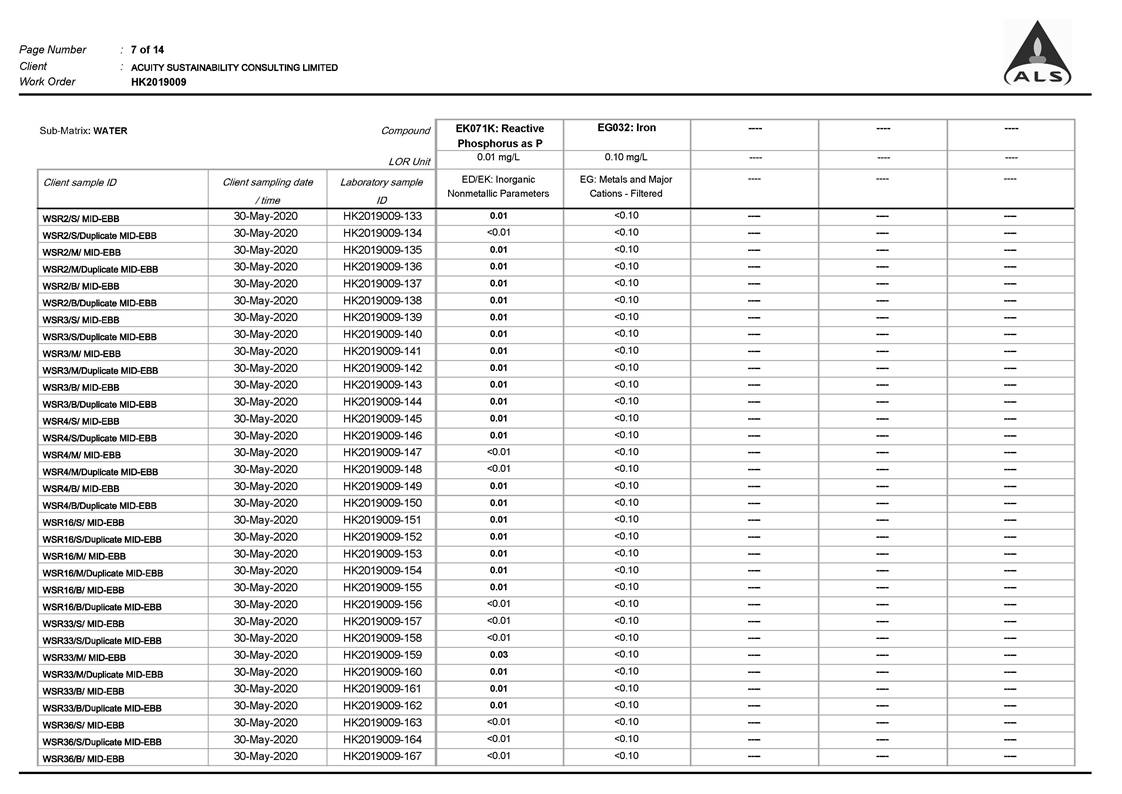
Iron-soluble
|
USEPA 6010C NOTE 1
|
0.2NOTE1
|
0.2NOTE1
|
��25%NOTE1
|
NOTE1: The testing methods, Quality Assurance/Quality
Control (QA/QC) details, detection limits and accuracy shall be submitted to
EPD for approval prior to the commencement of monitoring programme.
2.3.4.
Monitoring
Location
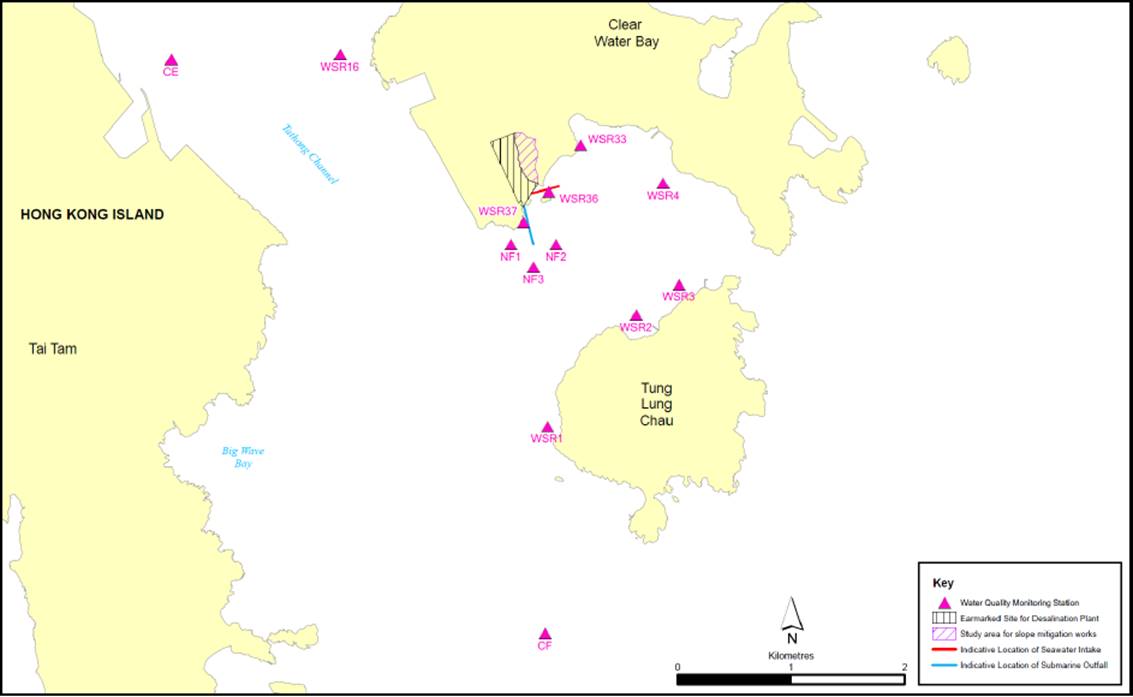
The
water quality monitoring locations for baseline in accordance to the EM&A
Manual and Contract Specification are shown in Figure 2.1 and detailed
in Table 2.3 below. A schedule for water quality monitoring shall be
prepared by the ET and approved by IEC and EPD prior to the commencement of the monitoring.
Table 2.3 Location of Baseline Water Quality Monitoring Station
|
Station
|
Easting
|
Northing
|
Description
|
|
|
CE
|
843550
|
815243
|
Upstream control station at ebb tide
|
|
|
CF
|
846843
|
810193
|
Upstream control station at flood tide
|
|
|
WSR1
|
846864
|
812014
|
Ecological sensitive receiver at Tung Lung Chau
|
|
|
WSR2
|
847645
|
812993
|
Fisheries sensitive receiver at Tung Lung Chau
|
|
|
WSR3
|
848023
|
813262
|
Ecological sensitive receiver at Tung Lung Chau
|
|
|
WSR4
|
847886
|
814154
|
Ecological sensitive receiver at Tai Miu Wan
|
|
|
WSR16
|
845039
|
815287
|
Ecological sensitive receiver at Fat Tong Chau
|
|
|
WSR33
|
847159
|
814488
|
Ecological sensitive receiver at Tai Miu Wan
|
|
WSR36
|
846878
|
814081
|
Ecological sensitive receiver at Kwun Tsai
|
|
WSR37
|
846655
|
813810
|
Ecological sensitive receiver at Tit Cham Chau
|
|
NF1
|
846542
|
813614
|
Edge of mixing zone, ~ 200m west of outfall diffuser
|
|
NF2
|
846942
|
813614
|
Edge of mixing zone, ~ 200m east of outfall diffuser
|
|
NF3
|
846742
|
813414
|
Edge of mixing zone, ~ 200m south of outfall diffuser
|
WSR1
to WSR37 were identified in accordance with Annex 14 of the EIAO-TM as well as
Clause
3.4.4.2
of the Environmental Impact Assessment Study Brief for Desalination Plant at
Tseung Kwan O (No. ESB-266/2013). WSR1 to WSR3 are sited near the Tung Lung
Chau Fish Culture Zone; WSR16 and WSR36 are sited near the coral assemblages
along the coastlines of Fat Tong Chau and Kwun Tsai respectively; WSR 4 and
WSR33 are sited near the Coastal Protection Area and coral assemblages in
waters of Tai Miu Wan; WSR37 is sited near the fisheries resource including
spawning and nursery grounds at the coastal water of Tit Cham Chau.
2.4.
IN-SITU MEASUREMENT
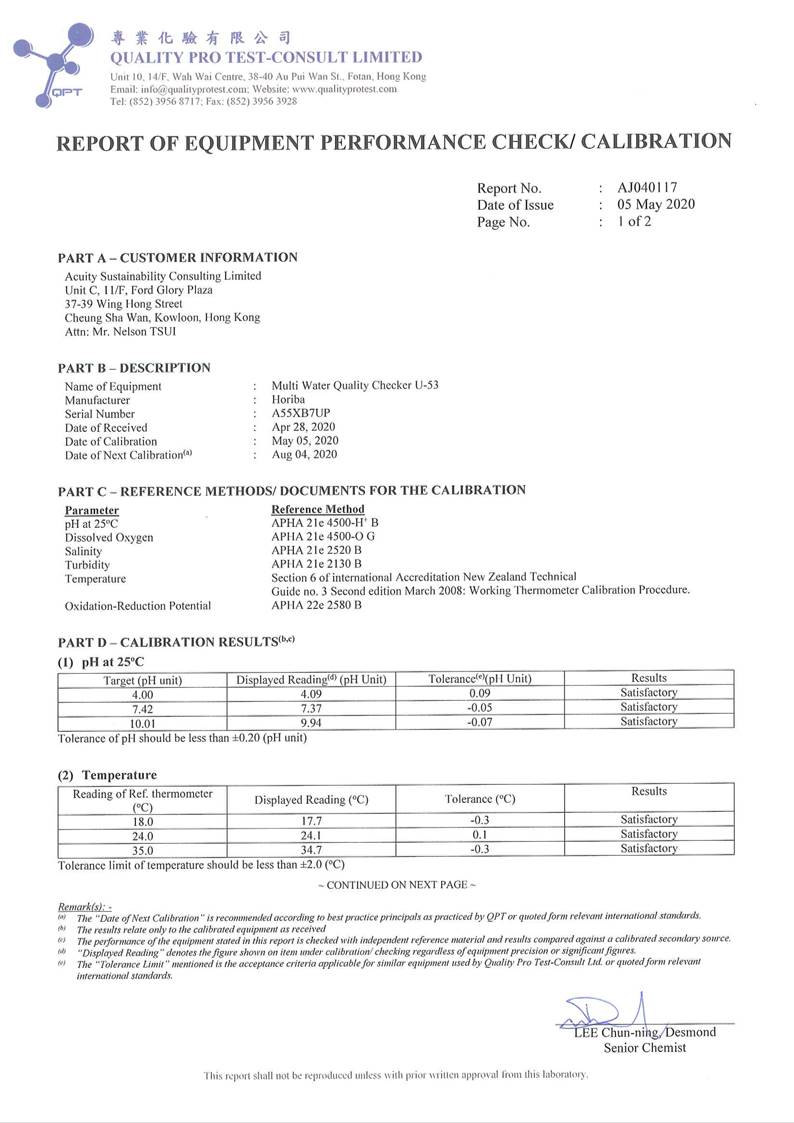
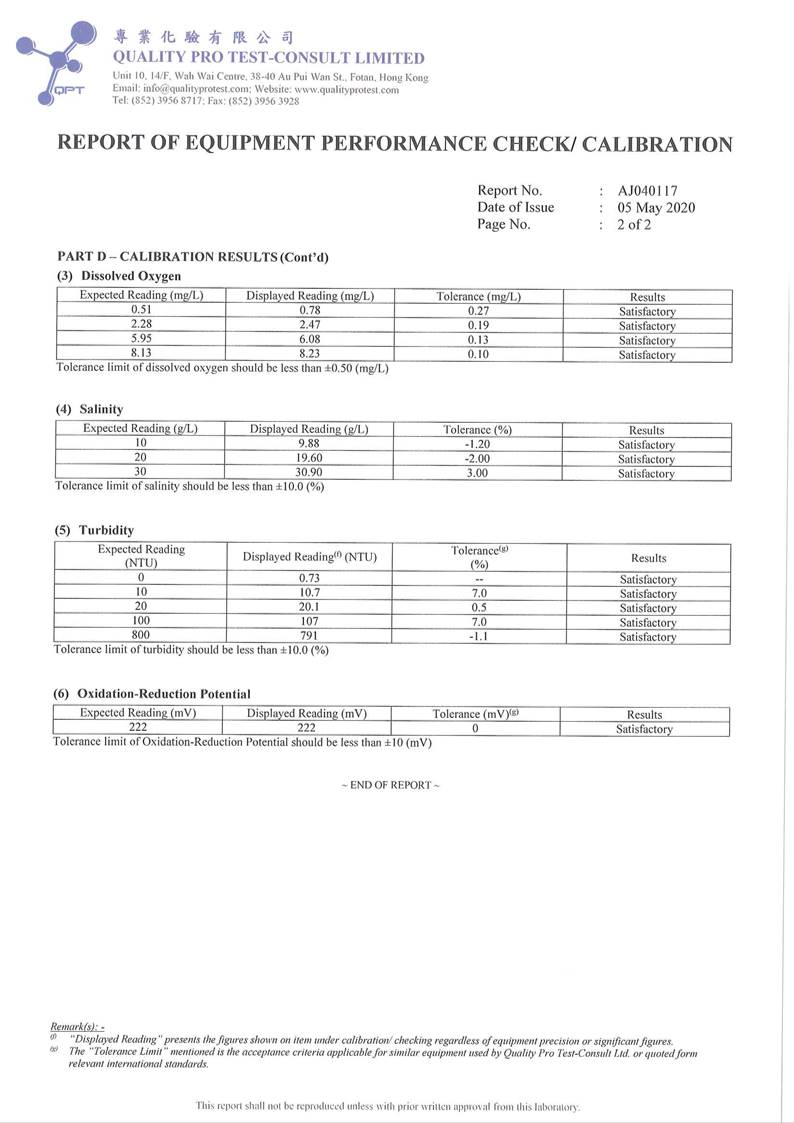
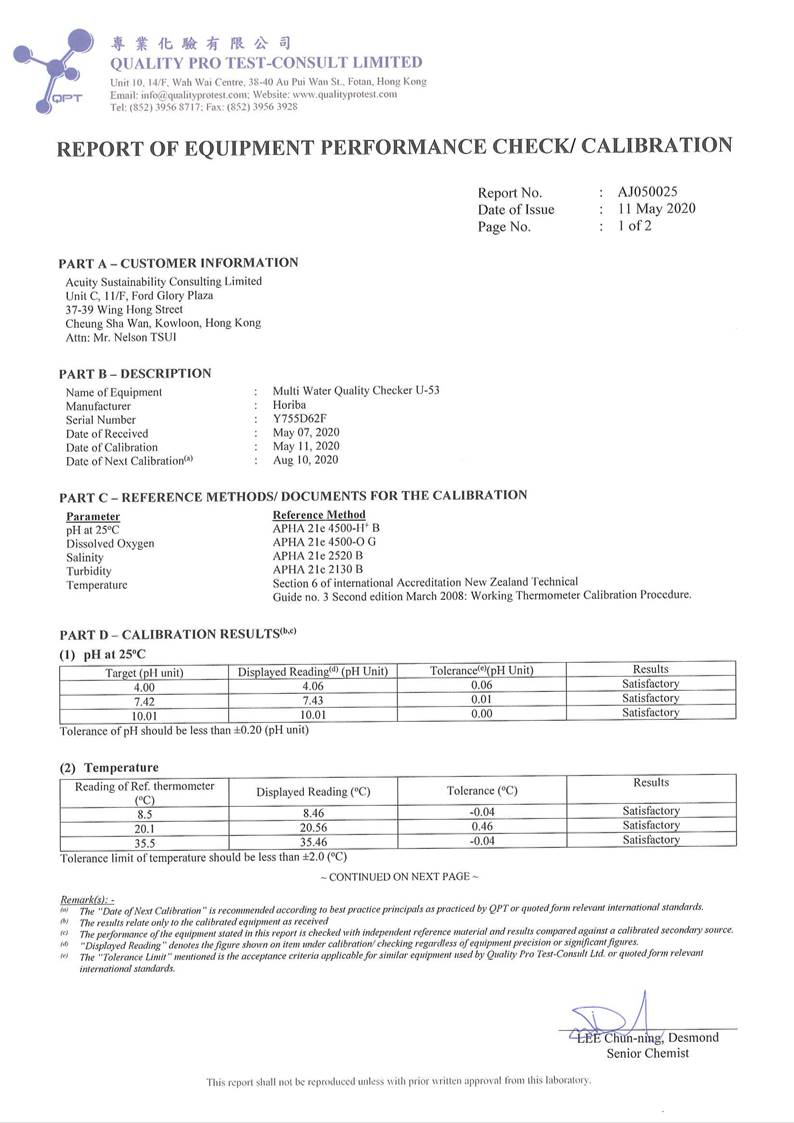
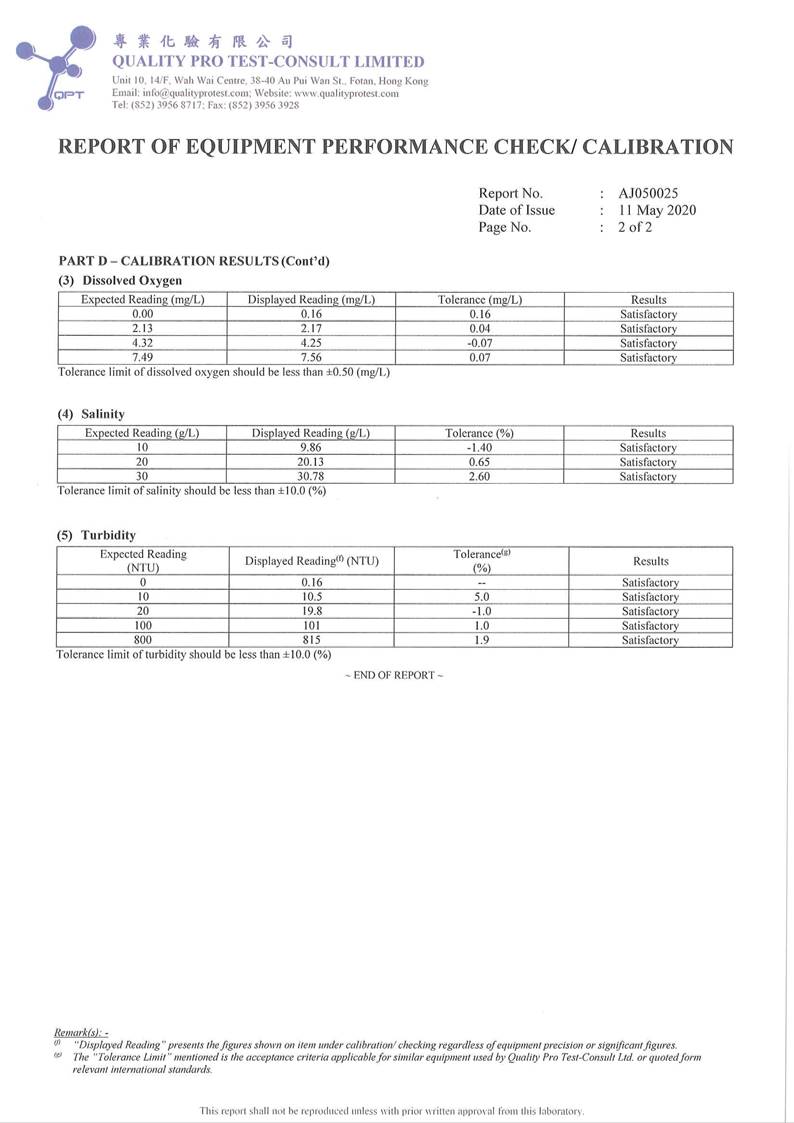
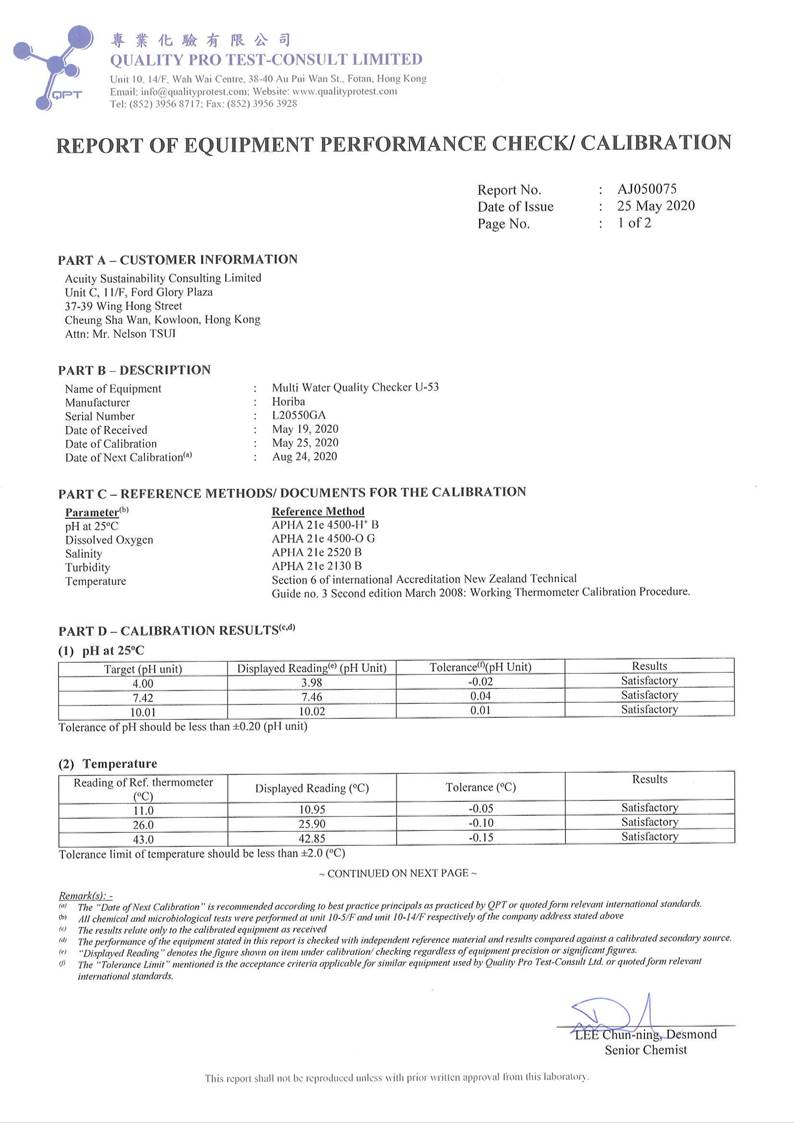
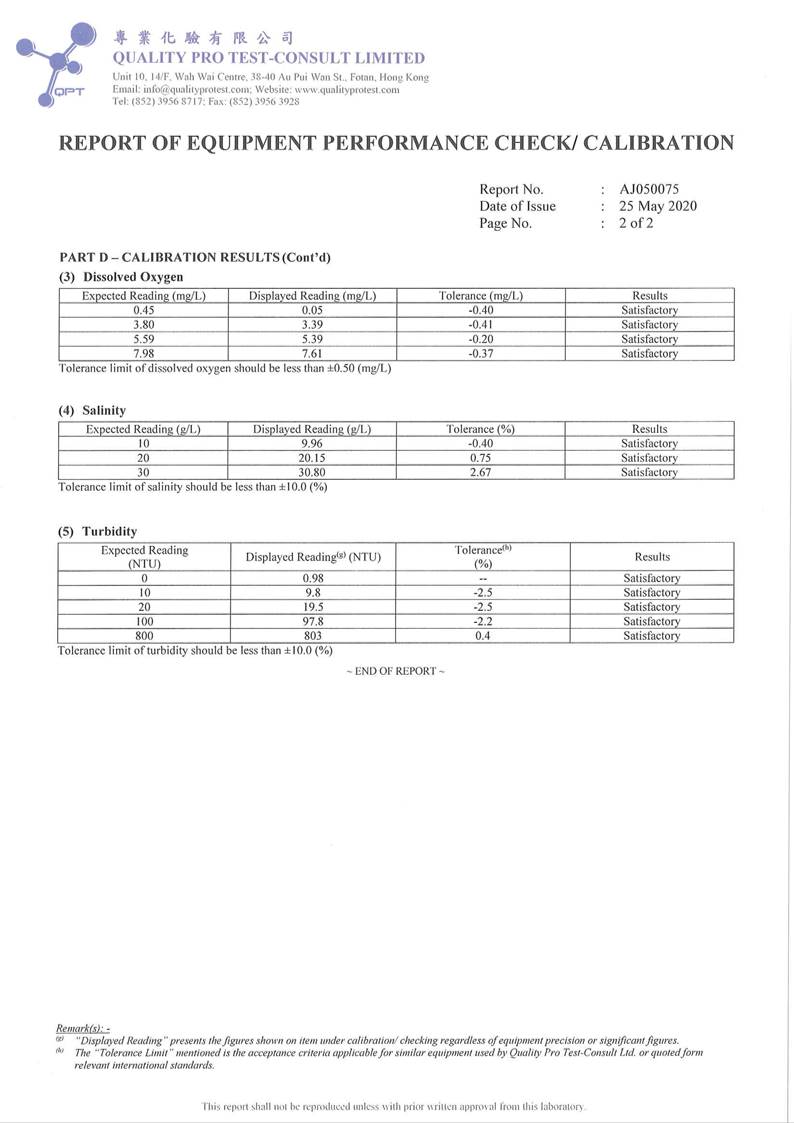
2.4.1. Levels of DO, pH, temperature,
turbidity and salinity would be measured in-situ by portable and weatherproof measuring
instrument, e.g. Horiba U-53 Multiparameter complete with cable and sensor.
(Refer to https://www.horiba.com/fileadmin/uploads/Process-
Environmental/Documents/Downloads_Catalog/Catalog_Water_Quality/U-
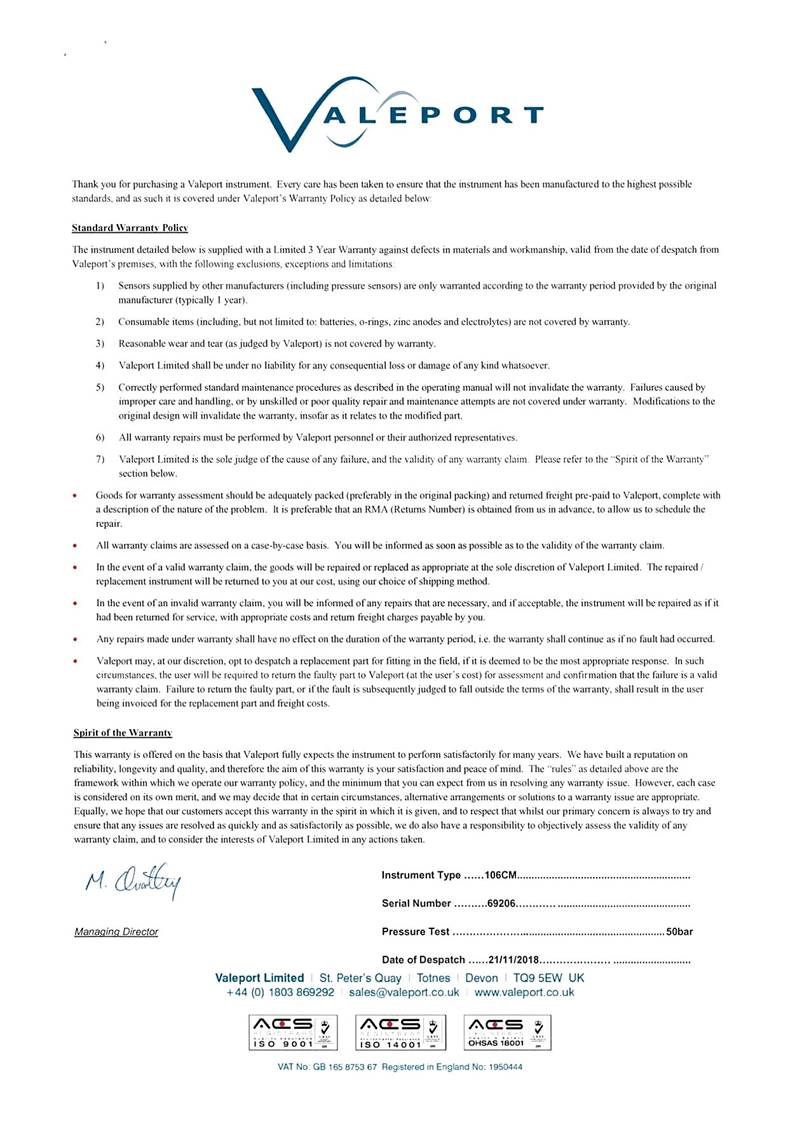
50_brochure_en_HRE1930E.pdf for Horiba U-53 technical specification). Water current velocity
and Water Current direction would be measured by portable and weatherproof
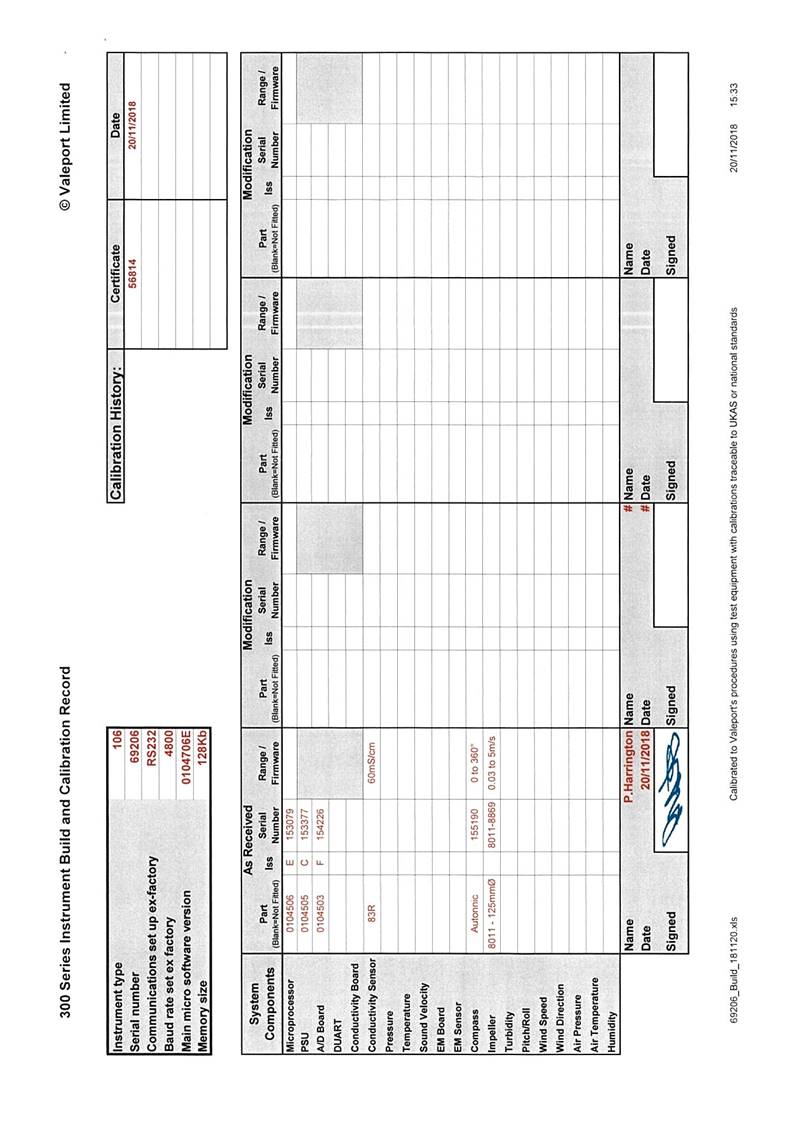
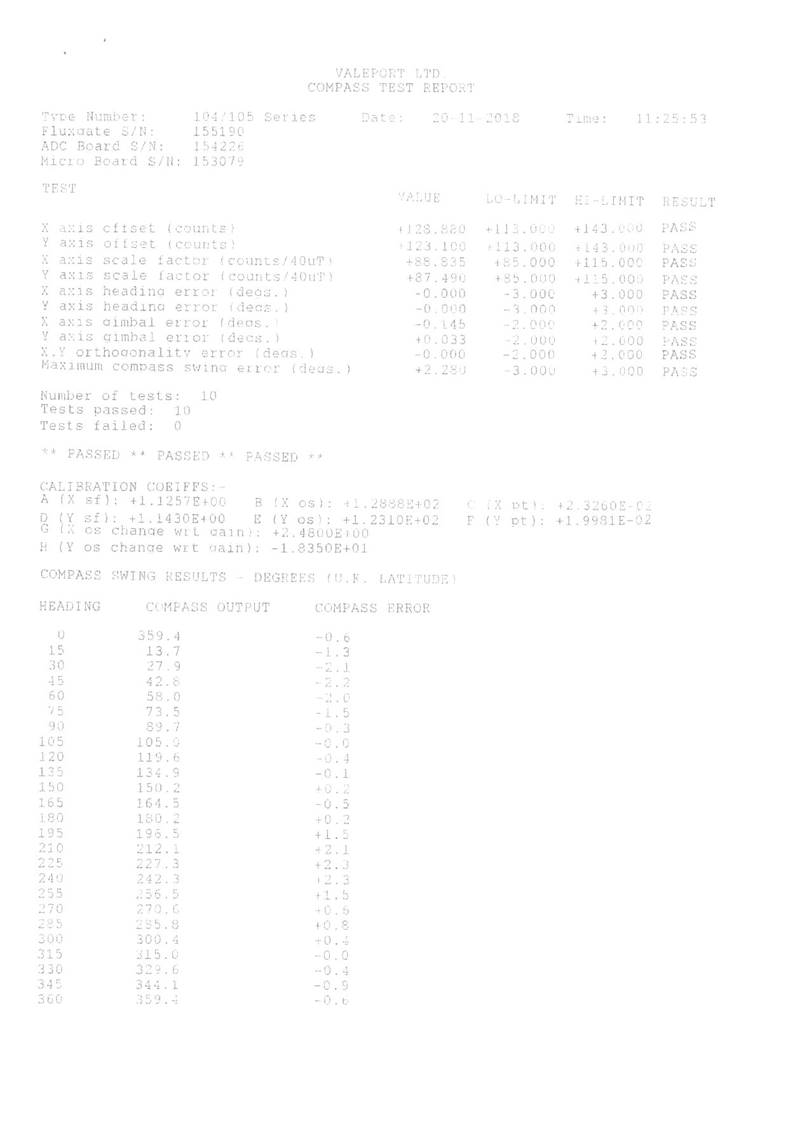
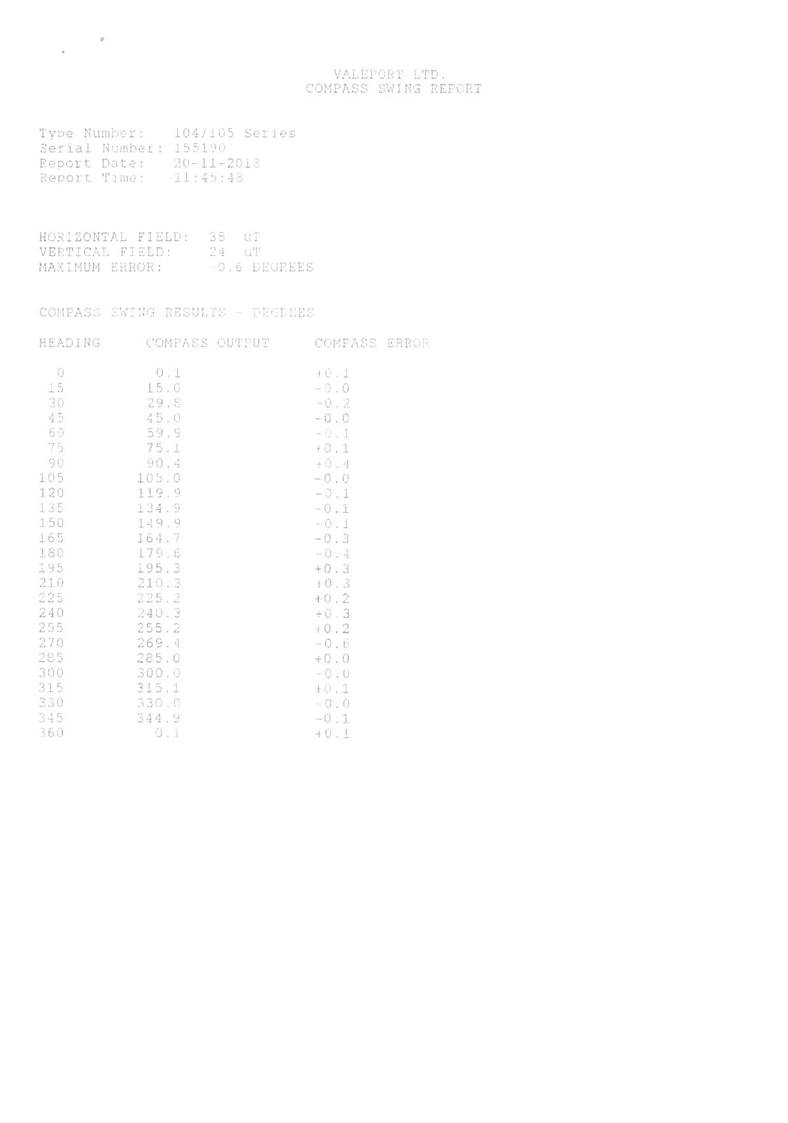
current meter, e.g. Valeport Current Meter Model 106 (Refer to https://www.indomultimeter.com/Pdf/Valeport-Model-106-Manual.pdf for Valeport Current
Meter Model 106 Manual). The calibration certificates are presented in Appendix
F.
Figure 2.1 Baseline water
quality monitoring locations under EM&A Manual
2.4.2.
Sampling
Frequency
The
measurements shall be taken at all designated monitoring stations including
control stations, once per day for a minimum of 3 days per week for 4 weeks
prior to the commencement of the construction works. Measurements shall be
taken at each station at any time. The interval between two sets of monitoring
shall not be less than 36 hours. No construction activities were conducted in
the vicinity of the stations during the baseline water quality monitoring.
2.4.3.
Sampling Depths
& Replication
For
baseline water quality monitoring, each station was sampled and measurements/
water samples would be taken at three depths, 1 m below the sea surface,
mid-depth and 1 m above the seabed. For stations that are less than 3 m in
depth, only the mid depth sample shall be taken. For stations that are less
than 6 m in depth, only the surface and seabed sample shall be taken. For in
situ measurements, duplicate readings shall be made at each water depth at each
station. Duplicate water samples shall be collected at each water depth at each
station.
2.5.
MAINTENANCE AND CALIBRATION
2.5.1.
The
multi-functional meters were checked and calibrated before use.
Multi-functional meters were certified by a laboratory accredited under HOKLAS
or any other international accreditation scheme, and subsequently re-calibrated
at monthly intervals throughout all stages of the water quality monitoring.
Responses of sensors and electrodes were checked with certified standard
solutions before each use.
2.5.2.
The calibration
certificates of monitoring equipment were presented in Appendix F.
2.5.3.
Sufficient
stocks of spare parts were provided and maintained for replacements when
necessary. Backup monitoring equipment was prepared for uninterrupted
monitoring during equipment maintenance or calibration during monitoring.
2.6.
RESULTS AND OBSERVATIONS
2.6.1.
The baseline marine water quality monitoring was conducted
from 12 May 2020 to 6 Jun 2020 at all thirteen monitoring
stations. The monitoring
results are summarized in Table 2.4.
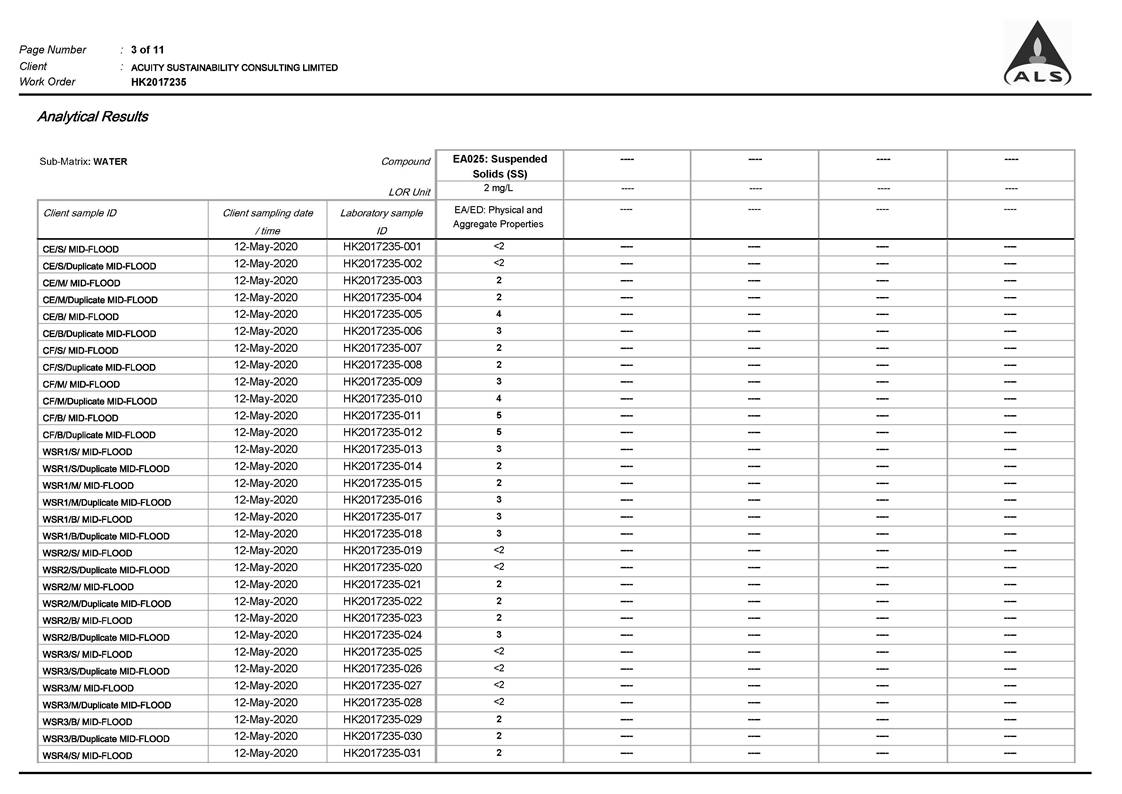
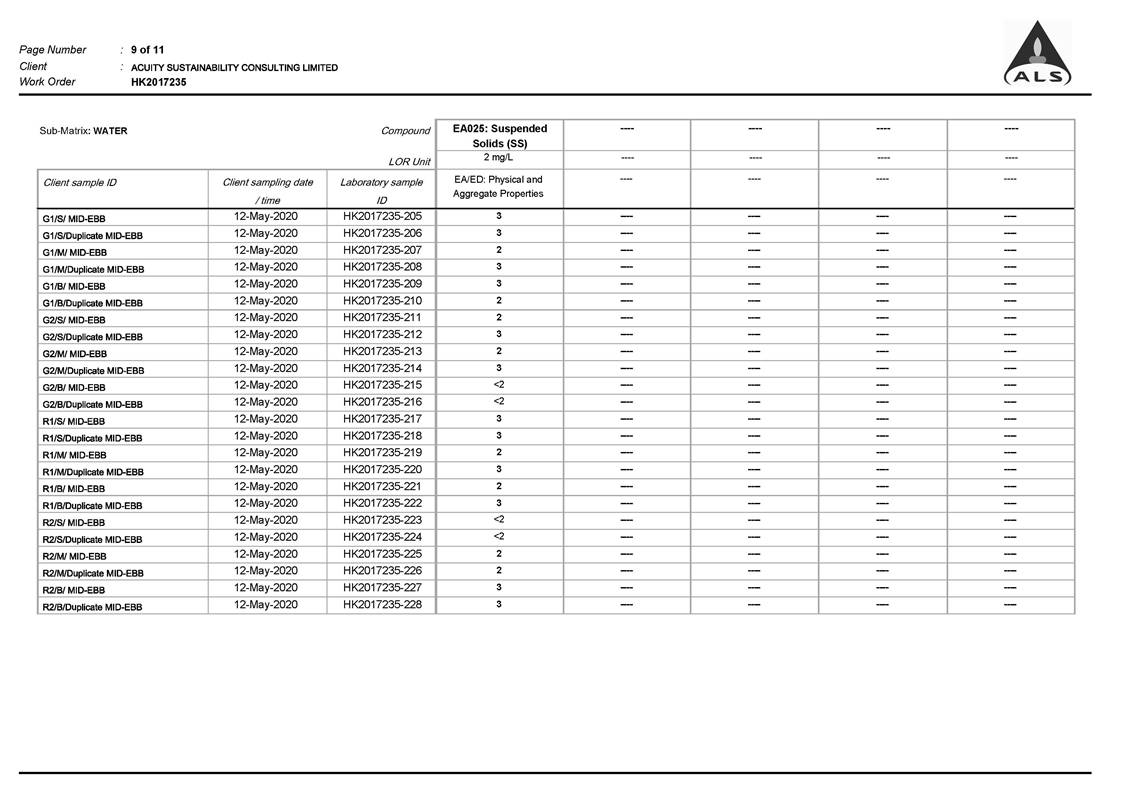
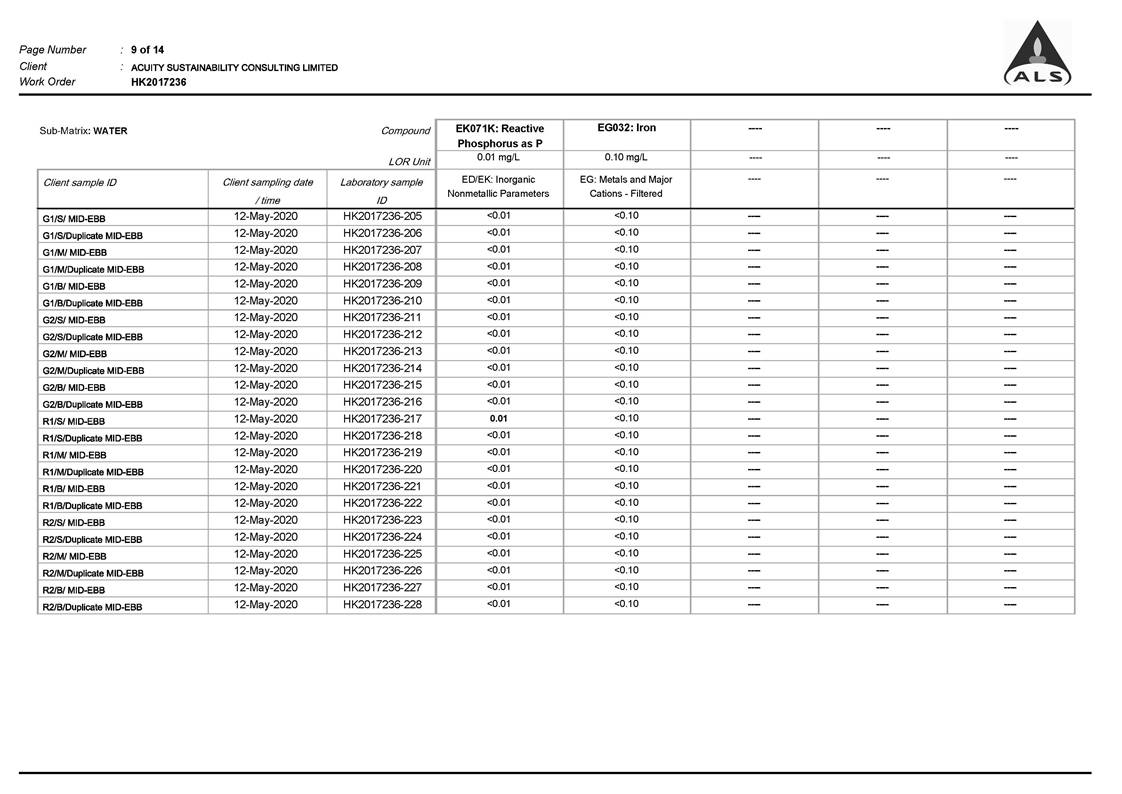
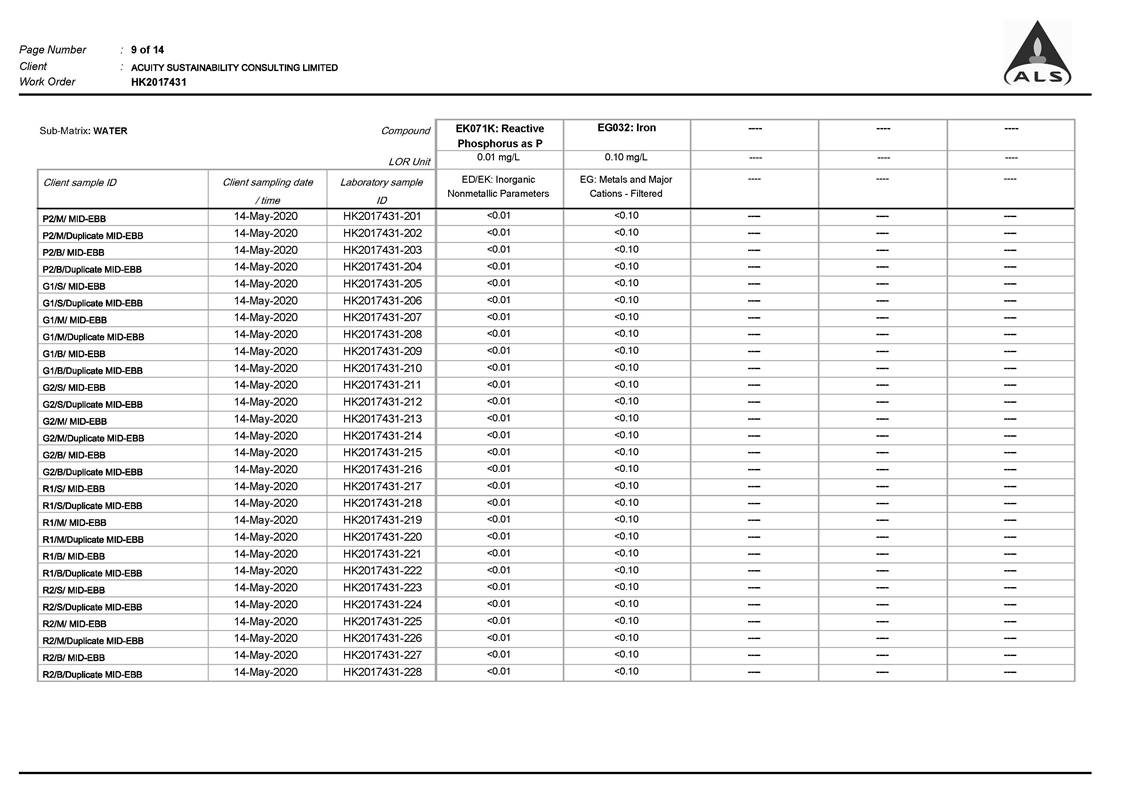
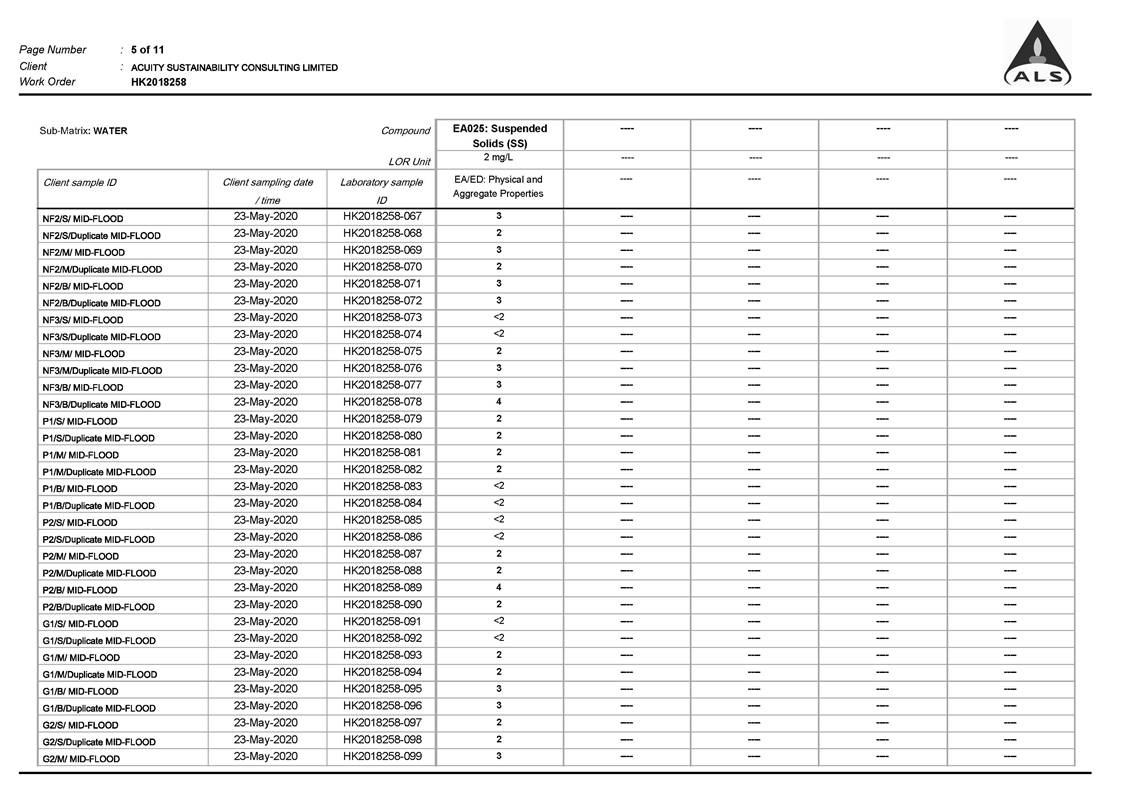
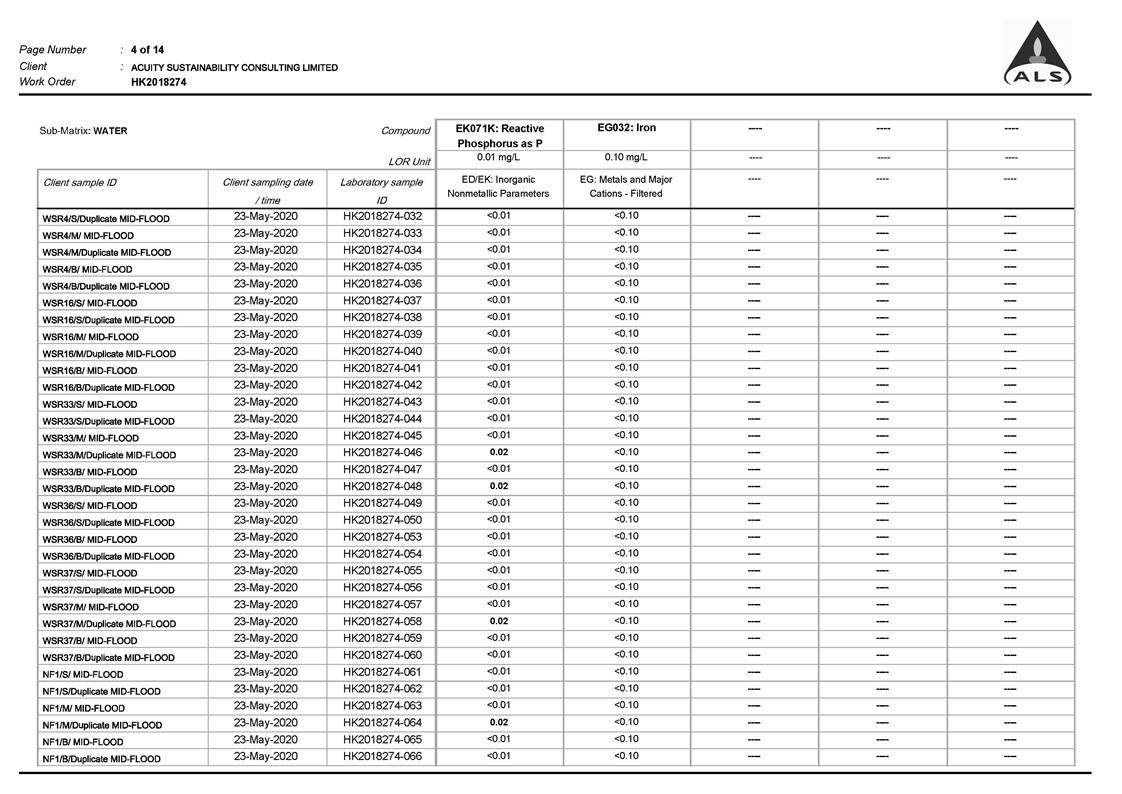
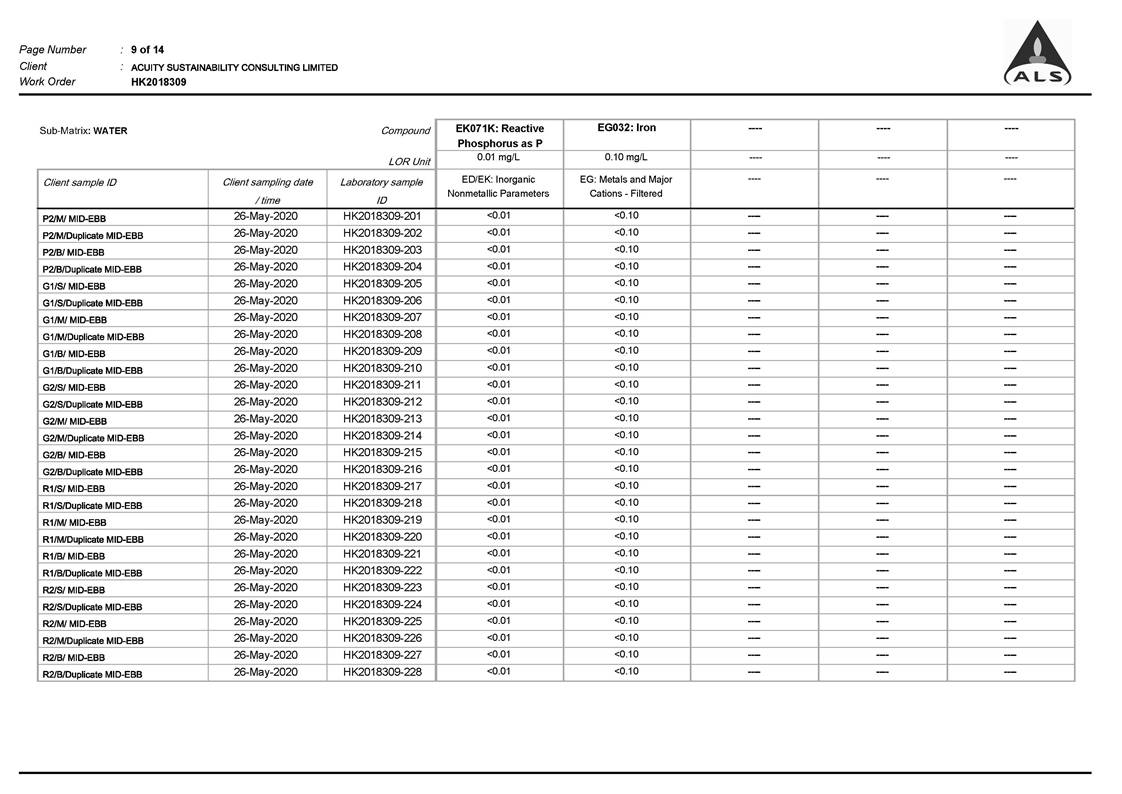
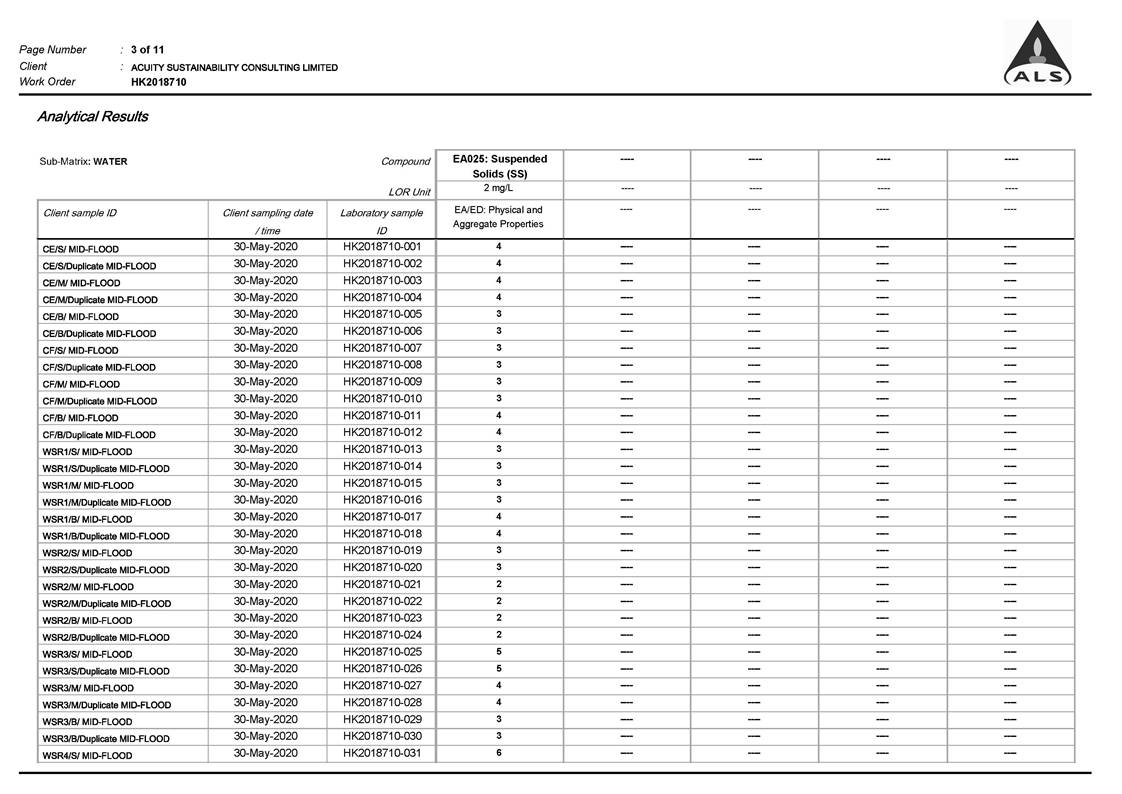
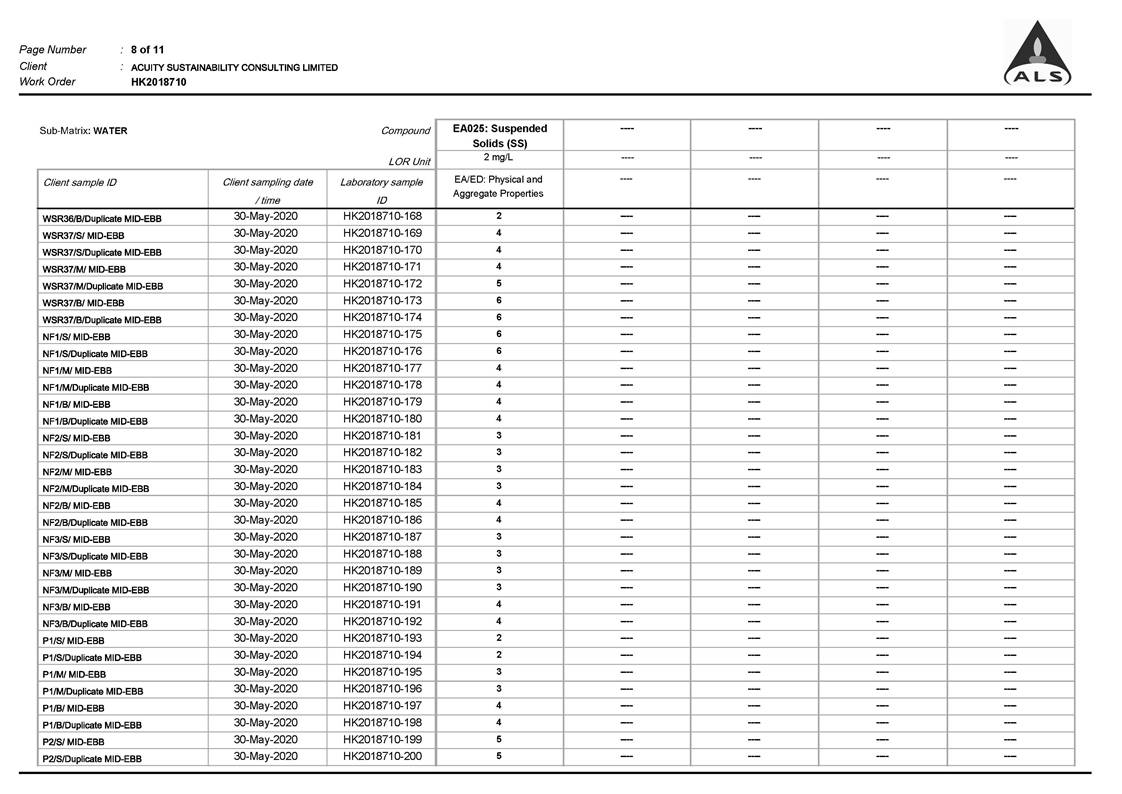
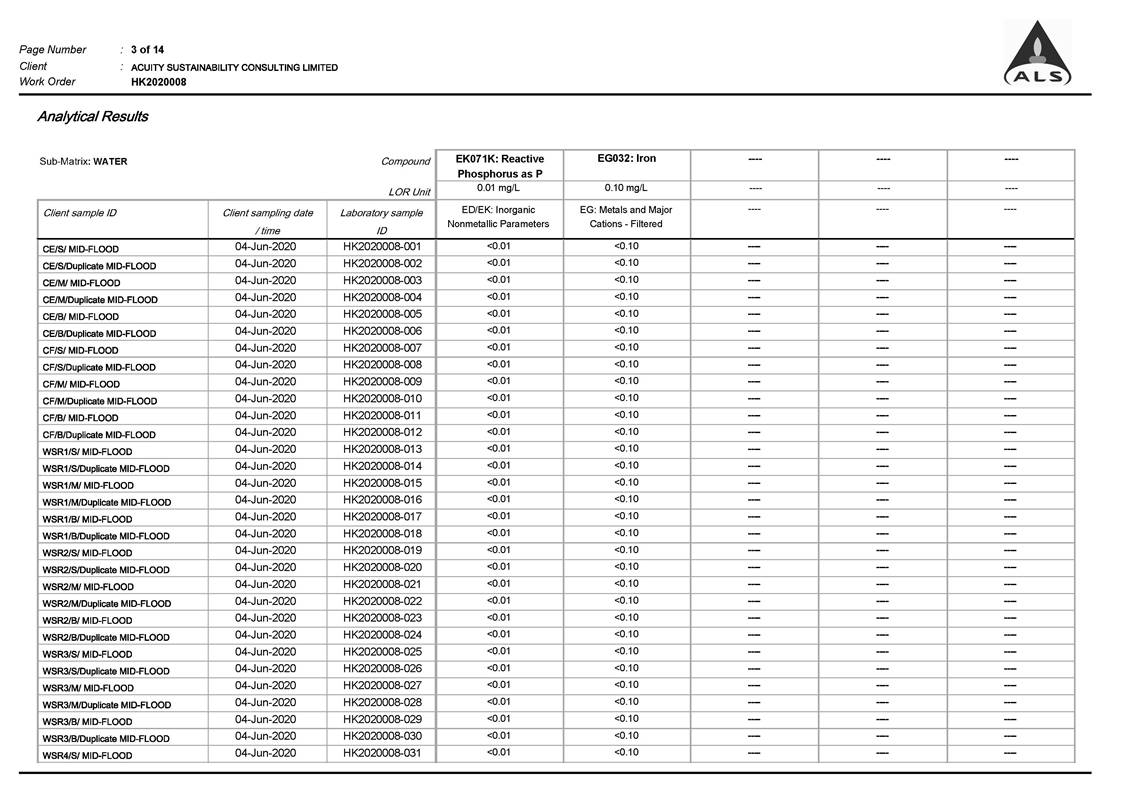
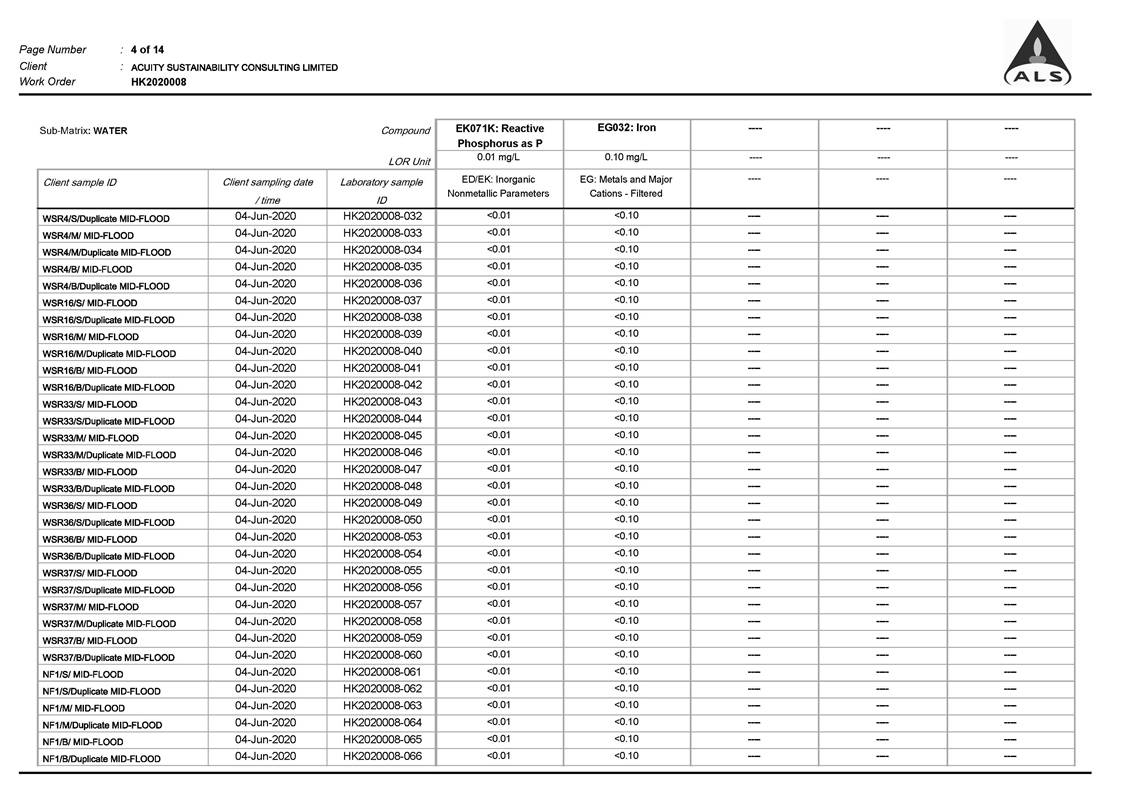
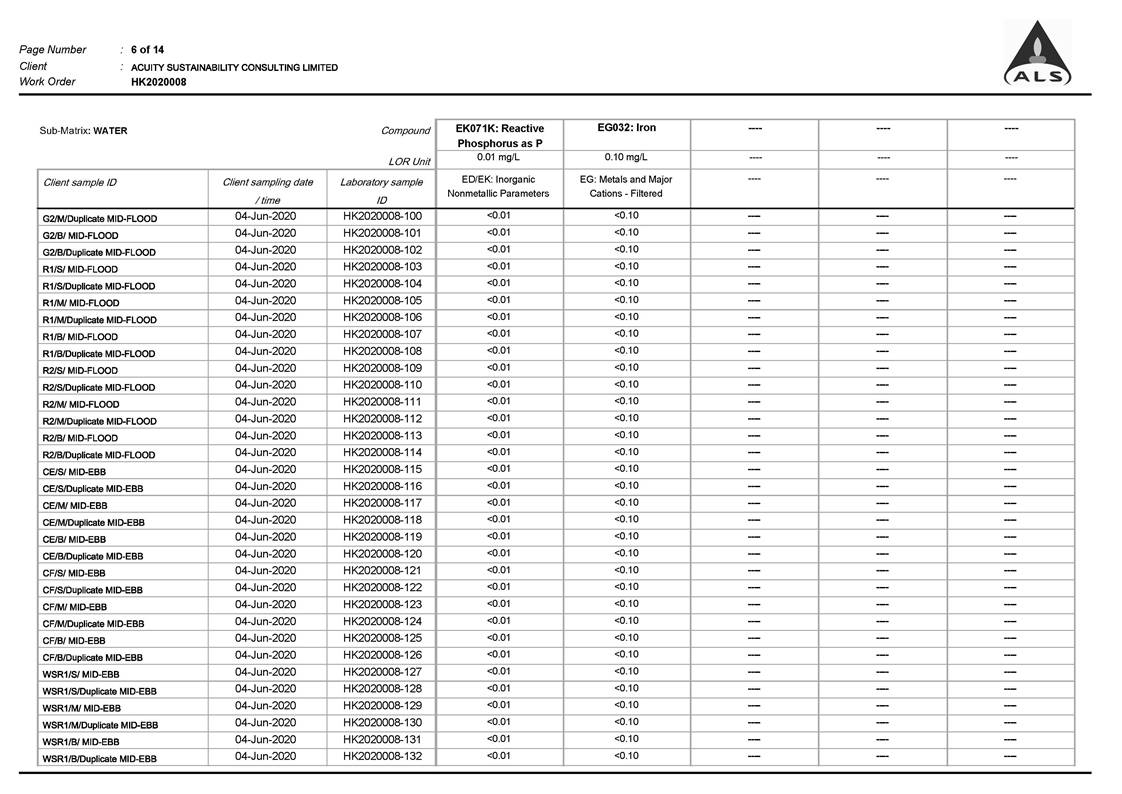
Details of water quality monitoring results are presented in Appendix D.
2.6.2.
The
weather conditions during the monitoring period were mainly sunny and cloudy.
Sea conditions for the majority of monitoring days were either slight, calm or
moderate. The data of 30 May 2020 and 6 June 2020 were collected under heavy
rain. The data measured and sampled on 6 June 2020 were not used as baseline
reference as agreed with the IEC. No construction activity, major pollution
source and extreme weather, except 6 June 2020, which might affect the results
were observed during the baseline water quality monitoring.
2.6.3.
There
is no significant difference between control and impact stations for the
parameters monitored.
2.6.4.
As
the southern water is affected by seasonal changes, the baseline water quality
monitoring has not taken into account the seasonal variations for determination
of Action and Limit Level for WQM. Therefore, during the future impact
monitoring, the water quality monitoring results at the control points shall
serve as a reference to determine if any elevated concentration of the
monitored parameter is due to seasonal variation or project contribution.
Revision on derivation criteria of the Action and Limit Level for WQM has
therefore been made as specified in Table 2.6 of the report.
Table 2.4 Summary
of Baseline Water Quality Monitoring Results
|
Location
|
Parameters
|
|
Salinity (ppt)
|
Dissolved Oxygen
(mg/L) note i
|
pH
|
Turbidity (NTU)
|
Suspended solids (mg/L)
|
Temperature (�XC)
|
Iron (mg/L)
|
|
Surface & Middle
|
Bottom
|
|
CE
|
Avg.
|
31.40
|
8.61
|
8.70
|
8.24
|
1.6
|
3.32
|
26.9
|
<
0.10
|
|
Min.
|
28.85
|
5.75
|
5.00
|
7.99
|
0.5
|
2.00
|
24.7
|
< 0.10
|
|
Max.
|
33.29
|
10.02
|
10.85
|
8.75
|
4.7
|
13.00
|
29.2
|
< 0.10
|
|
CF
|
Avg.
|
31.39
|
8.71
|
8.71
|
8.24
|
1.6
|
3.53
|
27.0
|
<
0.10
|
|
Min.
|
29.75
|
6.71
|
6.90
|
8.01
|
0.7
|
2.00
|
24.6
|
<
0.10
|
|
Max.
|
32.75
|
10.34
|
10.39
|
8.79
|
2.7
|
12.00
|
29.2
|
<
0.10
|
|
WSR1
|
Avg.
|
31.41
|
8.83
|
8.76
|
8.24
|
1.5
|
3.53
|
27.1
|
<
0.10
|
|
Min.
|
29.71
|
6.96
|
7.00
|
8.00
|
0.8
|
2.00
|
25.1
|
<
0.10
|
|
Max.
|
32.81
|
10.31
|
10.17
|
8.79
|
2.9
|
13.00
|
29.4
|
<
0.10
|
|
WSR2
|
Avg.
|
31.44
|
8.72
|
8.68
|
8.24
|
1.5
|
3.55
|
27.1
|
<
0.10
|
|
Min.
|
29.76
|
6.89
|
6.70
|
8.01
|
0.8
|
2.00
|
25.2
|
<
0.10
|
|
Max.
|
32.93
|
10.31
|
10.19
|
8.74
|
2.7
|
12.00
|
29.3
|
<
0.10
|
|
WSR3
|
Avg.
|
31.45
|
8.66
|
8.62
|
8.27
|
1.5
|
3.69
|
27.0
|
<
0.10
|
|
Min.
|
29.65
|
6.34
|
5.73
|
8.01
|
0.3
|
2.00
|
25.1
|
<
0.10
|
|
Max.
|
34.00
|
10.19
|
9.90
|
8.81
|
4.1
|
14.00
|
29.3
|
<
0.10
|
|
WSR4
|
Avg.
|
31.41
|
8.84
|
8.71
|
8.26
|
1.6
|
3.46
|
27.1
|
<
0.10
|
|
Min.
|
29.15
|
7.22
|
6.96
|
8.01
|
0.5
|
2.00
|
25.0
|
<
0.10
|
|
Max.
|
34.22
|
11.34
|
10.18
|
8.83
|
4.2
|
14.00
|
29.3
|
<
0.10
|
|
WSR16
|
Avg.
|
31.42
|
8.79
|
8.81
|
8.24
|
1.6
|
3.42
|
27.0
|
<
0.10
|
|
Min.
|
30.04
|
6.72
|
6.82
|
8.01
|
0.7
|
2.00
|
24.9
|
<
0.10
|
|
Max.
|
32.96
|
10.38
|
9.99
|
8.80
|
2.8
|
12.00
|
29.2
|
<
0.10
|
|
WSR33
|
Avg.
|
31.36
|
8.90
|
8.84
|
8.25
|
1.5
|
3.44
|
27.1
|
<
0.10
|
|
Min.
|
28.70
|
6.35
|
6.45
|
8.00
|
0.5
|
2.00
|
25.0
|
<
0.10
|
|
Max.
|
33.52
|
11.44
|
10.76
|
9.17
|
4.5
|
11.00
|
29.4
|
<
0.10
|
|
WSR36
|
Avg.
|
31.37
|
8.68
|
8.68
|
8.25
|
1.5
|
3.43
|
27.1
|
<
0.10
|
|
Min.
|
27.88
|
6.13
|
6.59
|
8.01
|
0.5
|
2.00
|
24.9
|
<
0.10
|
|
Max.
|
33.57
|
10.42
|
10.55
|
8.87
|
2.8
|
14.00
|
29.4
|
<
0.10
|
|
WSR37
|
Avg.
|
31.49
|
8.72
|
8.71
|
8.25
|
1.5
|
3.29
|
27.1
|
<
0.10
|
|
Min.
|
29.80
|
5.86
|
6.22
|
8.01
|
0.2
|
2.00
|
24.9
|
<
0.10
|
|
Max.
|
32.91
|
10.06
|
10.25
|
8.93
|
3.2
|
10.00
|
29.2
|
<
0.10
|
|
NF1
|
Avg.
|
31.48
|
8.76
|
8.93
|
8.24
|
1.5
|
3.35
|
27.0
|
<
0.10
|
|
Min.
|
29.89
|
6.64
|
6.87
|
8.01
|
0.5
|
2.00
|
24.4
|
< 0.10
|
|
Max.
|
33.78
|
10.44
|
11.30
|
9.00
|
4.3
|
11.00
|
29.2
|
< 0.10
|
|
NF2
|
Avg.
|
31.46
|
8.81
|
8.73
|
8.26
|
1.5
|
3.34
|
27.1
|
<
0.10
|
|
Min.
|
29.75
|
6.74
|
6.38
|
8.01
|
0.4
|
2.00
|
25.2
|
<
0.10
|
|
Max.
|
33.58
|
12.07
|
10.56
|
8.97
|
2.8
|
10.00
|
29.3
|
<
0.10
|
|
Location
|
Parameters
|
|
Salinity (ppt)
|
Dissolved
Oxygen (mg/L)
note
i
|
pH
|
Turbidity (NTU)
|
Suspended solids (mg/L)
|
Temperature (�XC)
|
Iron (mg/L)
|
|
Surface & Middle
|
Bottom
|
|
NF3
|
Avg.
|
31.46
|
8.83
|
8.85
|
8.25
|
1.5
|
3.22
|
27.1
|
<
0.10
|
|
Min.
|
29.62
|
6.87
|
6.99
|
8.01
|
0.4
|
2.00
|
25.1
|
<
0.10
|
|
Max.
|
34.10
|
11.89
|
12.63
|
8.83
|
2.9
|
10.00
|
29.3
|
< 0.10
|
Notes:
i.
"Avg",
��Min�� and ��Max�� is the average, minimum and maximum respectively of the data
from measurements conducted under mid- flood and mid-ebb tides at three water
depths, except that of DO where the data for ��Surface & Middle�� and
��Bottom�� are calculated separately.
2.7.
ACTION AND LIMIT LEVELS
2.7.1.
The Action and
Limit Levels have been set based on the derivation criteria specified in the
EM&A Manual as shown in Table 2.5 below.
Table 2.5 Criteria
of Action and Limit Levels for Water Quality
|
Parameters
|
Action
|
Limit
|
|
Construction Phase Impact Monitoring
|
|
DO in mg/L
|
Surface and Middle
5%-ile of baseline data for surface and middle
layer
Bottom
5%-ile of baseline data for bottom layers
Tung Lung Chau Fish Culture Zone
5.1 mgL-1 or level at control station (whichever the
lower)
|
Surface and Middle 4 mg L-1
Bottom 2 mg L-1
Tung Lung Chau Fish Culture Zone
5.0 mgL-1 or level at control station (whichever the lower)
|
|
SS in mg/L (Depth- averaged)
|
≥ 95 %-ile of baseline data or 20% exceedance
of value at any impact station compared with corresponding data from control
station
|
≥ 99 %-ile of baseline data or 30% exceedance
of value at any impact station compared with corresponding data from control
station
|
|
Turbidity in NTU (Depth-averaged)
|
≥ 95 %-ile of baseline data or 20% exceedance
of value at any impact station compared with corresponding data from control
station
|
≥ 99 %-ile of baseline data or 30% exceedance
of value at any impact station compared with corresponding data from control
station
|
|
First-year Operation Phase Monitoring
|
|
DO in mg/L
|
Surface and Middle
5%-ile of baseline data for surface and middle
layer
Bottom
5%-ile of baseline data for bottom layers
Tung Lung Chau Fish Culture Zone
5.1 mgL-1 or level at control station (whichever the lower)
|
Surface and Middle 4 mg L-1
Bottom 2 mg L-1
Tung Lung Chau Fish Culture Zone
5.0 mgL-1 or level at control station (whichever the
lower)
|
|
SS in mg/L (Depth- averaged)
|
≥ 95 %-ile of baseline data or 20% exceedance
of value at any impact station compared with corresponding data from control
station
|
≥ 99 %-ile of baseline data or 30% exceedance
of value at any impact station compared with corresponding data from control
station
|
|
Turbidity in NTU (Depth-averaged)
|
≥ 95 %-ile of baseline data or 20% exceedance
of value at any impact station compared with corresponding data from control
station
|
≥ 99 %-ile of baseline data or 30% exceedance
of value at any impact station compared with corresponding data from control
station
|
|
Salinity in PSU (Depth-averaged)
|
109% of baseline level or 9% exceedance of
value at any impact station compared with corresponding data from control
station
|
110% of baseline level or 10% exceedance of
value at any impact station compared with corresponding data from control
station
|
|
Iron in mg/L (Depth-averaged)
|
0.3 mgL-1
|
0.3 mgL-1
|
2.7.2.
Based on the
baseline water quality monitoring data and the derivation criteria specified
above, the Action/Limit Levels have been derived and are presented in Table 2.6.
Table 2.6 Derived
Action and Limit Levels for Water Quality
|
Parameters
|
Action
|
Limit
|
|
|
Construction Phase Impact Monitoring
|
|
|
DO in mg/L
|
Surface and Middle
7.30
mg L-1 Bottom
7.31
mg L-1
Tung Lung Chau Fish Culture Zone
5.1 mgL-1 or level at control station (whichever the
lower)
|
Surface and Middle 4 mg L-1
Bottom 2 mg L-1
Tung Lung Chau Fish Culture Zone
5.0 mgL-1 or level at control station (whichever the
lower)
|
|
|
SS in mg/L (Depth-averaged)
|
5.00
mg L-1 or 20% exceedance of value at
any impact station compared with corresponding data
from control station
|
6.00
mg L-1 or 30% exceedance of value at
any impact station compared with corresponding
data from control station
|
|
|
Turbidity in NTU (Depth-averaged)
|
2.41 NTU or 20% exceedance of
value at any impact station compared with corresponding data
from control station
|
2.84 NTU or 30% exceedance of
value at any impact station compared with corresponding
data from control station
|
|
|
First-year Operation Phase Monitoring iv
|
|
|
DO in mg/L
|
Surface and Middle
7.30
mg L-1 Bottom
7.31
mg L-1
Tung Lung Chau Fish Culture Zone
5.1 mgL-1 or level at control station (whichever the
lower)
|
Surface and Middle 4 mg L-1
Bottom 2 mg L-1
Tung Lung Chau Fish Culture Zone
5.0 mgL-1 or level at control station (whichever the
lower)
|
|
|
SS in mg/L (Depth-averaged)
|
5.00
mg L-1 or 20% exceedance of value at
any impact station compared with corresponding data from control station
|
6.00
mg L-1 or 30% exceedance of value at
any impact station compared with corresponding data from control station
|
|
|
Turbidity in NTU (Depth-averaged)
|
2.41 NTU or 20% exceedance of value
at any impact station compared with corresponding data from control station
|
2.84 NTU or 30% exceedance of
value at any impact station compared with corresponding data from control
station
|
|
Salinity in PSU (Depth-averaged)
|
34.28 PSU or 9% exceedance of
value at any impact station compared with corresponding data
from control station
|
34.60 PSU or 10% exceedance of
value at any impact station compared with corresponding
data from control station
|
|
Iron in mg/L (Depth-averaged)
|
0.3 mgL-1
|
0.3 mgL-1
|
Notes:
i.
"Depth-averaged"
is calculated by taking the arithmetic means of reading of all three depths.
ii.
For
DO, non-compliance of the water quality limits occurs when monitoring result is
lower than the limits.
iii.
For Turbidity, SS, iron and Salinity,
non-compliance of the water quality limits occurs when monitoring result is
higher than the limits.
iv.
For
the Action and Limit Levels adopted during First-year Operation Phase
Monitoring, further review would be made according to the EM&A Manual
during Operation Phase.
3.
CONCLUSION
3.1.
REVISION FOR INCLUSION
IN THE EM&A DOCUMENTS
3.1.1. The baseline environmental
monitoring was conducted according to the EM&A Manual. The monitoring methodology,
parameters monitored, and monitoring locations are all in line with the
EM&A Manual for the Project.
3.2.
WATER QUALITY
3.2.1.
Baseline
marine water quality monitoring was conducted between 12 May 2020 to 6 Jun 2020
at thirteen monitoring stations. All monitoring stations as specified in
EM&A Manual were accessible and thus there is no revision for inclusion in
the EM&A Manual.
3.2.2. No major pollution sources affecting
the water quality baseline monitoring at the thirteen monitoring stations were observed.
3.2.3. Action and Limit Levels were derived
based on the baseline water quality monitoring results according to the
EM&A Manual.
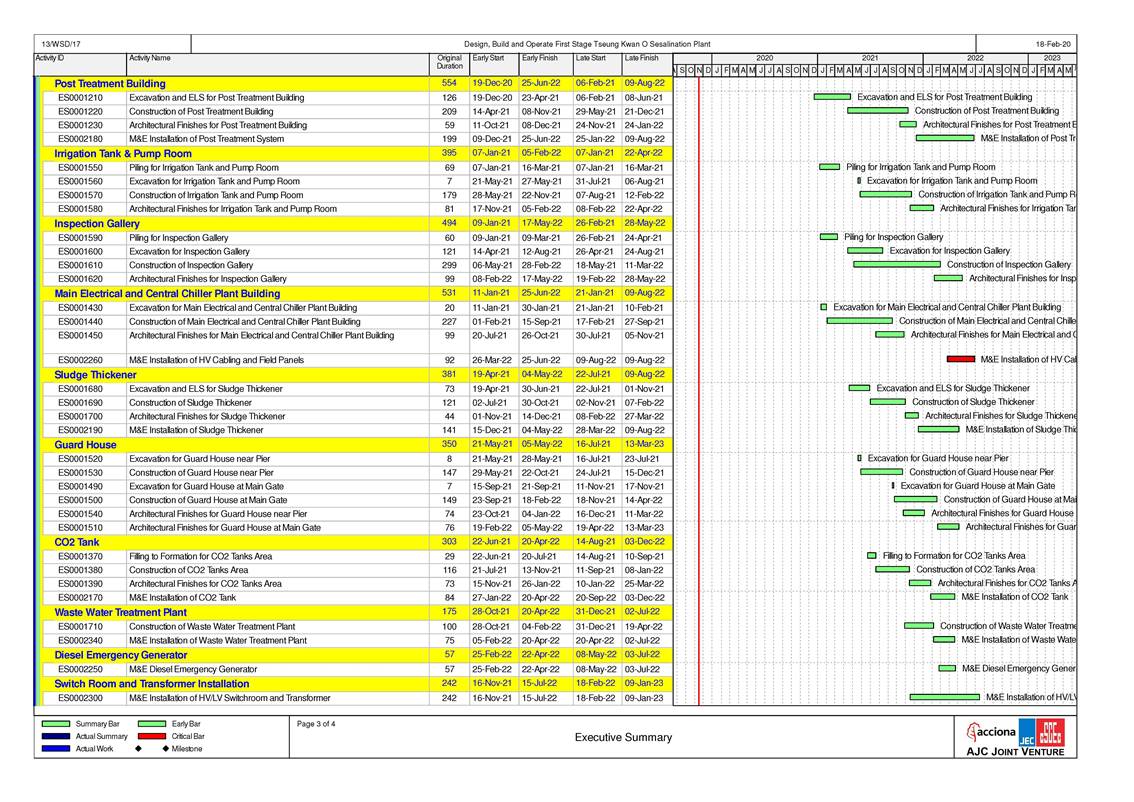
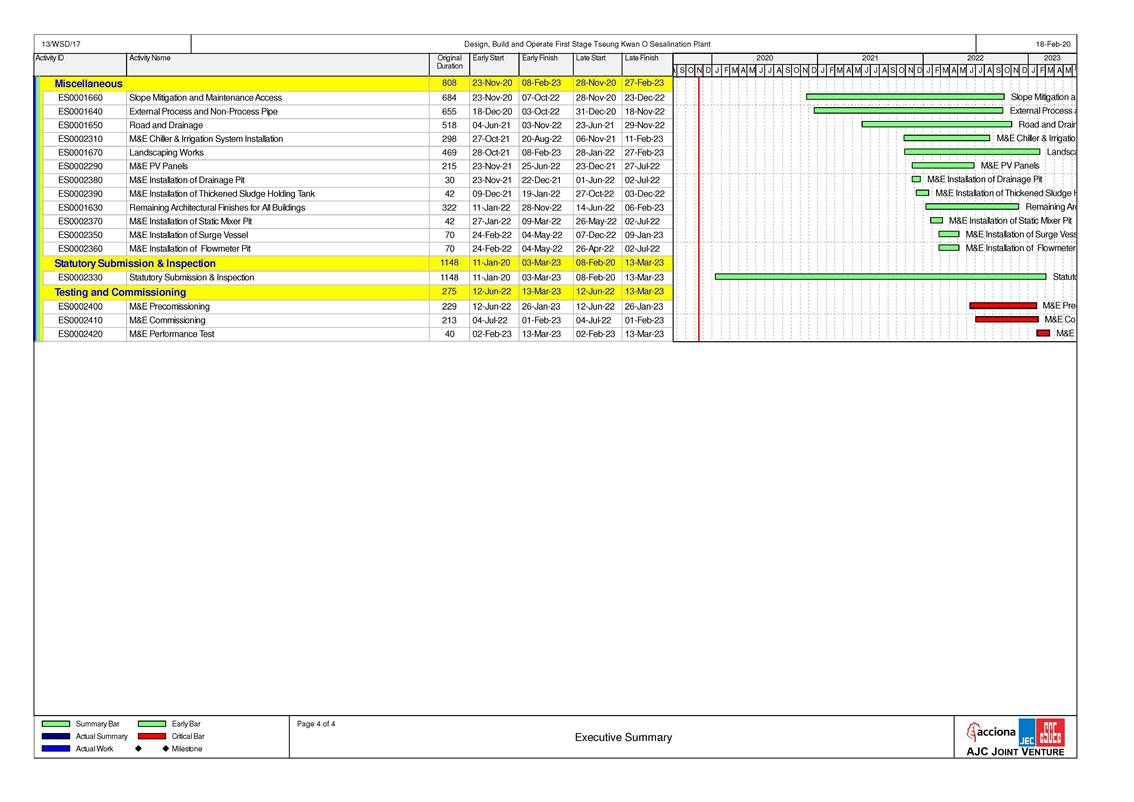
Appendix A
Master
Programme
Appendix B
Overview of Desalination Plant in Tseung Kwan O
Appendix C
Baseline Water
Quality Monitoring Schedule
|
Baseline Monitoring Schedule for DPTKO
|
|
May-20
|
|
Sun
|
Mon
|
Tue
|
Wed
|
Thu
|
Fri
|
Sat
|
|
|
|
|
|
|
1
|
2
|
|
|
|
|
|
|
|
|
|
3
|
4
|
5
|
6
|
7
|
8
|
9
|
|
|
|
|
|
|
|
|
|
10
|
11
|
12
|
13
|
14
|
15
|
16
|
|
|
|
Baseline
Water
Quality monitoring
at CE, CF, WSR1, WSR2, WSR3, WSR4, WSR16, WSR33, WSR36, WSR37,
NF1, NF2, NF3, P1, P2, G1, G2, R1 & R2
Tidal Period:
Ebb
Tide: 12:04 - 21:03
Flood Tide: 05:25 - 12:04 Monitoring Time:
Mid-ebb: 14:48 - 18:18
*
Mid-flood: 08:00 - 11:30
|
|
Baseline
Water
Quality monitoring
at CE, CF, WSR1, WSR2, WSR3, WSR4, WSR16, WSR33, WSR36, WSR37,
NF1, NF2, NF3, P1, P2, G1, G2, R1 & R2
Tidal Period:
Ebb Tide:
13:41 - 22:09
Flood Tide: 07:00 - 13:41 Monitoring Time:
Mid-ebb: 14:06 -
17:36
Mid-flood:
08:35 - 12:05
|
|
Baseline
Water
Quality monitoring
at CE, CF, WSR1, WSR2, WSR3, WSR4, WSR16, WSR33, WSR36, WSR37,
NF1, NF2, NF3, P1, P2, G1, G2, R1 & R2
Tidal Period:
Ebb
Tide: 07:12 - 11:00
Flood Tide: 11:00 - 16:12 Monitoring Time:
*# Mid-ebb: 08:00 - 11:00
Mid-flood:
11:51 - 15:21
|
|
17
|
18
|
19
|
20
|
21
|
22
|
23
|
|
|
|
Baseline
Water
Quality monitoring
at CE, CF, WSR1, WSR2, WSR3, WSR4, WSR16, WSR33, WSR36, WSR37,
NF1, NF2, NF3, P1, P2, G1, G2, R1 & R2
Tidal Period:
Ebb
Tide: 08:02 - 13:50
Flood Tide: 13:50 - 19:47 Monitoring Time:
Mid-ebb:
09:11 - 12:41
Mid-flood:
15:03 - 18:33
|
|
Baseline
Water
Quality monitoring
at CE, CF, WSR1, WSR2, WSR3, WSR4, WSR16, WSR33, WSR36, WSR37,
NF1, NF2, NF3, P1, P2, G1, G2, R1 & R2
Tidal Period:
Ebb
Tide: 08:33 - 15:03
Flood Tide: 15:03 - 21:22 Monitoring Time:
Mid-ebb:
10:03 - 13:33
Mid-flood:
15:21 - 18:51
|
|
Baseline
Water
Quality monitoring
at CE, CF, WSR1, WSR2, WSR3, WSR4, WSR16, WSR33, WSR36, WSR37,
NF1, NF2, NF3, P1, P2, G1, G2, R1 & R2
Tidal Period:
Ebb
Tide: 09:12 - 16:18
Flood Tide: 16:18 - 22:47 Monitoring Time:
Mid-ebb:
11:00 - 14:30
&
Mid-flood: 16:20 - 19:00
|
|
24
|
25
|
26
|
27
|
28
|
29
|
29
|
|
|
|
Baseline
Water
Quality monitoring
at CE, CF, WSR1, WSR2, WSR3, WSR4, WSR16, WSR33, WSR36, WSR37,
NF1, NF2, NF3, P1, P2, G1, G2, R1 & R2
Tidal Period:
Ebb
Tide: 11:00 - 18:28
Flood Tide: 03:44 - 11:00 Monitoring Time:
Mid-ebb: 12:59 - 16:29
* Mid-flood:
08:00 - 11:00
|
|
Baseline
Water
Quality monitoring
at CE, CF, WSR1, WSR2, WSR3, WSR4, WSR16, WSR33, WSR36, WSR37,
NF1, NF2, NF3, P1, P2, G1, G2, R1 & R2
Tidal Period:
Ebb
Tide: 11:29 - 20:21
Flood Tide: 04:41 - 11:29 Monitoring Time:
Mid-ebb: 14:10 - 17:40
*
Mid-flood: 08:00 - 11:30
|
|
Baseline
Water
Quality monitoring
at CE, CF, WSR1, WSR2, WSR3, WSR4, WSR16, WSR33, WSR36, WSR37,
NF1, NF2, NF3, P1, P2, G1, G2, R1 & R2
Tidal Period:
Ebb
Tide: 14:07 - 22:19
Flood Tide: 07:46 - 14:07 Monitoring Time:
Mid-ebb: 14:31 -
18:01
Mid-flood:
09:11 - 12:41
|
|
30
|
31
|
|
|
|
|
|
|
|
|
|
|
|
|
|
|
Note:
* - Due to safty
concern, Water Quality Monitoring would start at 0800.
&
- Due to safety concern for sampling event in night-time, Water Quality
Monitoring would end at 1900. # -
The difference of tidal range closest to 0.5m is selected
as far as practicable.
|
|
Baseline Monitoring Schedule for DPTKO
|
|
Jun-20
|
|
Sun
|
Mon
|
Tue
|
Wed
|
Thu
|
Fri
|
Sat
|
|
|
1
|
2
|
3
|
4
|
5
|
6
|
|
|
|
Baseline
Water
Quality monitoring
at CE, CF, WSR1, WSR2, WSR3, WSR4, WSR16, WSR33, WSR36, WSR37,
NF1, NF2, NF3, P1, P2, G1, G2, R1 & R2
Tidal Period:
Ebb
Tide: 06:52 - 12:03
Flood Tide: 12:33 - 19:00 Monitoring Time:
* Mid-ebb: 08:00 -
11:30
Mid-flood:
14:01 - 17:31
|
|
Baseline
Water
Quality monitoring
at CE, CF, WSR1, WSR2, WSR3, WSR4, WSR16, WSR33, WSR36, WSR37,
NF1, NF2, NF3, P1, P2, G1, G2, R1 & R2
Tidal Period:
Ebb
Tide: 07:52 - 14:00
Flood Tide: 14:00 - 21:16 Monitoring Time:
Mid-ebb: 09:11 -
12:41
Mid-flood:
14:21 - 17:51
|
|
Baseline
Water
Quality monitoring
at CE, CF, WSR1, WSR2, WSR3, WSR4, WSR16, WSR33, WSR36, WSR37,
NF1, NF2, NF3, P1, P2, G1, G2, R1 & R2
Tidal Period:
Ebb
Tide: 09:00 - 16:00
Flood Tide: 16:00 - 23:00 Monitoring Time:
Mid-ebb: 10:45 - 14:15
&
Mid-flood: 16:00 - 19:00
|
|
7
|
8
|
9
|
10
|
11
|
12
|
13
|
|
|
|
|
|
|
|
|
|
14
|
15
|
16
|
17
|
18
|
19
|
20
|
|
|
|
|
|
|
|
|
|
21
|
22
|
23
|
24
|
25
|
26
|
27
|
|
|
|
|
|
|
|
|
|
28
|
29
|
30
|
|
|
|
|
|
|
|
|
|
|
|
|
|
Note:
* - Due to safty concern,
Water Quality Monitoring would start at 0800.
&
- Due to safety concern for sampling event in night-time, Water Quality
Monitoring would end at 1900. # -
The difference of tidal range closest to 0.5m is selected
as far as practicable.
|
|
|
Appendix D
Baseline Water Quality Monitoring Data
|
Location
|
Date
|
Weather
|
Sea Condition
|
Tidal
|
Water Level
|
Depth (m)
|
Time
|
DO
(mg/L)
|
pH
|
Sal (ppt)
|
Temp (�XC)
|
Turbidty (NTU)
|
SS
(mg/L)
|
Iron (mg/L)
|
Current Velocity
(m/s)
|
Current Direction
(NSWE)
|
|
CE
|
20200512
|
Sunny
|
Moderate
|
Mid-Flood
|
Bottom
|
11.1
|
8:39
|
9.31
|
8.06
|
31.92
|
24.77
|
2.37
|
4
|
<0.10
|
0.175
|
NW
|
|
CE
|
20200512
|
Sunny
|
Moderate
|
Mid-Flood
|
Bottom
|
11.1
|
8:39
|
8.27
|
8.16
|
31.58
|
24.79
|
1.89
|
3
|
<0.10
|
0.177
|
NW
|
|
CE
|
20200512
|
Sunny
|
Moderate
|
Mid-Flood
|
Middle
|
6.05
|
8:40
|
8.3
|
8.15
|
31.27
|
24.73
|
2.51
|
2
|
<0.10
|
0.186
|
NW
|
|
CE
|
20200512
|
Sunny
|
Moderate
|
Mid-Flood
|
Middle
|
6.05
|
8:40
|
8.19
|
8.24
|
31.45
|
24.73
|
2.37
|
2
|
<0.10
|
0.18
|
NW
|
|
CE
|
20200512
|
Sunny
|
Moderate
|
Mid-Flood
|
Surface
|
1
|
8:41
|
7.8
|
8.14
|
31.38
|
24.91
|
2.23
|
<2
|
<0.10
|
0.204
|
NW
|
|
CE
|
20200512
|
Sunny
|
Moderate
|
Mid-Flood
|
Surface
|
1
|
8:41
|
9.21
|
8.24
|
31.6
|
24.76
|
2.11
|
<2
|
<0.10
|
0.175
|
N
|
|
CF
|
20200512
|
Sunny
|
Moderate
|
Mid-Flood
|
Bottom
|
11.3
|
8:03
|
8.13
|
8.18
|
31.74
|
24.86
|
2.01
|
5
|
<0.10
|
0.195
|
SW
|
|
CF
|
20200512
|
Sunny
|
Moderate
|
Mid-Flood
|
Bottom
|
11.3
|
8:03
|
8.49
|
8.01
|
31.39
|
24.74
|
1.54
|
5
|
<0.10
|
0.138
|
SW
|
|
CF
|
20200512
|
Sunny
|
Moderate
|
Mid-Flood
|
Middle
|
6.15
|
8:04
|
9.11
|
8.15
|
31.16
|
24.66
|
2.41
|
3
|
<0.10
|
0.135
|
W
|
|
CF
|
20200512
|
Sunny
|
Moderate
|
Mid-Flood
|
Middle
|
6.15
|
8:04
|
8.59
|
8.1
|
31.5
|
24.61
|
2.54
|
4
|
<0.10
|
0.154
|
NW
|
|
CF
|
20200512
|
Sunny
|
Moderate
|
Mid-Flood
|
Surface
|
1
|
8:05
|
9.42
|
8.06
|
31.25
|
24.72
|
2.17
|
2
|
<0.10
|
0.164
|
W
|
|
CF
|
20200512
|
Sunny
|
Moderate
|
Mid-Flood
|
Surface
|
1
|
8:05
|
7.56
|
8.22
|
31.55
|
24.93
|
2.34
|
2
|
<0.10
|
0.189
|
W
|
|
NF1
|
20200512
|
Sunny
|
Moderate
|
Mid-Flood
|
Bottom
|
7.2
|
9:21
|
8.86
|
8.2
|
31.77
|
25.22
|
1.38
|
2
|
<0.10
|
0.158
|
SW
|
|
NF1
|
20200512
|
Sunny
|
Moderate
|
Mid-Flood
|
Bottom
|
7.2
|
9:21
|
8.2
|
8.04
|
31.1
|
25.22
|
1.66
|
2
|
<0.10
|
0.13
|
W
|
|
NF1
|
20200512
|
Sunny
|
Moderate
|
Mid-Flood
|
Middle
|
4.1
|
9:22
|
8.37
|
8.13
|
31.89
|
24.99
|
1.59
|
2
|
<0.10
|
0.156
|
W
|
|
NF1
|
20200512
|
Sunny
|
Moderate
|
Mid-Flood
|
Middle
|
4.1
|
9:22
|
9.62
|
8.24
|
31.71
|
25.05
|
1.72
|
3
|
<0.10
|
0.13
|
W
|
|
NF1
|
20200512
|
Sunny
|
Moderate
|
Mid-Flood
|
Surface
|
1
|
9:23
|
9.23
|
8.23
|
31.59
|
25.02
|
2.53
|
3
|
<0.10
|
0.185
|
NW
|
|
NF1
|
20200512
|
Sunny
|
Moderate
|
Mid-Flood
|
Surface
|
1
|
9:23
|
9.42
|
8.01
|
31.6
|
25.07
|
1.96
|
2
|
<0.10
|
0.176
|
W
|
|
NF2
|
20200512
|
Sunny
|
Moderate
|
Mid-Flood
|
Bottom
|
3.9
|
10:50
|
8.17
|
8.08
|
31.59
|
25.33
|
1.86
|
4
|
<0.10
|
0.144
|
NW
|
|
NF2
|
20200512
|
Sunny
|
Moderate
|
Mid-Flood
|
Bottom
|
3.9
|
10:50
|
7.73
|
8.1
|
31.46
|
25.3
|
1.92
|
5
|
<0.10
|
0.19
|
W
|
|
NF2
|
20200512
|
Sunny
|
Moderate
|
Mid-Flood
|
Surface
|
1
|
10:52
|
8.88
|
8.25
|
31.76
|
25.25
|
2.23
|
2
|
<0.10
|
0.14
|
W
|
|
NF2
|
20200512
|
Sunny
|
Moderate
|
Mid-Flood
|
Surface
|
1
|
10:52
|
9
|
8.23
|
31.51
|
25.23
|
1.69
|
2
|
<0.10
|
0.184
|
NW
|
|
NF3
|
20200512
|
Sunny
|
Moderate
|
Mid-Flood
|
Bottom
|
11.5
|
10:58
|
8.42
|
8.24
|
31.32
|
25.37
|
1.64
|
4
|
<0.10
|
0.165
|
NW
|
|
NF3
|
20200512
|
Sunny
|
Moderate
|
Mid-Flood
|
Bottom
|
11.5
|
10:58
|
7.93
|
8.24
|
32.05
|
25.34
|
1.82
|
3
|
<0.10
|
0.147
|
W
|
|
NF3
|
20200512
|
Sunny
|
Moderate
|
Mid-Flood
|
Middle
|
6.25
|
10:59
|
8.02
|
8.23
|
31.98
|
25.43
|
2.08
|
3
|
<0.10
|
0.14
|
W
|
|
NF3
|
20200512
|
Sunny
|
Moderate
|
Mid-Flood
|
Middle
|
6.25
|
10:59
|
8.11
|
8.24
|
31.99
|
25.38
|
1.71
|
3
|
<0.10
|
0.138
|
SW
|
|
NF3
|
20200512
|
Sunny
|
Moderate
|
Mid-Flood
|
Surface
|
1
|
11:00
|
9.18
|
8.2
|
32.33
|
25.72
|
2.4
|
2
|
<0.10
|
0.142
|
W
|
|
NF3
|
20200512
|
Sunny
|
Moderate
|
Mid-Flood
|
Surface
|
1
|
11:00
|
8.69
|
8.22
|
31.55
|
25.62
|
2.24
|
2
|
<0.10
|
0.176
|
W
|
|
WSR01
|
20200512
|
Sunny
|
Moderate
|
Mid-Flood
|
Bottom
|
9.7
|
11:06
|
8.27
|
8.24
|
31.12
|
25.53
|
1.75
|
3
|
<0.10
|
0.179
|
W
|
|
WSR01
|
20200512
|
Sunny
|
Moderate
|
Mid-Flood
|
Bottom
|
9.7
|
11:06
|
9.35
|
8.08
|
31.22
|
25.68
|
1.54
|
3
|
<0.10
|
0.172
|
W
|
|
WSR01
|
20200512
|
Sunny
|
Moderate
|
Mid-Flood
|
Middle
|
5.35
|
11:07
|
9.39
|
8.14
|
31.83
|
25.6
|
1.42
|
2
|
<0.10
|
0.196
|
NW
|
|
WSR01
|
20200512
|
Sunny
|
Moderate
|
Mid-Flood
|
Middle
|
5.35
|
11:07
|
8.08
|
8.16
|
31.68
|
25.81
|
2.03
|
3
|
<0.10
|
0.177
|
W
|
|
WSR01
|
20200512
|
Sunny
|
Moderate
|
Mid-Flood
|
Surface
|
1
|
11:08
|
9.23
|
8.18
|
31.85
|
25.6
|
2.27
|
3
|
<0.10
|
0.18
|
W
|
|
WSR01
|
20200512
|
Sunny
|
Moderate
|
Mid-Flood
|
Surface
|
1
|
11:08
|
8.3
|
8.07
|
31.54
|
25.68
|
1.95
|
2
|
<0.10
|
0.173
|
SW
|
|
WSR02
|
20200512
|
Sunny
|
Moderate
|
Mid-Flood
|
Bottom
|
6.7
|
10:38
|
9.1
|
8.02
|
31.8
|
25.47
|
1.28
|
2
|
<0.10
|
0.149
|
W
|
|
WSR02
|
20200512
|
Sunny
|
Moderate
|
Mid-Flood
|
Bottom
|
6.7
|
10:38
|
8.64
|
8.18
|
31.25
|
25.52
|
1.49
|
3
|
<0.10
|
0.181
|
SW
|
|
WSR02
|
20200512
|
Sunny
|
Moderate
|
Mid-Flood
|
Middle
|
3.85
|
10:39
|
9.06
|
8.1
|
31.28
|
25.52
|
1.57
|
2
|
<0.10
|
0.147
|
W
|
|
WSR02
|
20200512
|
Sunny
|
Moderate
|
Mid-Flood
|
Middle
|
3.85
|
10:39
|
9.34
|
8.06
|
31.43
|
25.33
|
2.08
|
2
|
<0.10
|
0.173
|
W
|
|
WSR02
|
20200512
|
Sunny
|
Moderate
|
Mid-Flood
|
Surface
|
1
|
10:40
|
8.82
|
8.19
|
31.14
|
25.47
|
1.66
|
<2
|
<0.10
|
0.174
|
W
|
|
WSR02
|
20200512
|
Sunny
|
Moderate
|
Mid-Flood
|
Surface
|
1
|
10:40
|
9.53
|
8.02
|
31.09
|
25.29
|
2.34
|
<2
|
<0.10
|
0.191
|
W
|
|
WSR03
|
20200512
|
Sunny
|
Moderate
|
Mid-Flood
|
Bottom
|
10
|
10:34
|
9.26
|
8.11
|
31.14
|
25.22
|
1.64
|
2
|
<0.10
|
0.155
|
W
|
|
WSR03
|
20200512
|
Sunny
|
Moderate
|
Mid-Flood
|
Bottom
|
10
|
10:34
|
8.55
|
8.1
|
31.52
|
25.27
|
1.24
|
2
|
<0.10
|
0.193
|
SW
|
|
WSR03
|
20200512
|
Sunny
|
Moderate
|
Mid-Flood
|
Middle
|
5.5
|
10:35
|
8.9
|
8.24
|
31.17
|
25.24
|
1.46
|
<2
|
<0.10
|
0.186
|
W
|
|
WSR03
|
20200512
|
Sunny
|
Moderate
|
Mid-Flood
|
Middle
|
5.5
|
10:35
|
8.19
|
8.08
|
31.44
|
25.3
|
2.28
|
<2
|
<0.10
|
0.18
|
NW
|
|
WSR03
|
20200512
|
Sunny
|
Moderate
|
Mid-Flood
|
Surface
|
1
|
10:36
|
8.58
|
8.1
|
31.88
|
25.39
|
2.37
|
<2
|
<0.10
|
0.137
|
W
|
|
WSR03
|
20200512
|
Sunny
|
Moderate
|
Mid-Flood
|
Surface
|
1
|
10:36
|
8.38
|
8.15
|
31.23
|
25.34
|
2.41
|
<2
|
<0.10
|
0.162
|
NW
|
|
WSR04
|
20200512
|
Sunny
|
Moderate
|
Mid-Flood
|
Bottom
|
5.8
|
10:18
|
8.66
|
8.23
|
31.36
|
25.39
|
1.28
|
4
|
<0.10
|
0.173
|
W
|
|
WSR04
|
20200512
|
Sunny
|
Moderate
|
Mid-Flood
|
Bottom
|
5.8
|
10:18
|
7.56
|
8.19
|
31.37
|
25.3
|
1.26
|
5
|
<0.10
|
0.163
|
W
|
|
WSR04
|
20200512
|
Sunny
|
Moderate
|
Mid-Flood
|
Middle
|
3.4
|
10:19
|
8.23
|
8.16
|
31.25
|
25.33
|
1.63
|
3
|
<0.10
|
0.167
|
W
|
|
WSR04
|
20200512
|
Sunny
|
Moderate
|
Mid-Flood
|
Middle
|
3.4
|
10:19
|
8.55
|
8.15
|
31.64
|
25.27
|
1.87
|
3
|
<0.10
|
0.19
|
NW
|
|
WSR04
|
20200512
|
Sunny
|
Moderate
|
Mid-Flood
|
Surface
|
1
|
10:20
|
8.07
|
8.19
|
31.29
|
25.25
|
2.39
|
2
|
<0.10
|
0.165
|
W
|
|
WSR04
|
20200512
|
Sunny
|
Moderate
|
Mid-Flood
|
Surface
|
1
|
10:20
|
9.12
|
8.07
|
31.41
|
25.15
|
1.88
|
2
|
<0.10
|
0.189
|
SW
|
|
WSR16
|
20200512
|
Sunny
|
Moderate
|
Mid-Flood
|
Bottom
|
9.5
|
9:00
|
9.13
|
8.21
|
31.55
|
24.97
|
1.86
|
2
|
<0.10
|
0.161
|
NW
|
|
WSR16
|
20200512
|
Sunny
|
Moderate
|
Mid-Flood
|
Bottom
|
9.5
|
9:00
|
9.26
|
8.18
|
31.2
|
24.94
|
1.42
|
2
|
<0.10
|
0.21
|
NW
|
|
WSR16
|
20200512
|
Sunny
|
Moderate
|
Mid-Flood
|
Middle
|
5.25
|
9:01
|
8.92
|
8.01
|
31.42
|
24.98
|
1.66
|
3
|
<0.10
|
0.192
|
NW
|
|
WSR16
|
20200512
|
Sunny
|
Moderate
|
Mid-Flood
|
Middle
|
5.25
|
9:01
|
9.61
|
8.25
|
31.53
|
25.02
|
1.42
|
3
|
<0.10
|
0.183
|
NW
|
|
WSR16
|
20200512
|
Sunny
|
Moderate
|
Mid-Flood
|
Surface
|
1
|
9:02
|
8.5
|
8.14
|
31.53
|
25.03
|
2.46
|
3
|
<0.10
|
0.17
|
NW
|
|
WSR16
|
20200512
|
Sunny
|
Moderate
|
Mid-Flood
|
Surface
|
1
|
9:02
|
8.79
|
8.05
|
31.68
|
25.06
|
2.36
|
3
|
<0.10
|
0.16
|
NW
|
|
WSR33
|
20200512
|
Sunny
|
Moderate
|
Mid-Flood
|
Bottom
|
8.3
|
10:02
|
8.8
|
8.06
|
31.4
|
25.04
|
1.8
|
4
|
<0.10
|
0.147
|
W
|
|
WSR33
|
20200512
|
Sunny
|
Moderate
|
Mid-Flood
|
Bottom
|
8.3
|
10:02
|
8.6
|
8.07
|
31.58
|
25.07
|
1.76
|
5
|
<0.10
|
0.149
|
W
|
|
WSR33
|
20200512
|
Sunny
|
Moderate
|
Mid-Flood
|
Middle
|
4.65
|
10:03
|
9.2
|
8.23
|
31.22
|
25.29
|
1.45
|
4
|
<0.10
|
0.149
|
W
|
|
WSR33
|
20200512
|
Sunny
|
Moderate
|
Mid-Flood
|
Middle
|
4.65
|
10:03
|
9.48
|
8.19
|
31.32
|
25.22
|
2.29
|
3
|
<0.10
|
0.14
|
W
|
|
WSR33
|
20200512
|
Sunny
|
Moderate
|
Mid-Flood
|
Surface
|
1
|
10:04
|
7.8
|
8.12
|
31.37
|
25.35
|
2.1
|
2
|
<0.10
|
0.194
|
W
|
|
WSR33
|
20200512
|
Sunny
|
Moderate
|
Mid-Flood
|
Surface
|
1
|
10:04
|
8.86
|
8.06
|
31.78
|
25.08
|
1.71
|
3
|
<0.10
|
0.135
|
W
|
|
WSR36
|
20200512
|
Sunny
|
Moderate
|
Mid-Flood
|
Bottom
|
4.8
|
9:50
|
8.73
|
8.11
|
29.57
|
25.02
|
1.33
|
<2
|
<0.10
|
0.154
|
W
|
|
WSR36
|
20200512
|
Sunny
|
Moderate
|
Mid-Flood
|
Bottom
|
4.8
|
9:50
|
8.65
|
8.13
|
29.72
|
24.9
|
1.73
|
<2
|
<0.10
|
0.139
|
W
|
|
WSR36
|
20200512
|
Sunny
|
Moderate
|
Mid-Flood
|
Surface
|
1
|
9:52
|
7.89
|
8.01
|
27.88
|
25.69
|
1.87
|
2
|
<0.10
|
0.174
|
W
|
|
WSR36
|
20200512
|
Sunny
|
Moderate
|
Mid-Flood
|
Surface
|
1
|
9:52
|
7.48
|
8.06
|
28.2
|
25.56
|
1.81
|
2
|
<0.10
|
0.168
|
NW
|
|
WSR37
|
20200512
|
Sunny
|
Moderate
|
Mid-Flood
|
Bottom
|
8.3
|
9:33
|
8.53
|
8.21
|
31.56
|
25.03
|
1.87
|
<2
|
<0.10
|
0.129
|
W
|
|
WSR37
|
20200512
|
Sunny
|
Moderate
|
Mid-Flood
|
Bottom
|
8.3
|
9:33
|
7.92
|
8.2
|
31.36
|
24.91
|
1.56
|
<2
|
<0.10
|
0.137
|
W
|
|
WSR37
|
20200512
|
Sunny
|
Moderate
|
Mid-Flood
|
Middle
|
4.65
|
9:34
|
8.12
|
8.16
|
31.57
|
25.11
|
1.59
|
2
|
<0.10
|
0.177
|
W
|
|
WSR37
|
20200512
|
Sunny
|
Moderate
|
Mid-Flood
|
Middle
|
4.65
|
9:34
|
9.21
|
8.1
|
31.55
|
24.99
|
1.73
|
2
|
<0.10
|
0.183
|
W
|
|
WSR37
|
20200512
|
Sunny
|
Moderate
|
Mid-Flood
|
Surface
|
1
|
9:35
|
8.55
|
8.2
|
32.31
|
25.4
|
1.84
|
3
|
<0.10
|
0.186
|
SW
|
|
WSR37
|
20200512
|
Sunny
|
Moderate
|
Mid-Flood
|
Surface
|
1
|
9:35
|
8.51
|
8.2
|
32.37
|
25.41
|
2.18
|
3
|
<0.10
|
0.157
|
W
|
|
CE
|
20200512
|
Sunny
|
Moderate
|
Mid-Ebb
|
Bottom
|
11
|
14:49
|
9.11
|
8.17
|
31.8
|
25.61
|
1.71
|
2
|
<0.10
|
0.365
|
E
|
|
CE
|
20200512
|
Sunny
|
Moderate
|
Mid-Ebb
|
Bottom
|
11
|
14:49
|
8.77
|
8.16
|
31.85
|
25.71
|
2.2
|
3
|
<0.10
|
0.388
|
E
|
|
CE
|
20200512
|
Sunny
|
Moderate
|
Mid-Ebb
|
Middle
|
6
|
14:50
|
7.95
|
8.06
|
31.26
|
26.02
|
1.87
|
<2
|
<0.10
|
0.373
|
SE
|
|
CE
|
20200512
|
Sunny
|
Moderate
|
Mid-Ebb
|
Middle
|
6
|
14:50
|
7.56
|
8.04
|
31.8
|
25.84
|
2.23
|
<2
|
<0.10
|
0.369
|
E
|
|
CE
|
20200512
|
Sunny
|
Moderate
|
Mid-Ebb
|
Surface
|
1
|
14:51
|
7.75
|
8.2
|
31.98
|
25.66
|
2.32
|
<2
|
<0.10
|
0.365
|
SE
|
|
CE
|
20200512
|
Sunny
|
Moderate
|
Mid-Ebb
|
Surface
|
1
|
14:51
|
8.32
|
8.28
|
31.4
|
25.91
|
2.89
|
<2
|
<0.10
|
0.275
|
SE
|
|
CF
|
20200512
|
Sunny
|
Moderate
|
Mid-Ebb
|
Bottom
|
11.3
|
14:48
|
8.5
|
8.01
|
31.27
|
25.68
|
2.18
|
4
|
<0.10
|
0.2
|
SE
|
|
CF
|
20200512
|
Sunny
|
Moderate
|
Mid-Ebb
|
Bottom
|
11.3
|
14:48
|
7.47
|
8.05
|
31.74
|
25.67
|
1.69
|
4
|
<0.10
|
0.175
|
E
|
|
CF
|
20200512
|
Sunny
|
Moderate
|
Mid-Ebb
|
Middle
|
6.15
|
14:49
|
7.79
|
8.09
|
31.03
|
26.03
|
2.31
|
3
|
<0.10
|
0.19
|
SE
|
|
CF
|
20200512
|
Sunny
|
Moderate
|
Mid-Ebb
|
Middle
|
6.15
|
14:49
|
7.56
|
8.04
|
31.35
|
26.14
|
2.3
|
2
|
<0.10
|
0.158
|
E
|
|
CF
|
20200512
|
Sunny
|
Moderate
|
Mid-Ebb
|
Surface
|
1
|
14:50
|
8.83
|
8.17
|
31.18
|
25.84
|
2.44
|
3
|
<0.10
|
0.147
|
E
|
|
CF
|
20200512
|
Sunny
|
Moderate
|
Mid-Ebb
|
Surface
|
1
|
14:50
|
7.61
|
8.14
|
31.91
|
25.85
|
2.13
|
3
|
<0.10
|
0.217
|
E
|
|
NF1
|
20200512
|
Sunny
|
Moderate
|
Mid-Ebb
|
Bottom
|
9.8
|
15:31
|
9.34
|
8.1
|
31.22
|
25.57
|
1.35
|
2
|
<0.10
|
0.136
|
SE
|
|
NF1
|
20200512
|
Sunny
|
Moderate
|
Mid-Ebb
|
Bottom
|
9.8
|
15:31
|
9.13
|
8.15
|
31.2
|
25.9
|
1.67
|
2
|
<0.10
|
0.161
|
E
|
|
NF1
|
20200512
|
Sunny
|
Moderate
|
Mid-Ebb
|
Middle
|
5.4
|
15:32
|
8.65
|
8.27
|
31.36
|
25.83
|
1.95
|
<2
|
<0.10
|
0.194
|
E
|
|
NF1
|
20200512
|
Sunny
|
Moderate
|
Mid-Ebb
|
Middle
|
5.4
|
15:32
|
9.39
|
8.22
|
30.77
|
25.75
|
1.99
|
<2
|
<0.10
|
0.22
|
SE
|
|
NF1
|
20200512
|
Sunny
|
Moderate
|
Mid-Ebb
|
Surface
|
1
|
15:33
|
8.79
|
8.03
|
31.16
|
25.81
|
1.95
|
<2
|
<0.10
|
0.2
|
E
|
|
NF1
|
20200512
|
Sunny
|
Moderate
|
Mid-Ebb
|
Surface
|
1
|
15:33
|
7.51
|
8.12
|
31.7
|
25.65
|
1.8
|
<2
|
<0.10
|
0.221
|
E
|
|
NF2
|
20200512
|
Sunny
|
Moderate
|
Mid-Ebb
|
Bottom
|
4.6
|
17:03
|
7.95
|
8.27
|
31.49
|
25.37
|
1.29
|
2
|
<0.10
|
0.207
|
SE
|
|
NF2
|
20200512
|
Sunny
|
Moderate
|
Mid-Ebb
|
Bottom
|
4.6
|
17:03
|
9.13
|
8.27
|
31.11
|
25.36
|
1.73
|
2
|
<0.10
|
0.19
|
SE
|
|
NF2
|
20200512
|
Sunny
|
Moderate
|
Mid-Ebb
|
Surface
|
1
|
17:05
|
9.28
|
8.31
|
31.64
|
25.47
|
2.34
|
2
|
<0.10
|
0.198
|
E
|
|
NF2
|
20200512
|
Sunny
|
Moderate
|
Mid-Ebb
|
Surface
|
1
|
17:05
|
9.44
|
8.09
|
31.55
|
25.84
|
2.22
|
2
|
<0.10
|
0.147
|
SE
|
|
NF3
|
20200512
|
Sunny
|
Moderate
|
Mid-Ebb
|
Bottom
|
10.3
|
17:13
|
8.01
|
8.01
|
31.21
|
25.8
|
1.46
|
4
|
<0.10
|
0.219
|
E
|
|
NF3
|
20200512
|
Sunny
|
Moderate
|
Mid-Ebb
|
Bottom
|
10.3
|
17:13
|
8.3
|
8.3
|
31.29
|
25.48
|
1.25
|
2
|
<0.10
|
0.213
|
SE
|
|
NF3
|
20200512
|
Sunny
|
Moderate
|
Mid-Ebb
|
Middle
|
5.65
|
17:14
|
9.14
|
8.21
|
30.89
|
25.66
|
1.65
|
3
|
<0.10
|
0.179
|
SE
|
|
NF3
|
20200512
|
Sunny
|
Moderate
|
Mid-Ebb
|
Middle
|
5.65
|
17:14
|
7.83
|
8.16
|
31.62
|
25.5
|
1.36
|
2
|
<0.10
|
0.221
|
SE
|
|
NF3
|
20200512
|
Sunny
|
Moderate
|
Mid-Ebb
|
Surface
|
1
|
17:15
|
9.22
|
8.14
|
31.08
|
25.73
|
2.3
|
<2
|
<0.10
|
0.219
|
E
|
|
NF3
|
20200512
|
Sunny
|
Moderate
|
Mid-Ebb
|
Surface
|
1
|
17:15
|
9.13
|
8.03
|
31.81
|
25.84
|
2.37
|
<2
|
<0.10
|
0.134
|
E
|
|
WSR01
|
20200512
|
Sunny
|
Moderate
|
Mid-Ebb
|
Bottom
|
8.4
|
17:50
|
8.39
|
8.18
|
31.09
|
25.54
|
1.37
|
2
|
<0.10
|
0.196
|
SE
|
|
WSR01
|
20200512
|
Sunny
|
Moderate
|
Mid-Ebb
|
Bottom
|
8.4
|
17:50
|
8.84
|
8.01
|
31.8
|
25.74
|
1.24
|
3
|
<0.10
|
0.13
|
SE
|
|
WSR01
|
20200512
|
Sunny
|
Moderate
|
Mid-Ebb
|
Middle
|
4.7
|
17:51
|
9.4
|
8.1
|
31.4
|
25.79
|
1.59
|
2
|
<0.10
|
0.164
|
SE
|
|
WSR01
|
20200512
|
Sunny
|
Moderate
|
Mid-Ebb
|
Middle
|
4.7
|
17:51
|
8.93
|
8.27
|
31.38
|
25.55
|
1.97
|
3
|
<0.10
|
0.179
|
SE
|
|
WSR01
|
20200512
|
Sunny
|
Moderate
|
Mid-Ebb
|
Surface
|
1
|
17:52
|
8.28
|
8.26
|
31.22
|
25.35
|
1.58
|
2
|
<0.10
|
0.203
|
E
|
|
WSR01
|
20200512
|
Sunny
|
Moderate
|
Mid-Ebb
|
Surface
|
1
|
17:52
|
9.08
|
8.3
|
31.91
|
25.45
|
1.6
|
2
|
<0.10
|
0.154
|
SE
|
|
WSR02
|
20200512
|
Sunny
|
Moderate
|
Mid-Ebb
|
Bottom
|
8.7
|
17:22
|
7.66
|
8.08
|
30.73
|
25.71
|
1.59
|
2
|
<0.10
|
0.16
|
E
|
|
WSR02
|
20200512
|
Sunny
|
Moderate
|
Mid-Ebb
|
Bottom
|
8.7
|
17:22
|
9.57
|
8.27
|
31.78
|
25.36
|
1.28
|
2
|
<0.10
|
0.186
|
SE
|
|
WSR02
|
20200512
|
Sunny
|
Moderate
|
Mid-Ebb
|
Middle
|
4.85
|
17:23
|
8.43
|
8.15
|
30.78
|
25.5
|
1.56
|
3
|
<0.10
|
0.216
|
E
|
|
WSR02
|
20200512
|
Sunny
|
Moderate
|
Mid-Ebb
|
Middle
|
4.85
|
17:23
|
7.78
|
8.19
|
30.96
|
25.56
|
2.01
|
2
|
<0.10
|
0.202
|
SE
|
|
WSR02
|
20200512
|
Sunny
|
Moderate
|
Mid-Ebb
|
Surface
|
1
|
17:24
|
9.26
|
8.06
|
30.73
|
25.8
|
2.2
|
3
|
<0.10
|
0.132
|
SE
|
|
WSR02
|
20200512
|
Sunny
|
Moderate
|
Mid-Ebb
|
Surface
|
1
|
17:24
|
9.38
|
8.08
|
31.6
|
25.65
|
1.7
|
3
|
<0.10
|
0.211
|
E
|
|
WSR03
|
20200512
|
Sunny
|
Moderate
|
Mid-Ebb
|
Bottom
|
6.8
|
16:46
|
8.36
|
8.2
|
30.84
|
25.81
|
1.81
|
3
|
<0.10
|
0.184
|
E
|
|
WSR03
|
20200512
|
Sunny
|
Moderate
|
Mid-Ebb
|
Bottom
|
6.8
|
16:46
|
7.56
|
8.24
|
31.32
|
26.02
|
1.35
|
2
|
<0.10
|
0.189
|
E
|
|
WSR03
|
20200512
|
Sunny
|
Moderate
|
Mid-Ebb
|
Middle
|
3.9
|
16:47
|
7.94
|
8.05
|
31.1
|
25.94
|
1.72
|
3
|
<0.10
|
0.182
|
SE
|
|
WSR03
|
20200512
|
Sunny
|
Moderate
|
Mid-Ebb
|
Middle
|
3.9
|
16:47
|
9.2
|
8.3
|
31.9
|
25.47
|
1.91
|
3
|
<0.10
|
0.175
|
SE
|
|
WSR03
|
20200512
|
Sunny
|
Moderate
|
Mid-Ebb
|
Surface
|
1
|
16:48
|
8.03
|
8.15
|
30.92
|
25.53
|
2.3
|
2
|
<0.10
|
0.193
|
E
|
|
WSR03
|
20200512
|
Sunny
|
Moderate
|
Mid-Ebb
|
Surface
|
1
|
16:48
|
8.99
|
8.17
|
30.94
|
25.89
|
1.89
|
2
|
<0.10
|
0.189
|
E
|
|
WSR04
|
20200512
|
Sunny
|
Moderate
|
Mid-Ebb
|
Bottom
|
6.5
|
16:30
|
7.99
|
8.13
|
31.87
|
25.48
|
1.81
|
3
|
<0.10
|
0.192
|
E
|
|
WSR04
|
20200512
|
Sunny
|
Moderate
|
Mid-Ebb
|
Bottom
|
6.5
|
16:30
|
7.5
|
8.27
|
31.8
|
25.76
|
1.61
|
3
|
<0.10
|
0.205
|
SE
|
|
WSR04
|
20200512
|
Sunny
|
Moderate
|
Mid-Ebb
|
Middle
|
3.75
|
16:31
|
8.94
|
8.04
|
31.73
|
25.52
|
1.92
|
<2
|
<0.10
|
0.149
|
SE
|
|
WSR04
|
20200512
|
Sunny
|
Moderate
|
Mid-Ebb
|
Middle
|
3.75
|
16:31
|
7.6
|
8.15
|
31.41
|
25.99
|
1.34
|
<2
|
<0.10
|
0.13
|
SE
|
|
WSR04
|
20200512
|
Sunny
|
Moderate
|
Mid-Ebb
|
Surface
|
1
|
16:32
|
9.59
|
8.06
|
31.26
|
25.65
|
1.89
|
<2
|
<0.10
|
0.133
|
E
|
|
WSR04
|
20200512
|
Sunny
|
Moderate
|
Mid-Ebb
|
Surface
|
1
|
16:32
|
9.56
|
8.01
|
31.71
|
25.44
|
1.62
|
<2
|
<0.10
|
0.17
|
E
|
|
WSR16
|
20200512
|
Sunny
|
Moderate
|
Mid-Ebb
|
Bottom
|
11.6
|
15:10
|
7.82
|
8.04
|
31.82
|
25.54
|
1.88
|
3
|
<0.10
|
0.211
|
E
|
|
WSR16
|
20200512
|
Sunny
|
Moderate
|
Mid-Ebb
|
Bottom
|
11.6
|
15:10
|
9.32
|
8.1
|
31.61
|
25.56
|
1.18
|
3
|
<0.10
|
0.215
|
E
|
|
WSR16
|
20200512
|
Sunny
|
Moderate
|
Mid-Ebb
|
Middle
|
6.3
|
15:11
|
9.31
|
8.21
|
30.86
|
25.53
|
1.78
|
2
|
<0.10
|
0.199
|
SE
|
|
WSR16
|
20200512
|
Sunny
|
Moderate
|
Mid-Ebb
|
Middle
|
6.3
|
15:11
|
9.1
|
8.14
|
30.91
|
25.64
|
1.43
|
3
|
<0.10
|
0.198
|
SE
|
|
WSR16
|
20200512
|
Sunny
|
Moderate
|
Mid-Ebb
|
Surface
|
1
|
15:12
|
8.29
|
8.21
|
31.63
|
25.53
|
1.7
|
2
|
<0.10
|
0.148
|
SE
|
|
WSR16
|
20200512
|
Sunny
|
Moderate
|
Mid-Ebb
|
Surface
|
1
|
15:12
|
9.59
|
8.31
|
30.81
|
25.82
|
2.4
|
2
|
<0.10
|
0.214
|
SE
|
|
WSR33
|
20200512
|
Sunny
|
Moderate
|
Mid-Ebb
|
Bottom
|
6.2
|
16:12
|
9.59
|
8.07
|
31.72
|
25.92
|
1.3
|
2
|
<0.10
|
0.211
|
SE
|
|
WSR33
|
20200512
|
Sunny
|
Moderate
|
Mid-Ebb
|
Bottom
|
6.2
|
16:12
|
8.01
|
8.07
|
30.73
|
25.95
|
1.22
|
3
|
<0.10
|
0.133
|
E
|
|
WSR33
|
20200512
|
Sunny
|
Moderate
|
Mid-Ebb
|
Middle
|
3.6
|
16:13
|
9.55
|
8.26
|
31.65
|
25.59
|
2.08
|
3
|
<0.10
|
0.204
|
E
|
|
WSR33
|
20200512
|
Sunny
|
Moderate
|
Mid-Ebb
|
Middle
|
3.6
|
16:13
|
9.47
|
8.05
|
31.26
|
25.55
|
1.53
|
2
|
<0.10
|
0.152
|
E
|
|
WSR33
|
20200512
|
Sunny
|
Moderate
|
Mid-Ebb
|
Surface
|
1
|
16:14
|
8.95
|
8.04
|
31.22
|
25.94
|
2.02
|
<2
|
<0.10
|
0.13
|
SE
|
|
WSR33
|
20200512
|
Sunny
|
Moderate
|
Mid-Ebb
|
Surface
|
1
|
16:14
|
9.29
|
8.14
|
31.57
|
25.77
|
2.35
|
<2
|
<0.10
|
0.186
|
E
|
|
WSR36
|
20200512
|
Sunny
|
Moderate
|
Mid-Ebb
|
Bottom
|
4
|
16:00
|
7.88
|
8.29
|
31.85
|
25.78
|
1.61
|
3
|
<0.10
|
0.193
|
SE
|
|
WSR36
|
20200512
|
Sunny
|
Moderate
|
Mid-Ebb
|
Bottom
|
4
|
16:00
|
7.85
|
8.12
|
30.94
|
25.78
|
1.56
|
3
|
<0.10
|
0.181
|
SE
|
|
WSR36
|
20200512
|
Sunny
|
Moderate
|
Mid-Ebb
|
Surface
|
1
|
16:02
|
8.73
|
8.06
|
31.64
|
25.45
|
1.58
|
2
|
<0.10
|
0.13
|
SE
|
|
WSR36
|
20200512
|
Sunny
|
Moderate
|
Mid-Ebb
|
Surface
|
1
|
16:02
|
7.94
|
8.11
|
31.11
|
25.85
|
2.44
|
2
|
<0.10
|
0.148
|
SE
|
|
WSR37
|
20200512
|
Sunny
|
Moderate
|
Mid-Ebb
|
Bottom
|
6.9
|
15:44
|
7.87
|
8.05
|
31.81
|
25.77
|
1.9
|
2
|
<0.10
|
0.217
|
SE
|
|
WSR37
|
20200512
|
Sunny
|
Moderate
|
Mid-Ebb
|
Bottom
|
6.9
|
15:44
|
8.56
|
8.12
|
31.23
|
25.82
|
1.94
|
2
|
<0.10
|
0.171
|
E
|
|
WSR37
|
20200512
|
Sunny
|
Moderate
|
Mid-Ebb
|
Middle
|
3.95
|
15:45
|
8.55
|
8.24
|
31.84
|
26.11
|
1.76
|
2
|
<0.10
|
0.152
|
SE
|
|
WSR37
|
20200512
|
Sunny
|
Moderate
|
Mid-Ebb
|
Middle
|
3.95
|
15:45
|
8.64
|
8.06
|
31.46
|
26.09
|
2.11
|
2
|
<0.10
|
0.152
|
E
|
|
WSR37
|
20200512
|
Sunny
|
Moderate
|
Mid-Ebb
|
Surface
|
1
|
15:46
|
8.47
|
8.3
|
30.73
|
25.67
|
1.93
|
2
|
<0.10
|
0.175
|
SE
|
|
WSR37
|
20200512
|
Sunny
|
Moderate
|
Mid-Ebb
|
Surface
|
1
|
15:46
|
8.8
|
8.26
|
31.39
|
25.68
|
1.99
|
3
|
<0.10
|
0.197
|
SE
|
|
CE
|
20200514
|
Cloudy
|
Moderate
|
Mid-Flood
|
Bottom
|
12.1
|
8:35
|
8.61
|
8.46
|
30.99
|
25.62
|
2.33
|
3
|
<0.10
|
0.404
|
SE
|
|
CE
|
20200514
|
Cloudy
|
Moderate
|
Mid-Flood
|
Bottom
|
12.1
|
8:35
|
9.45
|
8.36
|
31.81
|
25.38
|
2.4
|
3
|
<0.10
|
0.417
|
E
|
|
CE
|
20200514
|
Cloudy
|
Moderate
|
Mid-Flood
|
Middle
|
6.55
|
8:36
|
8.55
|
8.23
|
31.02
|
25.56
|
2.46
|
2
|
<0.10
|
0.342
|
SE
|
|
CE
|
20200514
|
Cloudy
|
Moderate
|
Mid-Flood
|
Middle
|
6.55
|
8:36
|
9.9
|
8.31
|
31.85
|
25.62
|
1.84
|
3
|
<0.10
|
0.422
|
E
|
|
CE
|
20200514
|
Cloudy
|
Moderate
|
Mid-Flood
|
Surface
|
1
|
8:37
|
9.11
|
8.28
|
30.81
|
25.34
|
2.21
|
<2
|
<0.10
|
0.306
|
SE
|
|
CE
|
20200514
|
Cloudy
|
Moderate
|
Mid-Flood
|
Surface
|
1
|
8:37
|
9.38
|
8.24
|
31.6
|
25.66
|
2.55
|
<2
|
<0.10
|
0.342
|
SE
|
|
CF
|
20200514
|
Cloudy
|
Moderate
|
Mid-Flood
|
Bottom
|
11.3
|
8:35
|
9.77
|
8.41
|
30.75
|
25.34
|
1.71
|
3
|
<0.10
|
0.207
|
SE
|
|
CF
|
20200514
|
Cloudy
|
Moderate
|
Mid-Flood
|
Bottom
|
11.3
|
8:35
|
8.64
|
8.45
|
31.68
|
25.37
|
1.99
|
3
|
<0.10
|
0.181
|
SE
|
|
CF
|
20200514
|
Cloudy
|
Moderate
|
Mid-Flood
|
Middle
|
6.15
|
8:36
|
9.03
|
8.26
|
31.65
|
25.54
|
2.4
|
2
|
<0.10
|
0.166
|
SE
|
|
CF
|
20200514
|
Cloudy
|
Moderate
|
Mid-Flood
|
Middle
|
6.15
|
8:36
|
8.93
|
8.4
|
30.57
|
25.36
|
2.56
|
3
|
<0.10
|
0.201
|
SE
|
|
CF
|
20200514
|
Cloudy
|
Moderate
|
Mid-Flood
|
Surface
|
1
|
8:37
|
9
|
8.31
|
30.92
|
25.56
|
2.69
|
3
|
<0.10
|
0.164
|
E
|
|
CF
|
20200514
|
Cloudy
|
Moderate
|
Mid-Flood
|
Surface
|
1
|
8:37
|
9.47
|
8.46
|
31.19
|
25.47
|
2.23
|
2
|
<0.10
|
0.148
|
E
|
|
NF1
|
20200514
|
Cloudy
|
Moderate
|
Mid-Flood
|
Bottom
|
9.4
|
9:17
|
8.58
|
8.43
|
31.88
|
25.31
|
1.58
|
3
|
<0.10
|
0.184
|
SE
|
|
NF1
|
20200514
|
Cloudy
|
Moderate
|
Mid-Flood
|
Bottom
|
9.4
|
9:17
|
9.3
|
8.32
|
30.56
|
25.44
|
2.1
|
4
|
<0.10
|
0.173
|
SE
|
|
NF1
|
20200514
|
Cloudy
|
Moderate
|
Mid-Flood
|
Middle
|
5.2
|
9:18
|
9.54
|
8.21
|
30.85
|
25.3
|
2.12
|
3
|
<0.10
|
0.202
|
SE
|
|
NF1
|
20200514
|
Cloudy
|
Moderate
|
Mid-Flood
|
Middle
|
5.2
|
9:18
|
9.37
|
8.38
|
31.47
|
25.48
|
2.43
|
4
|
<0.10
|
0.163
|
SE
|
|
NF1
|
20200514
|
Cloudy
|
Moderate
|
Mid-Flood
|
Surface
|
1
|
9:19
|
8.77
|
8.44
|
31
|
25.64
|
2.55
|
3
|
<0.10
|
0.17
|
E
|
|
NF1
|
20200514
|
Cloudy
|
Moderate
|
Mid-Flood
|
Surface
|
1
|
9:19
|
9.51
|
8.4
|
30.85
|
25.49
|
2.12
|
3
|
<0.10
|
0.179
|
SE
|
|
NF2
|
20200514
|
Cloudy
|
Moderate
|
Mid-Flood
|
Bottom
|
8.9
|
10:49
|
8.62
|
8.26
|
31.88
|
25.49
|
2.42
|
4
|
<0.10
|
0.171
|
SE
|
|
NF2
|
20200514
|
Cloudy
|
Moderate
|
Mid-Flood
|
Bottom
|
8.9
|
10:49
|
9.19
|
8.33
|
30.65
|
25.3
|
2.26
|
3
|
<0.10
|
0.215
|
SE
|
|
NF2
|
20200514
|
Cloudy
|
Moderate
|
Mid-Flood
|
Middle
|
4.95
|
10:50
|
9.98
|
8.39
|
30.65
|
25.72
|
2.65
|
4
|
<0.10
|
0.152
|
SE
|
|
NF2
|
20200514
|
Cloudy
|
Moderate
|
Mid-Flood
|
Middle
|
4.95
|
10:50
|
8.93
|
8.47
|
31.32
|
25.74
|
2.21
|
3
|
<0.10
|
0.155
|
E
|
|
NF2
|
20200514
|
Cloudy
|
Moderate
|
Mid-Flood
|
Surface
|
1
|
10:51
|
9.62
|
8.23
|
30.67
|
25.69
|
2.84
|
4
|
<0.10
|
0.167
|
E
|
|
NF2
|
20200514
|
Cloudy
|
Moderate
|
Mid-Flood
|
Surface
|
1
|
10:51
|
9.51
|
8.27
|
31.77
|
25.51
|
2.05
|
4
|
<0.10
|
0.131
|
SE
|
|
NF3
|
20200514
|
Cloudy
|
Moderate
|
Mid-Flood
|
Bottom
|
9.4
|
10:58
|
9.65
|
8.27
|
31.76
|
25.52
|
2.04
|
3
|
<0.10
|
0.195
|
SE
|
|
NF3
|
20200514
|
Cloudy
|
Moderate
|
Mid-Flood
|
Bottom
|
9.4
|
10:58
|
9.78
|
8.25
|
31.22
|
25.82
|
1.6
|
3
|
<0.10
|
0.193
|
E
|
|
NF3
|
20200514
|
Cloudy
|
Moderate
|
Mid-Flood
|
Middle
|
5.2
|
10:59
|
9.19
|
8.27
|
30.69
|
25.5
|
2.51
|
2
|
<0.10
|
0.205
|
SE
|
|
NF3
|
20200514
|
Cloudy
|
Moderate
|
Mid-Flood
|
Middle
|
5.2
|
10:59
|
9.75
|
8.39
|
31.54
|
25.32
|
1.97
|
3
|
<0.10
|
0.175
|
E
|
|
NF3
|
20200514
|
Cloudy
|
Moderate
|
Mid-Flood
|
Surface
|
1
|
11:00
|
9.4
|
8.25
|
31.78
|
25.74
|
2.06
|
2
|
<0.10
|
0.151
|
SE
|
|
NF3
|
20200514
|
Cloudy
|
Moderate
|
Mid-Flood
|
Surface
|
1
|
11:00
|
9.7
|
8.29
|
30.55
|
25.57
|
2.79
|
3
|
<0.10
|
0.151
|
E
|
|
WSR01
|
20200514
|
Cloudy
|
Moderate
|
Mid-Flood
|
Bottom
|
7.4
|
11:44
|
8.43
|
8.38
|
31.27
|
25.86
|
1.57
|
3
|
<0.10
|
0.219
|
SE
|
|
WSR01
|
20200514
|
Cloudy
|
Moderate
|
Mid-Flood
|
Bottom
|
7.4
|
11:44
|
9.33
|
8.36
|
31.32
|
25.71
|
1.57
|
3
|
<0.10
|
0.16
|
E
|
|
WSR01
|
20200514
|
Cloudy
|
Moderate
|
Mid-Flood
|
Middle
|
4.2
|
11:45
|
9.26
|
8.43
|
31.45
|
25.75
|
2.57
|
2
|
<0.10
|
0.13
|
E
|
|
WSR01
|
20200514
|
Cloudy
|
Moderate
|
Mid-Flood
|
Middle
|
4.2
|
11:45
|
8.82
|
8.25
|
31.83
|
25.64
|
2.31
|
3
|
<0.10
|
0.138
|
E
|
|
WSR01
|
20200514
|
Cloudy
|
Moderate
|
Mid-Flood
|
Surface
|
1
|
11:46
|
9.47
|
8.18
|
30.57
|
25.4
|
2.89
|
3
|
<0.10
|
0.19
|
SE
|
|
WSR01
|
20200514
|
Cloudy
|
Moderate
|
Mid-Flood
|
Surface
|
1
|
11:46
|
8.47
|
8.23
|
31.44
|
25.86
|
2.44
|
2
|
<0.10
|
0.18
|
SE
|
|
WSR02
|
20200514
|
Cloudy
|
Moderate
|
Mid-Flood
|
Bottom
|
8.1
|
11:16
|
9.28
|
8.46
|
31.61
|
25.53
|
1.7
|
4
|
<0.10
|
0.15
|
SE
|
|
WSR02
|
20200514
|
Cloudy
|
Moderate
|
Mid-Flood
|
Bottom
|
8.1
|
11:16
|
8.68
|
8.34
|
30.56
|
25.54
|
2.27
|
5
|
<0.10
|
0.168
|
E
|
|
WSR02
|
20200514
|
Cloudy
|
Moderate
|
Mid-Flood
|
Middle
|
4.55
|
11:17
|
8.67
|
8.35
|
30.49
|
25.42
|
2.65
|
2
|
<0.10
|
0.18
|
E
|
|
WSR02
|
20200514
|
Cloudy
|
Moderate
|
Mid-Flood
|
Middle
|
4.55
|
11:17
|
9.11
|
8.38
|
31.58
|
25.7
|
1.78
|
2
|
<0.10
|
0.205
|
SE
|
|
WSR02
|
20200514
|
Cloudy
|
Moderate
|
Mid-Flood
|
Surface
|
1
|
11:18
|
9.97
|
8.29
|
31.73
|
25.63
|
2.3
|
2
|
<0.10
|
0.189
|
E
|
|
WSR02
|
20200514
|
Cloudy
|
Moderate
|
Mid-Flood
|
Surface
|
1
|
11:18
|
8.67
|
8.17
|
31.27
|
25.53
|
2.53
|
2
|
<0.10
|
0.134
|
SE
|
|
WSR03
|
20200514
|
Cloudy
|
Moderate
|
Mid-Flood
|
Bottom
|
6.7
|
10:31
|
8.8
|
8.45
|
31.86
|
25.58
|
2.02
|
8
|
<0.10
|
0.162
|
SE
|
|
WSR03
|
20200514
|
Cloudy
|
Moderate
|
Mid-Flood
|
Bottom
|
6.7
|
10:31
|
9.81
|
8.33
|
31.81
|
25.54
|
1.75
|
9
|
<0.10
|
0.175
|
SE
|
|
WSR03
|
20200514
|
Cloudy
|
Moderate
|
Mid-Flood
|
Middle
|
3.85
|
10:32
|
9.59
|
8.5
|
31.82
|
25.72
|
1.86
|
5
|
<0.10
|
0.213
|
SE
|
|
WSR03
|
20200514
|
Cloudy
|
Moderate
|
Mid-Flood
|
Middle
|
3.85
|
10:32
|
9.38
|
8.2
|
31.05
|
25.76
|
1.82
|
4
|
<0.10
|
0.167
|
SE
|
|
WSR03
|
20200514
|
Cloudy
|
Moderate
|
Mid-Flood
|
Surface
|
1
|
10:33
|
8.69
|
8.41
|
31.37
|
25.34
|
2.42
|
3
|
<0.10
|
0.136
|
E
|
|
WSR03
|
20200514
|
Cloudy
|
Moderate
|
Mid-Flood
|
Surface
|
1
|
10:33
|
8.44
|
8.41
|
31.67
|
25.71
|
2.25
|
4
|
<0.10
|
0.176
|
SE
|
|
WSR04
|
20200514
|
Cloudy
|
Moderate
|
Mid-Flood
|
Bottom
|
6.5
|
10:14
|
9.85
|
8.23
|
30.54
|
25.8
|
2.32
|
2
|
<0.10
|
0.148
|
E
|
|
WSR04
|
20200514
|
Cloudy
|
Moderate
|
Mid-Flood
|
Bottom
|
6.5
|
10:14
|
9.19
|
8.37
|
31.85
|
25.76
|
1.83
|
3
|
<0.10
|
0.14
|
SE
|
|
WSR04
|
20200514
|
Cloudy
|
Moderate
|
Mid-Flood
|
Middle
|
3.75
|
10:15
|
9.35
|
8.47
|
30.69
|
25.46
|
2.45
|
3
|
<0.10
|
0.133
|
E
|
|
WSR04
|
20200514
|
Cloudy
|
Moderate
|
Mid-Flood
|
Middle
|
3.75
|
10:15
|
8.54
|
8.27
|
31.14
|
25.46
|
1.9
|
2
|
<0.10
|
0.148
|
E
|
|
WSR04
|
20200514
|
Cloudy
|
Moderate
|
Mid-Flood
|
Surface
|
1
|
10:16
|
9.93
|
8.18
|
30.81
|
25.71
|
2.68
|
5
|
<0.10
|
0.181
|
SE
|
|
WSR04
|
20200514
|
Cloudy
|
Moderate
|
Mid-Flood
|
Surface
|
1
|
10:16
|
8.46
|
8.21
|
30.81
|
25.35
|
2.55
|
4
|
<0.10
|
0.183
|
E
|
|
WSR16
|
20200514
|
Cloudy
|
Moderate
|
Mid-Flood
|
Bottom
|
11.4
|
8:55
|
9.3
|
8.27
|
30.93
|
25.48
|
2.04
|
4
|
<0.10
|
0.202
|
SE
|
|
WSR16
|
20200514
|
Cloudy
|
Moderate
|
Mid-Flood
|
Bottom
|
11.4
|
8:55
|
8.92
|
8.21
|
31.39
|
25.41
|
2.13
|
4
|
<0.10
|
0.206
|
SE
|
|
WSR16
|
20200514
|
Cloudy
|
Moderate
|
Mid-Flood
|
Middle
|
6.2
|
8:56
|
9.04
|
8.31
|
31.78
|
25.61
|
2.56
|
3
|
<0.10
|
0.218
|
SE
|
|
WSR16
|
20200514
|
Cloudy
|
Moderate
|
Mid-Flood
|
Middle
|
6.2
|
8:56
|
9.31
|
8.27
|
31.16
|
25.46
|
2.44
|
4
|
<0.10
|
0.228
|
E
|
|
WSR16
|
20200514
|
Cloudy
|
Moderate
|
Mid-Flood
|
Surface
|
1
|
8:57
|
8.91
|
8.22
|
31.09
|
25.46
|
2.71
|
4
|
<0.10
|
0.149
|
E
|
|
WSR16
|
20200514
|
Cloudy
|
Moderate
|
Mid-Flood
|
Surface
|
1
|
8:57
|
9.52
|
8.38
|
30.8
|
25.48
|
2.81
|
3
|
<0.10
|
0.175
|
SE
|
|
WSR33
|
20200514
|
Cloudy
|
Moderate
|
Mid-Flood
|
Bottom
|
6.7
|
9:58
|
9.5
|
8.31
|
30.88
|
25.57
|
1.99
|
3
|
<0.10
|
0.165
|
E
|
|
WSR33
|
20200514
|
Cloudy
|
Moderate
|
Mid-Flood
|
Bottom
|
6.7
|
9:58
|
8.81
|
8.46
|
31.05
|
25.42
|
1.89
|
3
|
<0.10
|
0.203
|
SE
|
|
WSR33
|
20200514
|
Cloudy
|
Moderate
|
Mid-Flood
|
Middle
|
3.85
|
9:59
|
8.84
|
8.37
|
30.86
|
25.32
|
2.22
|
3
|
<0.10
|
0.206
|
E
|
|
WSR33
|
20200514
|
Cloudy
|
Moderate
|
Mid-Flood
|
Middle
|
3.85
|
9:59
|
9.39
|
8.4
|
31.14
|
25.43
|
2.32
|
3
|
<0.10
|
0.152
|
SE
|
|
WSR33
|
20200514
|
Cloudy
|
Moderate
|
Mid-Flood
|
Surface
|
1
|
10:00
|
8.48
|
8.34
|
31.42
|
25.37
|
2.45
|
2
|
<0.10
|
0.215
|
E
|
|
WSR33
|
20200514
|
Cloudy
|
Moderate
|
Mid-Flood
|
Surface
|
1
|
10:00
|
8.96
|
8.21
|
31.35
|
25.58
|
2.78
|
2
|
<0.10
|
0.191
|
SE
|
|
WSR36
|
20200514
|
Cloudy
|
Moderate
|
Mid-Flood
|
Bottom
|
4.1
|
9:45
|
9.54
|
8.36
|
31.74
|
25.57
|
1.78
|
2
|
<0.10
|
0.157
|
E
|
|
WSR36
|
20200514
|
Cloudy
|
Moderate
|
Mid-Flood
|
Bottom
|
4.1
|
9:45
|
8.45
|
8.48
|
31.51
|
25.56
|
1.96
|
2
|
<0.10
|
0.211
|
E
|
|
WSR36
|
20200514
|
Cloudy
|
Moderate
|
Mid-Flood
|
Surface
|
1
|
9:47
|
8.91
|
8.24
|
30.98
|
25.56
|
2.78
|
4
|
<0.10
|
0.177
|
E
|
|
WSR36
|
20200514
|
Cloudy
|
Moderate
|
Mid-Flood
|
Surface
|
1
|
9:47
|
8.69
|
8.25
|
31.01
|
25.33
|
2.34
|
3
|
<0.10
|
0.183
|
SE
|
|
WSR37
|
20200514
|
Cloudy
|
Moderate
|
Mid-Flood
|
Bottom
|
6.6
|
9:28
|
9.84
|
8.22
|
31.06
|
25.33
|
2.24
|
5
|
<0.10
|
0.201
|
E
|
|
WSR37
|
20200514
|
Cloudy
|
Moderate
|
Mid-Flood
|
Bottom
|
6.6
|
9:28
|
9.72
|
8.38
|
31.05
|
25.52
|
1.76
|
4
|
<0.10
|
0.168
|
E
|
|
WSR37
|
20200514
|
Cloudy
|
Moderate
|
Mid-Flood
|
Middle
|
3.8
|
9:29
|
9.65
|
8.37
|
31.28
|
25.66
|
1.99
|
3
|
<0.10
|
0.141
|
SE
|
|
WSR37
|
20200514
|
Cloudy
|
Moderate
|
Mid-Flood
|
Middle
|
3.8
|
9:29
|
9.2
|
8.33
|
30.58
|
25.33
|
2.17
|
2
|
<0.10
|
0.175
|
E
|
|
WSR37
|
20200514
|
Cloudy
|
Moderate
|
Mid-Flood
|
Surface
|
1
|
9:30
|
9.87
|
8.35
|
31.86
|
25.68
|
2.08
|
2
|
<0.10
|
0.184
|
E
|
|
WSR37
|
20200514
|
Cloudy
|
Moderate
|
Mid-Flood
|
Surface
|
1
|
9:30
|
9.55
|
8.38
|
31.01
|
25.42
|
2.06
|
2
|
<0.10
|
0.202
|
SE
|
|
CE
|
20200514
|
Cloudy
|
Moderate
|
Mid-Ebb
|
Bottom
|
10.4
|
14:11
|
9.14
|
8.25
|
31.68
|
25.66
|
1.61
|
3
|
<0.10
|
0.184
|
NW
|
|
CE
|
20200514
|
Cloudy
|
Moderate
|
Mid-Ebb
|
Bottom
|
10.4
|
14:11
|
8.98
|
8.36
|
31.13
|
26.17
|
1.75
|
3
|
<0.10
|
0.163
|
NW
|
|
CE
|
20200514
|
Cloudy
|
Moderate
|
Mid-Ebb
|
Middle
|
5.7
|
14:12
|
8.61
|
8.41
|
30.88
|
25.77
|
2.59
|
2
|
<0.10
|
0.195
|
NW
|
|
CE
|
20200514
|
Cloudy
|
Moderate
|
Mid-Ebb
|
Middle
|
5.7
|
14:12
|
9.5
|
8.29
|
30.36
|
25.9
|
2.21
|
2
|
<0.10
|
0.196
|
NW
|
|
CE
|
20200514
|
Cloudy
|
Moderate
|
Mid-Ebb
|
Surface
|
1
|
14:13
|
9.18
|
8.4
|
31.09
|
26.21
|
2.17
|
3
|
<0.10
|
0.218
|
NW
|
|
CE
|
20200514
|
Cloudy
|
Moderate
|
Mid-Ebb
|
Surface
|
1
|
14:13
|
9.89
|
8.24
|
30.71
|
25.71
|
2.11
|
2
|
<0.10
|
0.18
|
N
|
|
CF
|
20200514
|
Cloudy
|
Moderate
|
Mid-Ebb
|
Bottom
|
11
|
14:06
|
8.83
|
8.42
|
30.48
|
25.85
|
2.26
|
3
|
<0.10
|
0.178
|
W
|
|
CF
|
20200514
|
Cloudy
|
Moderate
|
Mid-Ebb
|
Bottom
|
11
|
14:06
|
8.72
|
8.51
|
30.89
|
26.21
|
2.07
|
3
|
<0.10
|
0.163
|
W
|
|
CF
|
20200514
|
Cloudy
|
Moderate
|
Mid-Ebb
|
Middle
|
6
|
14:07
|
9.78
|
8.36
|
31.56
|
25.89
|
2.48
|
3
|
<0.10
|
0.246
|
NW
|
|
CF
|
20200514
|
Cloudy
|
Moderate
|
Mid-Ebb
|
Middle
|
6
|
14:07
|
8.73
|
8.36
|
30.44
|
26.01
|
1.86
|
2
|
<0.10
|
0.168
|
NW
|
|
CF
|
20200514
|
Cloudy
|
Moderate
|
Mid-Ebb
|
Surface
|
1
|
14:08
|
10.12
|
8.23
|
30.37
|
25.61
|
2.28
|
3
|
<0.10
|
0.192
|
SW
|
|
CF
|
20200514
|
Cloudy
|
Moderate
|
Mid-Ebb
|
Surface
|
1
|
14:08
|
10.03
|
8.42
|
31.06
|
26.18
|
2.08
|
2
|
<0.10
|
0.224
|
W
|
|
NF1
|
20200514
|
Cloudy
|
Moderate
|
Mid-Ebb
|
Bottom
|
10.2
|
14:53
|
8.58
|
8.46
|
30.9
|
26.03
|
2.28
|
4
|
<0.10
|
0.185
|
W
|
|
NF1
|
20200514
|
Cloudy
|
Moderate
|
Mid-Ebb
|
Bottom
|
10.2
|
14:53
|
9.16
|
8.4
|
30.62
|
25.87
|
2.4
|
3
|
<0.10
|
0.155
|
W
|
|
NF1
|
20200514
|
Cloudy
|
Moderate
|
Mid-Ebb
|
Middle
|
5.6
|
14:54
|
9.98
|
8.3
|
31.09
|
26.26
|
2.16
|
2
|
<0.10
|
0.152
|
W
|
|
NF1
|
20200514
|
Cloudy
|
Moderate
|
Mid-Ebb
|
Middle
|
5.6
|
14:54
|
9.77
|
8.28
|
30.38
|
26.06
|
1.89
|
4
|
<0.10
|
0.159
|
NW
|
|
NF1
|
20200514
|
Cloudy
|
Moderate
|
Mid-Ebb
|
Surface
|
1
|
14:55
|
8.89
|
8.46
|
31.2
|
26.19
|
2.29
|
<2
|
<0.10
|
0.176
|
W
|
|
NF1
|
20200514
|
Cloudy
|
Moderate
|
Mid-Ebb
|
Surface
|
1
|
14:55
|
9.04
|
8.29
|
31.53
|
26.23
|
2.12
|
<2
|
<0.10
|
0.155
|
NW
|
|
NF2
|
20200514
|
Cloudy
|
Moderate
|
Mid-Ebb
|
Bottom
|
8.7
|
16:28
|
9.72
|
8.24
|
31.11
|
25.96
|
1.69
|
3
|
<0.10
|
0.196
|
W
|
|
NF2
|
20200514
|
Cloudy
|
Moderate
|
Mid-Ebb
|
Bottom
|
8.7
|
16:28
|
9.95
|
8.4
|
31.11
|
25.79
|
1.95
|
2
|
<0.10
|
0.133
|
NW
|
|
NF2
|
20200514
|
Cloudy
|
Moderate
|
Mid-Ebb
|
Middle
|
4.85
|
16:29
|
10.15
|
8.24
|
31.37
|
26.08
|
2.21
|
2
|
<0.10
|
0.138
|
SW
|
|
NF2
|
20200514
|
Cloudy
|
Moderate
|
Mid-Ebb
|
Middle
|
4.85
|
16:29
|
8.83
|
8.21
|
30.42
|
26.05
|
2
|
2
|
<0.10
|
0.183
|
SW
|
|
NF2
|
20200514
|
Cloudy
|
Moderate
|
Mid-Ebb
|
Surface
|
1
|
16:30
|
10.01
|
8.34
|
31.19
|
25.86
|
2.2
|
<2
|
<0.10
|
0.183
|
SW
|
|
NF2
|
20200514
|
Cloudy
|
Moderate
|
Mid-Ebb
|
Surface
|
1
|
16:30
|
10.09
|
8.27
|
31.16
|
26.08
|
2.57
|
<2
|
<0.10
|
0.141
|
W
|
|
NF3
|
20200514
|
Cloudy
|
Moderate
|
Mid-Ebb
|
Bottom
|
9.9
|
16:36
|
9.12
|
8.26
|
31.1
|
25.9
|
1.61
|
4
|
<0.10
|
0.155
|
W
|
|
NF3
|
20200514
|
Cloudy
|
Moderate
|
Mid-Ebb
|
Bottom
|
9.9
|
16:36
|
10.11
|
8.23
|
31.12
|
25.76
|
1.63
|
3
|
<0.10
|
0.172
|
NW
|
|
NF3
|
20200514
|
Cloudy
|
Moderate
|
Mid-Ebb
|
Middle
|
5.45
|
16:37
|
9.25
|
8.43
|
30.58
|
26.11
|
2.66
|
2
|
<0.10
|
0.138
|
NW
|
|
NF3
|
20200514
|
Cloudy
|
Moderate
|
Mid-Ebb
|
Middle
|
5.45
|
16:37
|
8.73
|
8.36
|
30.75
|
26.16
|
2.03
|
3
|
<0.10
|
0.171
|
SW
|
|
NF3
|
20200514
|
Cloudy
|
Moderate
|
Mid-Ebb
|
Surface
|
1
|
16:38
|
9.49
|
8.48
|
30.66
|
25.78
|
2.84
|
2
|
<0.10
|
0.171
|
W
|
|
NF3
|
20200514
|
Cloudy
|
Moderate
|
Mid-Ebb
|
Surface
|
1
|
16:38
|
9.78
|
8.25
|
30.9
|
25.78
|
2.89
|
2
|
<0.10
|
0.168
|
SW
|
|
WSR01
|
20200514
|
Cloudy
|
Moderate
|
Mid-Ebb
|
Bottom
|
7.5
|
17:13
|
9.32
|
8.48
|
31.3
|
25.77
|
1.69
|
4
|
<0.10
|
0.194
|
W
|
|
WSR01
|
20200514
|
Cloudy
|
Moderate
|
Mid-Ebb
|
Bottom
|
7.5
|
17:13
|
9.4
|
8.38
|
31.58
|
26.1
|
1.84
|
5
|
<0.10
|
0.174
|
SW
|
|
WSR01
|
20200514
|
Cloudy
|
Moderate
|
Mid-Ebb
|
Middle
|
4.25
|
17:14
|
9.81
|
8.31
|
31.24
|
25.83
|
2.18
|
4
|
<0.10
|
0.155
|
NW
|
|
WSR01
|
20200514
|
Cloudy
|
Moderate
|
Mid-Ebb
|
Middle
|
4.25
|
17:14
|
9.81
|
8.24
|
30.9
|
25.93
|
1.95
|
3
|
<0.10
|
0.144
|
W
|
|
WSR01
|
20200514
|
Cloudy
|
Moderate
|
Mid-Ebb
|
Surface
|
1
|
17:15
|
9.85
|
8.35
|
30.64
|
25.74
|
2.22
|
3
|
<0.10
|
0.142
|
SW
|
|
WSR01
|
20200514
|
Cloudy
|
Moderate
|
Mid-Ebb
|
Surface
|
1
|
17:15
|
9.18
|
8.33
|
30.66
|
25.77
|
2.7
|
4
|
<0.10
|
0.155
|
W
|
|
WSR02
|
20200514
|
Cloudy
|
Moderate
|
Mid-Ebb
|
Bottom
|
8
|
16:47
|
8.72
|
8.45
|
31.23
|
26.18
|
2.19
|
3
|
<0.10
|
0.162
|
W
|
|
WSR02
|
20200514
|
Cloudy
|
Moderate
|
Mid-Ebb
|
Bottom
|
8
|
16:47
|
9.52
|
8.42
|
30.9
|
26.12
|
1.96
|
2
|
<0.10
|
0.148
|
W
|
|
WSR02
|
20200514
|
Cloudy
|
Moderate
|
Mid-Ebb
|
Middle
|
4.5
|
16:48
|
9.33
|
8.42
|
30.98
|
25.76
|
1.95
|
3
|
<0.10
|
0.162
|
NW
|
|
WSR02
|
20200514
|
Cloudy
|
Moderate
|
Mid-Ebb
|
Middle
|
4.5
|
16:48
|
8.71
|
8.21
|
31.27
|
26.14
|
2.44
|
3
|
<0.10
|
0.149
|
SW
|
|
WSR02
|
20200514
|
Cloudy
|
Moderate
|
Mid-Ebb
|
Surface
|
1
|
16:49
|
9.55
|
8.31
|
31.6
|
26.07
|
2.59
|
4
|
<0.10
|
0.183
|
W
|
|
WSR02
|
20200514
|
Cloudy
|
Moderate
|
Mid-Ebb
|
Surface
|
1
|
16:49
|
9.3
|
8.26
|
30.99
|
26.11
|
2.47
|
5
|
<0.10
|
0.156
|
SW
|
|
WSR03
|
20200514
|
Cloudy
|
Moderate
|
Mid-Ebb
|
Bottom
|
7.1
|
16:12
|
8.64
|
8.5
|
30.71
|
25.88
|
1.94
|
3
|
<0.10
|
0.15
|
NW
|
|
WSR03
|
20200514
|
Cloudy
|
Moderate
|
Mid-Ebb
|
Bottom
|
7.1
|
16:12
|
9
|
8.51
|
31.65
|
26.08
|
2.29
|
2
|
<0.10
|
0.159
|
W
|
|
WSR03
|
20200514
|
Cloudy
|
Moderate
|
Mid-Ebb
|
Middle
|
4.05
|
16:13
|
9.66
|
8.28
|
31.39
|
26.35
|
2.2
|
2
|
<0.10
|
0.159
|
SW
|
|
WSR03
|
20200514
|
Cloudy
|
Moderate
|
Mid-Ebb
|
Middle
|
4.05
|
16:13
|
9.27
|
8.39
|
31.34
|
26.04
|
2.43
|
3
|
<0.10
|
0.128
|
W
|
|
WSR03
|
20200514
|
Cloudy
|
Moderate
|
Mid-Ebb
|
Surface
|
1
|
16:14
|
9.04
|
8.51
|
31.24
|
25.83
|
2.69
|
4
|
<0.10
|
0.169
|
NW
|
|
WSR03
|
20200514
|
Cloudy
|
Moderate
|
Mid-Ebb
|
Surface
|
1
|
16:14
|
9.43
|
8.46
|
31.05
|
26.3
|
2.82
|
3
|
<0.10
|
0.162
|
W
|
|
WSR04
|
20200514
|
Cloudy
|
Moderate
|
Mid-Ebb
|
Bottom
|
6.3
|
15:55
|
9.33
|
8.45
|
30.63
|
26.13
|
1.57
|
4
|
<0.10
|
0.164
|
W
|
|
WSR04
|
20200514
|
Cloudy
|
Moderate
|
Mid-Ebb
|
Bottom
|
6.3
|
15:55
|
9.4
|
8.4
|
31.48
|
26.01
|
2.02
|
3
|
<0.10
|
0.189
|
W
|
|
WSR04
|
20200514
|
Cloudy
|
Moderate
|
Mid-Ebb
|
Middle
|
3.65
|
15:56
|
9.61
|
8.51
|
30.85
|
26.32
|
2.55
|
4
|
<0.10
|
0.19
|
SW
|
|
WSR04
|
20200514
|
Cloudy
|
Moderate
|
Mid-Ebb
|
Middle
|
3.65
|
15:56
|
9.08
|
8.33
|
31.29
|
25.82
|
2.39
|
3
|
<0.10
|
0.163
|
SW
|
|
WSR04
|
20200514
|
Cloudy
|
Moderate
|
Mid-Ebb
|
Surface
|
1
|
15:57
|
9.03
|
8.47
|
30.32
|
26.02
|
2.12
|
2
|
<0.10
|
0.162
|
W
|
|
WSR04
|
20200514
|
Cloudy
|
Moderate
|
Mid-Ebb
|
Surface
|
1
|
15:57
|
9.89
|
8.46
|
30.61
|
25.82
|
2.33
|
2
|
<0.10
|
0.171
|
W
|
|
WSR16
|
20200514
|
Cloudy
|
Moderate
|
Mid-Ebb
|
Bottom
|
11.2
|
14:31
|
9.65
|
8.41
|
31.59
|
25.89
|
1.99
|
3
|
<0.10
|
0.165
|
N
|
|
WSR16
|
20200514
|
Cloudy
|
Moderate
|
Mid-Ebb
|
Bottom
|
11.2
|
14:31
|
9.55
|
8.26
|
30.93
|
25.6
|
2.03
|
3
|
<0.10
|
0.183
|
N
|
|
WSR16
|
20200514
|
Cloudy
|
Moderate
|
Mid-Ebb
|
Middle
|
6.1
|
14:32
|
8.67
|
8.47
|
30.57
|
26.14
|
2.01
|
6
|
<0.10
|
0.182
|
NW
|
|
WSR16
|
20200514
|
Cloudy
|
Moderate
|
Mid-Ebb
|
Middle
|
6.1
|
14:32
|
9.24
|
8.42
|
31.47
|
25.79
|
2.5
|
5
|
<0.10
|
0.222
|
NW
|
|
WSR16
|
20200514
|
Cloudy
|
Moderate
|
Mid-Ebb
|
Surface
|
1
|
14:33
|
10.04
|
8.22
|
30.75
|
25.6
|
2.27
|
6
|
<0.10
|
0.213
|
N
|
|
WSR16
|
20200514
|
Cloudy
|
Moderate
|
Mid-Ebb
|
Surface
|
1
|
14:33
|
8.58
|
8.49
|
30.77
|
26.15
|
2.46
|
6
|
<0.10
|
0.207
|
NW
|
|
WSR33
|
20200514
|
Cloudy
|
Moderate
|
Mid-Ebb
|
Bottom
|
6.1
|
15:38
|
9.99
|
8.27
|
30.87
|
25.86
|
2.16
|
5
|
<0.10
|
0.158
|
W
|
|
WSR33
|
20200514
|
Cloudy
|
Moderate
|
Mid-Ebb
|
Bottom
|
6.1
|
15:38
|
9.32
|
8.45
|
30.37
|
26.19
|
2.11
|
4
|
<0.10
|
0.15
|
W
|
|
WSR33
|
20200514
|
Cloudy
|
Moderate
|
Mid-Ebb
|
Middle
|
3.55
|
15:39
|
9.11
|
8.25
|
31.56
|
25.88
|
1.93
|
4
|
<0.10
|
0.167
|
W
|
|
WSR33
|
20200514
|
Cloudy
|
Moderate
|
Mid-Ebb
|
Middle
|
3.55
|
15:39
|
8.68
|
8.43
|
30.71
|
26.33
|
2.15
|
3
|
<0.10
|
0.19
|
W
|
|
WSR33
|
20200514
|
Cloudy
|
Moderate
|
Mid-Ebb
|
Surface
|
1
|
15:40
|
8.93
|
8.32
|
30.35
|
25.87
|
2.32
|
3
|
<0.10
|
0.177
|
SW
|
|
WSR33
|
20200514
|
Cloudy
|
Moderate
|
Mid-Ebb
|
Surface
|
1
|
15:40
|
9.56
|
8.29
|
31.15
|
25.76
|
2.14
|
2
|
<0.10
|
0.194
|
SW
|
|
WSR36
|
20200514
|
Cloudy
|
Moderate
|
Mid-Ebb
|
Bottom
|
4.2
|
15:26
|
8.92
|
8.34
|
31.28
|
26.32
|
2.37
|
3
|
<0.10
|
0.18
|
W
|
|
WSR36
|
20200514
|
Cloudy
|
Moderate
|
Mid-Ebb
|
Bottom
|
4.2
|
15:26
|
10
|
8.22
|
30.31
|
25.81
|
1.78
|
3
|
<0.10
|
0.142
|
W
|
|
WSR36
|
20200514
|
Cloudy
|
Moderate
|
Mid-Ebb
|
Surface
|
1
|
15:28
|
9.21
|
8.46
|
30.35
|
26.3
|
2.17
|
4
|
<0.10
|
0.19
|
W
|
|
WSR36
|
20200514
|
Cloudy
|
Moderate
|
Mid-Ebb
|
Surface
|
1
|
15:28
|
9.27
|
8.34
|
30.46
|
25.75
|
2.47
|
4
|
<0.10
|
0.16
|
W
|
|
WSR37
|
20200514
|
Cloudy
|
Moderate
|
Mid-Ebb
|
Bottom
|
7.1
|
15:07
|
8.65
|
8.49
|
30.57
|
25.87
|
1.9
|
2
|
<0.10
|
0.196
|
W
|
|
WSR37
|
20200514
|
Cloudy
|
Moderate
|
Mid-Ebb
|
Bottom
|
7.1
|
15:07
|
9.91
|
8.41
|
30.92
|
25.95
|
2.07
|
3
|
<0.10
|
0.196
|
W
|
|
WSR37
|
20200514
|
Cloudy
|
Moderate
|
Mid-Ebb
|
Middle
|
4.05
|
15:08
|
8.85
|
8.24
|
31.42
|
25.94
|
2.35
|
3
|
<0.10
|
0.17
|
W
|
|
WSR37
|
20200514
|
Cloudy
|
Moderate
|
Mid-Ebb
|
Middle
|
4.05
|
15:08
|
9.33
|
8.26
|
31.67
|
26.19
|
1.86
|
2
|
<0.10
|
0.16
|
W
|
|
WSR37
|
20200514
|
Cloudy
|
Moderate
|
Mid-Ebb
|
Surface
|
1
|
15:09
|
9.87
|
8.38
|
31.39
|
25.84
|
2.41
|
2
|
<0.10
|
0.182
|
W
|
|
WSR37
|
20200514
|
Cloudy
|
Moderate
|
Mid-Ebb
|
Surface
|
1
|
15:09
|
8.6
|
8.23
|
31.03
|
25.85
|
2.39
|
3
|
<0.10
|
0.16
|
W
|
|
CE
|
20200516
|
Sunny
|
Moderate
|
Mid-Ebb
|
Bottom
|
11.1
|
8:00
|
8.69
|
8.43
|
31.42
|
28.59
|
2.1
|
4
|
<0.10
|
0.282
|
SE
|
|
CE
|
20200516
|
Sunny
|
Moderate
|
Mid-Ebb
|
Bottom
|
11.1
|
8:00
|
9.38
|
8.46
|
30.23
|
28.87
|
1.87
|
3
|
<0.10
|
0.437
|
SE
|
|
CE
|
20200516
|
Sunny
|
Moderate
|
Mid-Ebb
|
Middle
|
6.05
|
8:01
|
8.55
|
8.35
|
30.24
|
28.73
|
1.49
|
3
|
<0.10
|
0.284
|
E
|
|
CE
|
20200516
|
Sunny
|
Moderate
|
Mid-Ebb
|
Middle
|
6.05
|
8:01
|
8.3
|
8.38
|
30.15
|
28.58
|
1.75
|
4
|
<0.10
|
0.345
|
E
|
|
CE
|
20200516
|
Sunny
|
Moderate
|
Mid-Ebb
|
Surface
|
1
|
8:02
|
9.09
|
8.47
|
30.97
|
28.57
|
1.49
|
3
|
<0.10
|
0.428
|
SE
|
|
CE
|
20200516
|
Sunny
|
Moderate
|
Mid-Ebb
|
Surface
|
1
|
8:02
|
8.31
|
8.37
|
30.08
|
28.59
|
1.76
|
2
|
<0.10
|
0.266
|
E
|
|
CF
|
20200516
|
Sunny
|
Moderate
|
Mid-Ebb
|
Bottom
|
12.2
|
8:01
|
8.33
|
8.41
|
31.61
|
28.92
|
2.13
|
5
|
<0.10
|
0.186
|
SE
|
|
CF
|
20200516
|
Sunny
|
Moderate
|
Mid-Ebb
|
Bottom
|
12.2
|
8:01
|
8.43
|
8.42
|
31.28
|
28.74
|
1.97
|
4
|
<0.10
|
0.133
|
E
|
|
CF
|
20200516
|
Sunny
|
Moderate
|
Mid-Ebb
|
Middle
|
6.6
|
8:02
|
8.64
|
8.53
|
31.06
|
28.84
|
1.79
|
3
|
<0.10
|
0.194
|
SE
|
|
CF
|
20200516
|
Sunny
|
Moderate
|
Mid-Ebb
|
Middle
|
6.6
|
8:02
|
9.26
|
8.41
|
31.54
|
28.77
|
2.16
|
4
|
<0.10
|
0.188
|
SE
|
|
CF
|
20200516
|
Sunny
|
Moderate
|
Mid-Ebb
|
Surface
|
1
|
8:03
|
9.35
|
8.37
|
30.99
|
28.84
|
1.97
|
3
|
<0.10
|
0.142
|
SE
|
|
CF
|
20200516
|
Sunny
|
Moderate
|
Mid-Ebb
|
Surface
|
1
|
8:03
|
8.57
|
8.53
|
31.68
|
28.55
|
1.99
|
4
|
<0.10
|
0.162
|
SE
|
|
NF1
|
20200516
|
Sunny
|
Moderate
|
Mid-Ebb
|
Bottom
|
9.9
|
8:40
|
8.14
|
8.55
|
30.35
|
29.05
|
1.89
|
4
|
<0.10
|
0.181
|
SE
|
|
NF1
|
20200516
|
Sunny
|
Moderate
|
Mid-Ebb
|
Bottom
|
9.9
|
8:40
|
9.28
|
8.53
|
29.89
|
28.98
|
2.01
|
4
|
<0.10
|
0.18
|
SE
|
|
NF1
|
20200516
|
Sunny
|
Moderate
|
Mid-Ebb
|
Middle
|
5.45
|
8:41
|
8.62
|
8.32
|
30.11
|
28.85
|
1.29
|
2
|
<0.10
|
0.171
|
SE
|
|
NF1
|
20200516
|
Sunny
|
Moderate
|
Mid-Ebb
|
Middle
|
5.45
|
8:41
|
9.25
|
8.55
|
31.47
|
29.1
|
1.05
|
4
|
<0.10
|
0.182
|
SE
|
|
NF1
|
20200516
|
Sunny
|
Moderate
|
Mid-Ebb
|
Surface
|
1
|
8:42
|
9.07
|
8.53
|
31.53
|
29.02
|
1.91
|
3
|
<0.10
|
0.196
|
SE
|
|
NF1
|
20200516
|
Sunny
|
Moderate
|
Mid-Ebb
|
Surface
|
1
|
8:42
|
8.5
|
8.55
|
30.08
|
28.91
|
1.88
|
3
|
<0.10
|
0.138
|
SE
|
|
NF2
|
20200516
|
Sunny
|
Moderate
|
Mid-Ebb
|
Bottom
|
9.3
|
10:12
|
8.74
|
8.38
|
31.66
|
28.99
|
1.7
|
7
|
<0.10
|
0.219
|
SE
|
|
NF2
|
20200516
|
Sunny
|
Moderate
|
Mid-Ebb
|
Bottom
|
9.3
|
10:12
|
8.31
|
8.35
|
31.11
|
29.19
|
1.48
|
6
|
<0.10
|
0.21
|
SE
|
|
NF2
|
20200516
|
Sunny
|
Moderate
|
Mid-Ebb
|
Middle
|
5.15
|
10:13
|
9.09
|
8.44
|
30.48
|
29.01
|
1.54
|
5
|
<0.10
|
0.14
|
E
|
|
NF2
|
20200516
|
Sunny
|
Moderate
|
Mid-Ebb
|
Middle
|
5.15
|
10:13
|
9.21
|
8.44
|
31.09
|
29.26
|
1.24
|
4
|
<0.10
|
0.216
|
E
|
|
NF2
|
20200516
|
Sunny
|
Moderate
|
Mid-Ebb
|
Surface
|
1
|
10:14
|
9.21
|
8.56
|
30.33
|
29.09
|
1.52
|
3
|
<0.10
|
0.214
|
E
|
|
NF2
|
20200516
|
Sunny
|
Moderate
|
Mid-Ebb
|
Surface
|
1
|
10:14
|
9.13
|
8.47
|
29.94
|
29.11
|
1.42
|
4
|
<0.10
|
0.166
|
SE
|
|
NF3
|
20200516
|
Sunny
|
Moderate
|
Mid-Ebb
|
Bottom
|
10
|
10:22
|
8.67
|
8.36
|
30.09
|
29.3
|
1.96
|
4
|
<0.10
|
0.171
|
E
|
|
NF3
|
20200516
|
Sunny
|
Moderate
|
Mid-Ebb
|
Bottom
|
10
|
10:22
|
9.2
|
8.48
|
31.16
|
29.11
|
1.75
|
3
|
<0.10
|
0.211
|
SE
|
|
NF3
|
20200516
|
Sunny
|
Moderate
|
Mid-Ebb
|
Middle
|
5.5
|
10:23
|
9.31
|
8.37
|
31.2
|
29.28
|
1.17
|
4
|
<0.10
|
0.17
|
SE
|
|
NF3
|
20200516
|
Sunny
|
Moderate
|
Mid-Ebb
|
Middle
|
5.5
|
10:23
|
8.47
|
8.53
|
30.83
|
29.04
|
1.69
|
4
|
<0.10
|
0.193
|
SE
|
|
NF3
|
20200516
|
Sunny
|
Moderate
|
Mid-Ebb
|
Surface
|
1
|
10:24
|
8.27
|
8.32
|
30.86
|
29.25
|
1.5
|
4
|
<0.10
|
0.158
|
E
|
|
NF3
|
20200516
|
Sunny
|
Moderate
|
Mid-Ebb
|
Surface
|
1
|
10:24
|
8.53
|
8.32
|
30.09
|
29.32
|
1.9
|
4
|
<0.10
|
0.13
|
E
|
|
WSR01
|
20200516
|
Sunny
|
Moderate
|
Mid-Ebb
|
Bottom
|
8.4
|
10:50
|
9.41
|
8.48
|
29.71
|
29.2
|
1.8
|
4
|
<0.10
|
0.157
|
SE
|
|
WSR01
|
20200516
|
Sunny
|
Moderate
|
Mid-Ebb
|
Bottom
|
8.4
|
10:50
|
8.54
|
8.43
|
30.78
|
29.31
|
1.86
|
4
|
<0.10
|
0.148
|
E
|
|
WSR01
|
20200516
|
Sunny
|
Moderate
|
Mid-Ebb
|
Middle
|
4.7
|
10:51
|
9.32
|
8.56
|
31.12
|
29.35
|
1.5
|
3
|
<0.10
|
0.179
|
E
|
|
WSR01
|
20200516
|
Sunny
|
Moderate
|
Mid-Ebb
|
Middle
|
4.7
|
10:51
|
9.25
|
8.41
|
30.57
|
29.22
|
1.24
|
2
|
<0.10
|
0.153
|
SE
|
|
WSR01
|
20200516
|
Sunny
|
Moderate
|
Mid-Ebb
|
Surface
|
1
|
10:52
|
8.84
|
8.46
|
31.43
|
28.98
|
1.5
|
3
|
<0.10
|
0.165
|
E
|
|
WSR01
|
20200516
|
Sunny
|
Moderate
|
Mid-Ebb
|
Surface
|
1
|
10:52
|
8.16
|
8.31
|
29.93
|
29
|
1.13
|
3
|
<0.10
|
0.155
|
SE
|
|
WSR02
|
20200516
|
Sunny
|
Moderate
|
Mid-Ebb
|
Bottom
|
8
|
10:27
|
8.35
|
8.41
|
31.06
|
29.02
|
2.07
|
8
|
<0.10
|
0.168
|
E
|
|
WSR02
|
20200516
|
Sunny
|
Moderate
|
Mid-Ebb
|
Bottom
|
8
|
10:27
|
8.64
|
8.44
|
29.81
|
29.06
|
2.21
|
6
|
<0.10
|
0.143
|
SE
|
|
WSR02
|
20200516
|
Sunny
|
Moderate
|
Mid-Ebb
|
Middle
|
4.5
|
10:28
|
8.78
|
8.4
|
30.6
|
29.28
|
1.52
|
7
|
<0.10
|
0.191
|
E
|
|
WSR02
|
20200516
|
Sunny
|
Moderate
|
Mid-Ebb
|
Middle
|
4.5
|
10:28
|
8.84
|
8.53
|
30.22
|
28.99
|
1.29
|
7
|
<0.10
|
0.162
|
E
|
|
WSR02
|
20200516
|
Sunny
|
Moderate
|
Mid-Ebb
|
Surface
|
1
|
10:29
|
8.42
|
8.42
|
30.72
|
29.28
|
1.66
|
4
|
<0.10
|
0.196
|
SE
|
|
WSR02
|
20200516
|
Sunny
|
Moderate
|
Mid-Ebb
|
Surface
|
1
|
10:29
|
9.27
|
8.38
|
29.76
|
29.01
|
1.59
|
3
|
<0.10
|
0.188
|
SE
|
|
WSR03
|
20200516
|
Sunny
|
Moderate
|
Mid-Ebb
|
Bottom
|
6.7
|
9:56
|
8.87
|
8.39
|
30.69
|
28.91
|
1.99
|
4
|
<0.10
|
0.212
|
E
|
|
WSR03
|
20200516
|
Sunny
|
Moderate
|
Mid-Ebb
|
Bottom
|
6.7
|
9:56
|
8.48
|
8.51
|
30.64
|
28.95
|
1.73
|
3
|
<0.10
|
0.167
|
SE
|
|
WSR03
|
20200516
|
Sunny
|
Moderate
|
Mid-Ebb
|
Middle
|
3.85
|
9:57
|
8.24
|
8.47
|
30.34
|
29.34
|
1.38
|
5
|
<0.10
|
0.211
|
SE
|
|
WSR03
|
20200516
|
Sunny
|
Moderate
|
Mid-Ebb
|
Middle
|
3.85
|
9:57
|
8.62
|
8.44
|
29.65
|
29.08
|
1.73
|
6
|
<0.10
|
0.218
|
E
|
|
WSR03
|
20200516
|
Sunny
|
Moderate
|
Mid-Ebb
|
Surface
|
1
|
9:58
|
8.55
|
8.56
|
31.15
|
29.09
|
1.16
|
7
|
<0.10
|
0.169
|
E
|
|
WSR03
|
20200516
|
Sunny
|
Moderate
|
Mid-Ebb
|
Surface
|
1
|
9:58
|
8.66
|
8.43
|
31.37
|
29.02
|
1.58
|
6
|
<0.10
|
0.165
|
SE
|
|
WSR04
|
20200516
|
Sunny
|
Moderate
|
Mid-Ebb
|
Bottom
|
6.8
|
9:40
|
9.29
|
8.47
|
30.53
|
29.22
|
1.85
|
2
|
<0.10
|
0.18
|
SE
|
|
WSR04
|
20200516
|
Sunny
|
Moderate
|
Mid-Ebb
|
Bottom
|
6.8
|
9:40
|
8.5
|
8.53
|
31.01
|
29.14
|
1.72
|
2
|
<0.10
|
0.169
|
E
|
|
WSR04
|
20200516
|
Sunny
|
Moderate
|
Mid-Ebb
|
Middle
|
3.9
|
9:41
|
9.16
|
8.39
|
30.3
|
29.26
|
1.58
|
3
|
<0.10
|
0.144
|
E
|
|
WSR04
|
20200516
|
Sunny
|
Moderate
|
Mid-Ebb
|
Middle
|
3.9
|
9:41
|
8.87
|
8.5
|
29.7
|
28.91
|
1.2
|
2
|
<0.10
|
0.171
|
SE
|
|
WSR04
|
20200516
|
Sunny
|
Moderate
|
Mid-Ebb
|
Surface
|
1
|
9:42
|
8.96
|
8.42
|
29.8
|
29.12
|
1.64
|
3
|
<0.10
|
0.22
|
E
|
|
WSR04
|
20200516
|
Sunny
|
Moderate
|
Mid-Ebb
|
Surface
|
1
|
9:42
|
8.28
|
8.42
|
30.57
|
29.13
|
1.88
|
3
|
<0.10
|
0.203
|
SE
|
|
WSR16
|
20200516
|
Sunny
|
Moderate
|
Mid-Ebb
|
Bottom
|
10.8
|
8:19
|
9.01
|
8.35
|
30.64
|
28.7
|
1.92
|
2
|
<0.10
|
0.222
|
E
|
|
WSR16
|
20200516
|
Sunny
|
Moderate
|
Mid-Ebb
|
Bottom
|
10.8
|
8:19
|
8.81
|
8.45
|
30.1
|
28.77
|
2.31
|
2
|
<0.10
|
0.23
|
SE
|
|
WSR16
|
20200516
|
Sunny
|
Moderate
|
Mid-Ebb
|
Middle
|
5.9
|
8:20
|
8.27
|
8.33
|
31.56
|
28.77
|
1.72
|
2
|
<0.10
|
0.214
|
E
|
|
WSR16
|
20200516
|
Sunny
|
Moderate
|
Mid-Ebb
|
Middle
|
5.9
|
8:20
|
8.53
|
8.56
|
30.51
|
28.94
|
1.54
|
3
|
<0.10
|
0.182
|
SE
|
|
WSR16
|
20200516
|
Sunny
|
Moderate
|
Mid-Ebb
|
Surface
|
1
|
8:21
|
9.33
|
8.49
|
30.81
|
28.68
|
1.44
|
3
|
<0.10
|
0.153
|
SE
|
|
WSR16
|
20200516
|
Sunny
|
Moderate
|
Mid-Ebb
|
Surface
|
1
|
8:21
|
8.55
|
8.36
|
30.57
|
28.64
|
1.62
|
2
|
<0.10
|
0.142
|
SE
|
|
WSR33
|
20200516
|
Sunny
|
Moderate
|
Mid-Ebb
|
Bottom
|
6.1
|
9:22
|
8.47
|
8.54
|
29.63
|
29.03
|
1.4
|
4
|
<0.10
|
0.132
|
E
|
|
WSR33
|
20200516
|
Sunny
|
Moderate
|
Mid-Ebb
|
Bottom
|
6.1
|
9:22
|
9.02
|
8.33
|
29.97
|
29.36
|
1.98
|
5
|
<0.10
|
0.155
|
E
|
|
WSR33
|
20200516
|
Sunny
|
Moderate
|
Mid-Ebb
|
Middle
|
3.55
|
9:23
|
8.37
|
8.41
|
31.33
|
29.13
|
1.78
|
4
|
<0.10
|
0.186
|
E
|
|
WSR33
|
20200516
|
Sunny
|
Moderate
|
Mid-Ebb
|
Middle
|
3.55
|
9:23
|
8.53
|
8.34
|
30.74
|
29
|
1.12
|
4
|
<0.10
|
0.186
|
SE
|
|
WSR33
|
20200516
|
Sunny
|
Moderate
|
Mid-Ebb
|
Surface
|
1
|
9:24
|
9.19
|
8.33
|
30.28
|
29.26
|
1.27
|
4
|
<0.10
|
0.182
|
E
|
|
WSR33
|
20200516
|
Sunny
|
Moderate
|
Mid-Ebb
|
Surface
|
1
|
9:24
|
9.3
|
8.32
|
31.21
|
29.19
|
1.74
|
3
|
<0.10
|
0.18
|
SE
|
|
WSR36
|
20200516
|
Sunny
|
Moderate
|
Mid-Ebb
|
Bottom
|
4.5
|
9:09
|
9.35
|
8.43
|
30.69
|
29
|
2.17
|
5
|
<0.10
|
0.181
|
SE
|
|
WSR36
|
20200516
|
Sunny
|
Moderate
|
Mid-Ebb
|
Bottom
|
4.5
|
9:09
|
9.07
|
8.36
|
31.78
|
29.35
|
2.11
|
4
|
<0.10
|
0.2
|
SE
|
|
WSR36
|
20200516
|
Sunny
|
Moderate
|
Mid-Ebb
|
Surface
|
1
|
9:10
|
9.24
|
8.43
|
31.15
|
29.03
|
1.11
|
3
|
<0.10
|
0.148
|
SE
|
|
WSR36
|
20200516
|
Sunny
|
Moderate
|
Mid-Ebb
|
Surface
|
1
|
9:10
|
8.61
|
8.54
|
31.68
|
29.01
|
1.24
|
4
|
<0.10
|
0.158
|
E
|
|
WSR37
|
20200516
|
Sunny
|
Moderate
|
Mid-Ebb
|
Bottom
|
7.5
|
8:53
|
8.53
|
8.5
|
31.45
|
29.14
|
2.12
|
5
|
<0.10
|
0.209
|
SE
|
|
WSR37
|
20200516
|
Sunny
|
Moderate
|
Mid-Ebb
|
Bottom
|
7.5
|
8:53
|
8.8
|
8.56
|
30.15
|
28.9
|
1.63
|
4
|
<0.10
|
0.205
|
E
|
|
WSR37
|
20200516
|
Sunny
|
Moderate
|
Mid-Ebb
|
Middle
|
4.25
|
8:54
|
9.15
|
8.39
|
31.37
|
29.08
|
1.58
|
3
|
<0.10
|
0.189
|
E
|
|
WSR37
|
20200516
|
Sunny
|
Moderate
|
Mid-Ebb
|
Middle
|
4.25
|
8:54
|
8.92
|
8.31
|
31.59
|
29.02
|
1.45
|
4
|
<0.10
|
0.192
|
E
|
|
WSR37
|
20200516
|
Sunny
|
Moderate
|
Mid-Ebb
|
Surface
|
1
|
8:55
|
8.72
|
8.34
|
31.14
|
28.91
|
1.15
|
4
|
<0.10
|
0.207
|
E
|
|
WSR37
|
20200516
|
Sunny
|
Moderate
|
Mid-Ebb
|
Surface
|
1
|
8:55
|
8.57
|
8.32
|
30.03
|
28.98
|
1.71
|
2
|
<0.10
|
0.191
|
SE
|
|
CE
|
20200516
|
Sunny
|
Moderate
|
Mid-Flood
|
Bottom
|
12
|
11:55
|
8.21
|
8.3
|
29.95
|
29.14
|
2.19
|
4
|
<0.10
|
0.172
|
N
|
|
CE
|
20200516
|
Sunny
|
Moderate
|
Mid-Flood
|
Bottom
|
12
|
11:55
|
8.31
|
8.43
|
30.76
|
29.2
|
2.17
|
3
|
<0.10
|
0.193
|
NW
|
|
CE
|
20200516
|
Sunny
|
Moderate
|
Mid-Flood
|
Middle
|
6.5
|
11:56
|
8.57
|
8.44
|
31.3
|
28.93
|
1.44
|
3
|
<0.10
|
0.182
|
N
|
|
CE
|
20200516
|
Sunny
|
Moderate
|
Mid-Flood
|
Middle
|
6.5
|
11:56
|
8.72
|
8.31
|
30.73
|
29.09
|
1.15
|
4
|
<0.10
|
0.21
|
NW
|
|
CE
|
20200516
|
Sunny
|
Moderate
|
Mid-Flood
|
Surface
|
1
|
11:57
|
8.59
|
8.51
|
30.61
|
29.03
|
1.45
|
<2
|
<0.10
|
0.221
|
NW
|
|
CE
|
20200516
|
Sunny
|
Moderate
|
Mid-Flood
|
Surface
|
1
|
11:57
|
8.76
|
8.28
|
29.97
|
29.18
|
1.72
|
<2
|
<0.10
|
0.202
|
NW
|
|
CF
|
20200516
|
Sunny
|
Moderate
|
Mid-Flood
|
Bottom
|
11.3
|
11:51
|
8.61
|
8.23
|
29.95
|
29.12
|
1.79
|
5
|
<0.10
|
0.2
|
SW
|
|
CF
|
20200516
|
Sunny
|
Moderate
|
Mid-Flood
|
Bottom
|
11.3
|
11:51
|
9.11
|
8.49
|
30.6
|
29.2
|
1.64
|
4
|
<0.10
|
0.238
|
W
|
|
CF
|
20200516
|
Sunny
|
Moderate
|
Mid-Flood
|
Middle
|
6.15
|
11:52
|
8.59
|
8.27
|
30.88
|
29.12
|
1.67
|
4
|
<0.10
|
0.172
|
NW
|
|
CF
|
20200516
|
Sunny
|
Moderate
|
Mid-Flood
|
Middle
|
6.15
|
11:52
|
9.05
|
8.23
|
30.7
|
29.02
|
1.59
|
3
|
<0.10
|
0.161
|
W
|
|
CF
|
20200516
|
Sunny
|
Moderate
|
Mid-Flood
|
Surface
|
1
|
11:53
|
8.6
|
8.43
|
30.68
|
29.17
|
2
|
3
|
<0.10
|
0.219
|
W
|
|
CF
|
20200516
|
Sunny
|
Moderate
|
Mid-Flood
|
Surface
|
1
|
11:53
|
8.65
|
8.23
|
30.2
|
29.16
|
1.25
|
4
|
<0.10
|
0.193
|
W
|
|
NF1
|
20200516
|
Sunny
|
Moderate
|
Mid-Flood
|
Bottom
|
9.6
|
12:34
|
8.36
|
8.41
|
30.18
|
29.21
|
1.6
|
2
|
<0.10
|
0.138
|
W
|
|
NF1
|
20200516
|
Sunny
|
Moderate
|
Mid-Flood
|
Bottom
|
9.6
|
12:34
|
8.8
|
8.37
|
31.24
|
29.21
|
1.65
|
3
|
<0.10
|
0.144
|
NW
|
|
NF1
|
20200516
|
Sunny
|
Moderate
|
Mid-Flood
|
Middle
|
5.3
|
12:35
|
8.27
|
8.25
|
30.89
|
29.1
|
1.54
|
2
|
<0.10
|
0.154
|
NW
|
|
NF1
|
20200516
|
Sunny
|
Moderate
|
Mid-Flood
|
Middle
|
5.3
|
12:35
|
8.97
|
8.41
|
30.93
|
29.06
|
1.7
|
3
|
<0.10
|
0.151
|
W
|
|
NF1
|
20200516
|
Sunny
|
Moderate
|
Mid-Flood
|
Surface
|
1
|
12:36
|
9.03
|
8.36
|
30.29
|
29.2
|
2
|
<2
|
<0.10
|
0.141
|
W
|
|
NF1
|
20200516
|
Sunny
|
Moderate
|
Mid-Flood
|
Surface
|
1
|
12:36
|
8.95
|
8.48
|
31.53
|
29.22
|
1.94
|
<2
|
<0.10
|
0.14
|
W
|
|
NF2
|
20200516
|
Sunny
|
Moderate
|
Mid-Flood
|
Bottom
|
9.2
|
14:10
|
8.34
|
8.27
|
30.33
|
29
|
1.88
|
5
|
<0.10
|
0.177
|
SW
|
|
NF2
|
20200516
|
Sunny
|
Moderate
|
Mid-Flood
|
Bottom
|
9.2
|
14:10
|
8.41
|
8.28
|
30.42
|
29.28
|
1.68
|
6
|
<0.10
|
0.165
|
W
|
|
NF2
|
20200516
|
Sunny
|
Moderate
|
Mid-Flood
|
Middle
|
5.1
|
14:11
|
8.21
|
8.51
|
31.78
|
29.24
|
1.42
|
5
|
<0.10
|
0.196
|
W
|
|
NF2
|
20200516
|
Sunny
|
Moderate
|
Mid-Flood
|
Middle
|
5.1
|
14:11
|
8.56
|
8.47
|
31.32
|
29.14
|
1.44
|
4
|
<0.10
|
0.129
|
W
|
|
NF2
|
20200516
|
Sunny
|
Moderate
|
Mid-Flood
|
Surface
|
1
|
14:12
|
8.03
|
8.26
|
31.64
|
29.19
|
1.24
|
3
|
<0.10
|
0.157
|
SW
|
|
NF2
|
20200516
|
Sunny
|
Moderate
|
Mid-Flood
|
Surface
|
1
|
14:12
|
8.03
|
8.23
|
30.27
|
29.29
|
1.65
|
4
|
<0.10
|
0.133
|
NW
|
|
NF3
|
20200516
|
Sunny
|
Moderate
|
Mid-Flood
|
Bottom
|
9.5
|
14:21
|
8.68
|
8.23
|
31.48
|
29.11
|
1.95
|
3
|
<0.10
|
0.147
|
W
|
|
NF3
|
20200516
|
Sunny
|
Moderate
|
Mid-Flood
|
Bottom
|
9.5
|
14:21
|
8.5
|
8.37
|
31.43
|
28.95
|
1.65
|
3
|
<0.10
|
0.134
|
W
|
|
NF3
|
20200516
|
Sunny
|
Moderate
|
Mid-Flood
|
Middle
|
5.25
|
14:22
|
8.26
|
8.51
|
31.77
|
28.93
|
1.9
|
4
|
<0.10
|
0.172
|
NW
|
|
NF3
|
20200516
|
Sunny
|
Moderate
|
Mid-Flood
|
Middle
|
5.25
|
14:22
|
8.19
|
8.43
|
31.2
|
29.11
|
1.11
|
3
|
<0.10
|
0.133
|
W
|
|
NF3
|
20200516
|
Sunny
|
Moderate
|
Mid-Flood
|
Surface
|
1
|
14:23
|
8.81
|
8.4
|
31.29
|
29.14
|
1.51
|
3
|
<0.10
|
0.188
|
NW
|
|
NF3
|
20200516
|
Sunny
|
Moderate
|
Mid-Flood
|
Surface
|
1
|
14:23
|
8.5
|
8.26
|
31.77
|
29
|
1.67
|
4
|
<0.10
|
0.138
|
NW
|
|
WSR01
|
20200516
|
Sunny
|
Moderate
|
Mid-Flood
|
Bottom
|
8.5
|
14:44
|
8.62
|
8.32
|
31.13
|
29.17
|
1.86
|
3
|
<0.10
|
0.174
|
W
|
|
WSR01
|
20200516
|
Sunny
|
Moderate
|
Mid-Flood
|
Bottom
|
8.5
|
14:44
|
8.65
|
8.3
|
31.5
|
28.99
|
1.77
|
4
|
<0.10
|
0.186
|
W
|
|
WSR01
|
20200516
|
Sunny
|
Moderate
|
Mid-Flood
|
Middle
|
4.75
|
14:45
|
9.09
|
8.31
|
30.53
|
29.13
|
1.97
|
4
|
<0.10
|
0.179
|
W
|
|
WSR01
|
20200516
|
Sunny
|
Moderate
|
Mid-Flood
|
Middle
|
4.75
|
14:45
|
8.52
|
8.34
|
31.8
|
29.18
|
1.81
|
2
|
<0.10
|
0.16
|
W
|
|
WSR01
|
20200516
|
Sunny
|
Moderate
|
Mid-Flood
|
Surface
|
1
|
14:46
|
8.54
|
8.42
|
31.8
|
29.02
|
1.86
|
5
|
<0.10
|
0.147
|
NW
|
|
WSR01
|
20200516
|
Sunny
|
Moderate
|
Mid-Flood
|
Surface
|
1
|
14:46
|
9.12
|
8.27
|
30.54
|
29.18
|
1.27
|
5
|
<0.10
|
0.16
|
NW
|
|
WSR02
|
20200516
|
Sunny
|
Moderate
|
Mid-Flood
|
Bottom
|
8
|
14:20
|
8.17
|
8.45
|
30.61
|
29.05
|
1.76
|
7
|
<0.10
|
0.18
|
W
|
|
WSR02
|
20200516
|
Sunny
|
Moderate
|
Mid-Flood
|
Bottom
|
8
|
14:20
|
8.94
|
8.32
|
31.12
|
29.07
|
1.57
|
7
|
<0.10
|
0.172
|
W
|
|
WSR02
|
20200516
|
Sunny
|
Moderate
|
Mid-Flood
|
Middle
|
4.5
|
14:21
|
8.31
|
8.53
|
29.99
|
29.2
|
1.67
|
3
|
<0.10
|
0.192
|
W
|
|
WSR02
|
20200516
|
Sunny
|
Moderate
|
Mid-Flood
|
Middle
|
4.5
|
14:21
|
8.14
|
8.32
|
30.92
|
28.99
|
1.67
|
4
|
<0.10
|
0.153
|
W
|
|
WSR02
|
20200516
|
Sunny
|
Moderate
|
Mid-Flood
|
Surface
|
1
|
14:22
|
8.52
|
8.48
|
31.43
|
28.98
|
1.82
|
2
|
<0.10
|
0.153
|
W
|
|
WSR02
|
20200516
|
Sunny
|
Moderate
|
Mid-Flood
|
Surface
|
1
|
14:22
|
8.31
|
8.4
|
31.42
|
28.93
|
1.57
|
2
|
<0.10
|
0.196
|
SW
|
|
WSR03
|
20200516
|
Sunny
|
Moderate
|
Mid-Flood
|
Bottom
|
7.3
|
13:52
|
7.98
|
8.3
|
29.98
|
29.31
|
1.59
|
7
|
<0.10
|
0.165
|
W
|
|
WSR03
|
20200516
|
Sunny
|
Moderate
|
Mid-Flood
|
Bottom
|
7.3
|
13:52
|
8.35
|
8.53
|
30.63
|
29.1
|
1.73
|
8
|
<0.10
|
0.175
|
W
|
|
WSR03
|
20200516
|
Sunny
|
Moderate
|
Mid-Flood
|
Middle
|
4.15
|
13:53
|
8.48
|
8.52
|
31.44
|
29.12
|
1.85
|
6
|
<0.10
|
0.168
|
NW
|
|
WSR03
|
20200516
|
Sunny
|
Moderate
|
Mid-Flood
|
Middle
|
4.15
|
13:53
|
9.05
|
8.47
|
31.82
|
29.18
|
1.41
|
7
|
<0.10
|
0.138
|
W
|
|
WSR03
|
20200516
|
Sunny
|
Moderate
|
Mid-Flood
|
Surface
|
1
|
13:54
|
8.14
|
8.5
|
31.16
|
29.07
|
1.25
|
4
|
<0.10
|
0.133
|
NW
|
|
WSR03
|
20200516
|
Sunny
|
Moderate
|
Mid-Flood
|
Surface
|
1
|
13:54
|
8
|
8.27
|
30.97
|
29.11
|
1.35
|
5
|
<0.10
|
0.186
|
W
|
|
WSR04
|
20200516
|
Sunny
|
Moderate
|
Mid-Flood
|
Bottom
|
6.7
|
13:34
|
8.04
|
8.44
|
31.29
|
29
|
1.93
|
6
|
<0.10
|
0.144
|
W
|
|
WSR04
|
20200516
|
Sunny
|
Moderate
|
Mid-Flood
|
Bottom
|
6.7
|
13:34
|
9.16
|
8.38
|
30.84
|
29.1
|
2.19
|
5
|
<0.10
|
0.132
|
SW
|
|
WSR04
|
20200516
|
Sunny
|
Moderate
|
Mid-Flood
|
Middle
|
3.85
|
13:35
|
8.13
|
8.43
|
30.45
|
29.21
|
1.76
|
4
|
<0.10
|
0.148
|
W
|
|
WSR04
|
20200516
|
Sunny
|
Moderate
|
Mid-Flood
|
Middle
|
3.85
|
13:35
|
8.49
|
8.27
|
30.44
|
29.19
|
1.24
|
3
|
<0.10
|
0.17
|
W
|
|
WSR04
|
20200516
|
Sunny
|
Moderate
|
Mid-Flood
|
Surface
|
1
|
13:36
|
8.08
|
8.49
|
31.68
|
29.09
|
1.26
|
4
|
<0.10
|
0.165
|
W
|
|
WSR04
|
20200516
|
Sunny
|
Moderate
|
Mid-Flood
|
Surface
|
1
|
13:36
|
8.85
|
8.5
|
29.99
|
29.09
|
1.3
|
3
|
<0.10
|
0.136
|
W
|
|
WSR16
|
20200516
|
Sunny
|
Moderate
|
Mid-Flood
|
Bottom
|
10.8
|
12:14
|
9.07
|
8.4
|
31.41
|
29.07
|
2.34
|
4
|
<0.10
|
0.189
|
NW
|
|
WSR16
|
20200516
|
Sunny
|
Moderate
|
Mid-Flood
|
Bottom
|
10.8
|
12:14
|
8.22
|
8.37
|
30.42
|
28.94
|
2.11
|
3
|
<0.10
|
0.161
|
NW
|
|
WSR16
|
20200516
|
Sunny
|
Moderate
|
Mid-Flood
|
Middle
|
5.9
|
12:15
|
8.08
|
8.42
|
30.81
|
29.06
|
1.15
|
4
|
<0.10
|
0.187
|
NW
|
|
WSR16
|
20200516
|
Sunny
|
Moderate
|
Mid-Flood
|
Middle
|
5.9
|
12:15
|
9.08
|
8.44
|
30.36
|
28.99
|
1.68
|
3
|
<0.10
|
0.203
|
N
|
|
WSR16
|
20200516
|
Sunny
|
Moderate
|
Mid-Flood
|
Surface
|
1
|
12:16
|
8.44
|
8.52
|
30.87
|
29.24
|
2.03
|
4
|
<0.10
|
0.19
|
NW
|
|
WSR16
|
20200516
|
Sunny
|
Moderate
|
Mid-Flood
|
Surface
|
1
|
12:16
|
8.17
|
8.3
|
30.76
|
29.13
|
1.54
|
4
|
<0.10
|
0.208
|
NW
|
|
WSR33
|
20200516
|
Sunny
|
Moderate
|
Mid-Flood
|
Bottom
|
6.6
|
13:17
|
8.3
|
8.53
|
31.25
|
29
|
1.59
|
4
|
<0.10
|
0.192
|
W
|
|
WSR33
|
20200516
|
Sunny
|
Moderate
|
Mid-Flood
|
Bottom
|
6.6
|
13:17
|
9.12
|
8.24
|
31.64
|
29.1
|
1.72
|
4
|
<0.10
|
0.176
|
NW
|
|
WSR33
|
20200516
|
Sunny
|
Moderate
|
Mid-Flood
|
Middle
|
3.8
|
13:18
|
8.64
|
8.5
|
30.06
|
29.07
|
1.2
|
4
|
<0.10
|
0.191
|
W
|
|
WSR33
|
20200516
|
Sunny
|
Moderate
|
Mid-Flood
|
Middle
|
3.8
|
13:18
|
9.17
|
8.21
|
31.77
|
29.2
|
1.21
|
3
|
<0.10
|
0.167
|
W
|
|
WSR33
|
20200516
|
Sunny
|
Moderate
|
Mid-Flood
|
Surface
|
1
|
13:19
|
8.11
|
8.25
|
30.77
|
29.07
|
1.49
|
3
|
<0.10
|
0.14
|
NW
|
|
WSR33
|
20200516
|
Sunny
|
Moderate
|
Mid-Flood
|
Surface
|
1
|
13:19
|
8.83
|
8.24
|
31.49
|
29.19
|
1.89
|
4
|
<0.10
|
0.136
|
NW
|
|
WSR36
|
20200516
|
Sunny
|
Moderate
|
Mid-Flood
|
Bottom
|
4.6
|
13:03
|
8.17
|
8.35
|
31.55
|
29.3
|
2.01
|
2
|
<0.10
|
0.15
|
SW
|
|
WSR36
|
20200516
|
Sunny
|
Moderate
|
Mid-Flood
|
Bottom
|
4.6
|
13:03
|
8.72
|
8.38
|
30.18
|
29.08
|
2.06
|
3
|
<0.10
|
0.144
|
SW
|
|
WSR36
|
20200516
|
Sunny
|
Moderate
|
Mid-Flood
|
Surface
|
1
|
13:04
|
8.48
|
8.41
|
31.66
|
29.05
|
1.97
|
2
|
<0.10
|
0.146
|
NW
|
|
WSR36
|
20200516
|
Sunny
|
Moderate
|
Mid-Flood
|
Surface
|
1
|
13:04
|
8.89
|
8.22
|
29.95
|
29.18
|
1.73
|
2
|
<0.10
|
0.19
|
W
|
|
WSR37
|
20200516
|
Sunny
|
Moderate
|
Mid-Flood
|
Bottom
|
7.8
|
12:47
|
8.09
|
8.37
|
29.95
|
29.08
|
1.96
|
3
|
<0.10
|
0.181
|
NW
|
|
WSR37
|
20200516
|
Sunny
|
Moderate
|
Mid-Flood
|
Bottom
|
7.8
|
12:47
|
8.18
|
8.3
|
31.4
|
29.08
|
2.38
|
4
|
<0.10
|
0.145
|
W
|
|
WSR37
|
20200516
|
Sunny
|
Moderate
|
Mid-Flood
|
Middle
|
4.4
|
12:48
|
8.97
|
8.21
|
31.08
|
29.16
|
1.33
|
3
|
<0.10
|
0.158
|
W
|
|
WSR37
|
20200516
|
Sunny
|
Moderate
|
Mid-Flood
|
Middle
|
4.4
|
12:48
|
8.52
|
8.24
|
30.51
|
29.02
|
1.82
|
2
|
<0.10
|
0.185
|
W
|
|
WSR37
|
20200516
|
Sunny
|
Moderate
|
Mid-Flood
|
Surface
|
1
|
12:49
|
8.95
|
8.4
|
30.4
|
29.23
|
1.19
|
2
|
<0.10
|
0.196
|
W
|
|
WSR37
|
20200516
|
Sunny
|
Moderate
|
Mid-Flood
|
Surface
|
1
|
12:49
|
8.88
|
8.5
|
30.98
|
29.09
|
1.72
|
2
|
<0.10
|
0.18
|
W
|
|
CE
|
20200519
|
Cloudy
|
Moderate
|
Mid-Ebb
|
Bottom
|
10.8
|
9:11
|
8.13
|
8.18
|
30.92
|
27.78
|
1.74
|
2
|
<0.10
|
0.438
|
SE
|
|
CE
|
20200519
|
Cloudy
|
Moderate
|
Mid-Ebb
|
Bottom
|
10.8
|
9:11
|
8.82
|
8.3
|
30.56
|
27.54
|
1.52
|
2
|
<0.10
|
0.434
|
SE
|
|
CE
|
20200519
|
Cloudy
|
Moderate
|
Mid-Ebb
|
Middle
|
5.9
|
9:12
|
8.41
|
8.35
|
31.31
|
27.77
|
1
|
2
|
<0.10
|
0.351
|
SE
|
|
CE
|
20200519
|
Cloudy
|
Moderate
|
Mid-Ebb
|
Middle
|
5.9
|
9:12
|
9.07
|
8.14
|
31.16
|
27.64
|
0.94
|
2
|
<0.10
|
0.437
|
SE
|
|
CE
|
20200519
|
Cloudy
|
Moderate
|
Mid-Ebb
|
Surface
|
1
|
9:13
|
8.93
|
8.36
|
30.51
|
27.78
|
1.27
|
2
|
<0.10
|
0.429
|
E
|
|
CE
|
20200519
|
Cloudy
|
Moderate
|
Mid-Ebb
|
Surface
|
1
|
9:13
|
8.08
|
8.12
|
31.1
|
27.8
|
1.12
|
3
|
<0.10
|
0.289
|
SE
|
|
CF
|
20200519
|
Cloudy
|
Moderate
|
Mid-Ebb
|
Bottom
|
12
|
9:16
|
8.11
|
8.24
|
31.66
|
27.5
|
0.91
|
4
|
<0.10
|
0.212
|
E
|
|
CF
|
20200519
|
Cloudy
|
Moderate
|
Mid-Ebb
|
Bottom
|
12
|
9:16
|
8.5
|
8.29
|
30.4
|
27.86
|
1.65
|
3
|
<0.10
|
0.187
|
SE
|
|
CF
|
20200519
|
Cloudy
|
Moderate
|
Mid-Ebb
|
Middle
|
6.5
|
9:17
|
8.32
|
8.3
|
30.64
|
27.66
|
1.34
|
3
|
<0.10
|
0.165
|
E
|
|
CF
|
20200519
|
Cloudy
|
Moderate
|
Mid-Ebb
|
Middle
|
6.5
|
9:17
|
8.2
|
8.33
|
31.25
|
27.54
|
1.45
|
2
|
<0.10
|
0.177
|
E
|
|
CF
|
20200519
|
Cloudy
|
Moderate
|
Mid-Ebb
|
Surface
|
1
|
9:18
|
8.29
|
8.3
|
31.31
|
27.88
|
1.62
|
2
|
<0.10
|
0.136
|
SE
|
|
CF
|
20200519
|
Cloudy
|
Moderate
|
Mid-Ebb
|
Surface
|
1
|
9:18
|
8.53
|
8.21
|
30.53
|
27.69
|
1.07
|
3
|
<0.10
|
0.148
|
E
|
|
NF1
|
20200519
|
Cloudy
|
Moderate
|
Mid-Ebb
|
Bottom
|
9.4
|
9:55
|
9.08
|
8.2
|
30.74
|
27.56
|
1.13
|
4
|
<0.10
|
0.142
|
SE
|
|
NF1
|
20200519
|
Cloudy
|
Moderate
|
Mid-Ebb
|
Bottom
|
9.4
|
9:55
|
8.3
|
8.27
|
30.35
|
27.7
|
1.7
|
3
|
<0.10
|
0.221
|
SE
|
|
NF1
|
20200519
|
Cloudy
|
Moderate
|
Mid-Ebb
|
Middle
|
5.2
|
9:56
|
8.1
|
8.22
|
31.25
|
27.6
|
1.04
|
2
|
<0.10
|
0.136
|
E
|
|
NF1
|
20200519
|
Cloudy
|
Moderate
|
Mid-Ebb
|
Middle
|
5.2
|
9:56
|
8.69
|
8.3
|
31.35
|
27.63
|
1.22
|
2
|
<0.10
|
0.188
|
E
|
|
NF1
|
20200519
|
Cloudy
|
Moderate
|
Mid-Ebb
|
Surface
|
1
|
9:57
|
8.77
|
8.32
|
31.43
|
27.58
|
1.53
|
3
|
<0.10
|
0.204
|
SE
|
|
NF1
|
20200519
|
Cloudy
|
Moderate
|
Mid-Ebb
|
Surface
|
1
|
9:57
|
9.04
|
8.35
|
31.19
|
27.91
|
0.86
|
2
|
<0.10
|
0.218
|
E
|
|
NF2
|
20200519
|
Cloudy
|
Moderate
|
Mid-Ebb
|
Bottom
|
8.4
|
11:28
|
8.65
|
8.36
|
30.71
|
27.51
|
1.59
|
4
|
<0.10
|
0.149
|
E
|
|
NF2
|
20200519
|
Cloudy
|
Moderate
|
Mid-Ebb
|
Bottom
|
8.4
|
11:28
|
8.64
|
8.28
|
31.51
|
27.74
|
1.33
|
4
|
<0.10
|
0.131
|
E
|
|
NF2
|
20200519
|
Cloudy
|
Moderate
|
Mid-Ebb
|
Middle
|
4.7
|
11:29
|
8.26
|
8.11
|
30.58
|
27.6
|
1.72
|
4
|
<0.10
|
0.143
|
SE
|
|
NF2
|
20200519
|
Cloudy
|
Moderate
|
Mid-Ebb
|
Middle
|
4.7
|
11:29
|
8.09
|
8.35
|
30.74
|
27.63
|
0.99
|
2
|
<0.10
|
0.17
|
SE
|
|
NF2
|
20200519
|
Cloudy
|
Moderate
|
Mid-Ebb
|
Surface
|
1
|
11:30
|
8.08
|
8.36
|
31
|
27.84
|
1.23
|
3
|
<0.10
|
0.145
|
E
|
|
NF2
|
20200519
|
Cloudy
|
Moderate
|
Mid-Ebb
|
Surface
|
1
|
11:30
|
8.51
|
8.25
|
30.47
|
27.86
|
1.73
|
3
|
<0.10
|
0.194
|
SE
|
|
NF3
|
20200519
|
Cloudy
|
Moderate
|
Mid-Ebb
|
Bottom
|
9.5
|
11:36
|
8.29
|
8.18
|
31.2
|
27.79
|
1.62
|
<2
|
<0.10
|
0.148
|
SE
|
|
NF3
|
20200519
|
Cloudy
|
Moderate
|
Mid-Ebb
|
Bottom
|
9.5
|
11:36
|
8.1
|
8.27
|
31
|
27.56
|
1.49
|
<2
|
<0.10
|
0.198
|
SE
|
|
NF3
|
20200519
|
Cloudy
|
Moderate
|
Mid-Ebb
|
Middle
|
5.25
|
11:37
|
8.96
|
8.33
|
31.08
|
27.51
|
1.23
|
2
|
<0.10
|
0.218
|
SE
|
|
NF3
|
20200519
|
Cloudy
|
Moderate
|
Mid-Ebb
|
Middle
|
5.25
|
11:37
|
8.31
|
8.23
|
31.65
|
27.61
|
1.35
|
2
|
<0.10
|
0.216
|
SE
|
|
NF3
|
20200519
|
Cloudy
|
Moderate
|
Mid-Ebb
|
Surface
|
1
|
11:38
|
8.52
|
8.27
|
31.17
|
27.52
|
1.37
|
3
|
<0.10
|
0.204
|
E
|
|
NF3
|
20200519
|
Cloudy
|
Moderate
|
Mid-Ebb
|
Surface
|
1
|
11:38
|
8.24
|
8.28
|
31.13
|
27.53
|
1.65
|
2
|
<0.10
|
0.173
|
SE
|
|
WSR01
|
20200519
|
Cloudy
|
Moderate
|
Mid-Ebb
|
Bottom
|
7
|
12:09
|
8.27
|
8.29
|
30.48
|
27.85
|
1.55
|
3
|
<0.10
|
0.134
|
E
|
|
WSR01
|
20200519
|
Cloudy
|
Moderate
|
Mid-Ebb
|
Bottom
|
7
|
12:09
|
8.72
|
8.13
|
31.55
|
27.51
|
0.86
|
2
|
<0.10
|
0.214
|
SE
|
|
WSR01
|
20200519
|
Cloudy
|
Moderate
|
Mid-Ebb
|
Middle
|
4
|
12:10
|
8.99
|
8.18
|
31.45
|
27.7
|
1.57
|
4
|
<0.10
|
0.215
|
E
|
|
WSR01
|
20200519
|
Cloudy
|
Moderate
|
Mid-Ebb
|
Middle
|
4
|
12:10
|
8.31
|
8.29
|
31.21
|
27.77
|
1.73
|
4
|
<0.10
|
0.206
|
E
|
|
WSR01
|
20200519
|
Cloudy
|
Moderate
|
Mid-Ebb
|
Surface
|
1
|
12:11
|
8.95
|
8.21
|
30.85
|
27.77
|
1.29
|
6
|
<0.10
|
0.211
|
SE
|
|
WSR01
|
20200519
|
Cloudy
|
Moderate
|
Mid-Ebb
|
Surface
|
1
|
12:11
|
8.59
|
8.26
|
31.48
|
27.61
|
1.29
|
6
|
<0.10
|
0.153
|
E
|
|
WSR02
|
20200519
|
Cloudy
|
Moderate
|
Mid-Ebb
|
Bottom
|
8.5
|
11:44
|
8.82
|
8.26
|
30.93
|
27.57
|
0.91
|
4
|
<0.10
|
0.175
|
SE
|
|
WSR02
|
20200519
|
Cloudy
|
Moderate
|
Mid-Ebb
|
Bottom
|
8.5
|
11:44
|
8.74
|
8.31
|
31.04
|
27.63
|
0.92
|
3
|
<0.10
|
0.142
|
E
|
|
WSR02
|
20200519
|
Cloudy
|
Moderate
|
Mid-Ebb
|
Middle
|
4.75
|
11:45
|
8.54
|
8.15
|
31.45
|
27.63
|
1.17
|
4
|
<0.10
|
0.179
|
E
|
|
WSR02
|
20200519
|
Cloudy
|
Moderate
|
Mid-Ebb
|
Middle
|
4.75
|
11:45
|
8.55
|
8.31
|
31.12
|
27.53
|
1.49
|
2
|
<0.10
|
0.183
|
SE
|
|
WSR02
|
20200519
|
Cloudy
|
Moderate
|
Mid-Ebb
|
Surface
|
1
|
11:46
|
8.84
|
8.14
|
30.51
|
27.85
|
0.91
|
3
|
<0.10
|
0.179
|
SE
|
|
WSR02
|
20200519
|
Cloudy
|
Moderate
|
Mid-Ebb
|
Surface
|
1
|
11:46
|
9.06
|
8.23
|
30.37
|
27.61
|
1.32
|
2
|
<0.10
|
0.192
|
E
|
|
WSR03
|
20200519
|
Cloudy
|
Moderate
|
Mid-Ebb
|
Bottom
|
6.8
|
11:11
|
8.89
|
8.15
|
31.49
|
27.83
|
1.62
|
3
|
<0.10
|
0.204
|
E
|
|
WSR03
|
20200519
|
Cloudy
|
Moderate
|
Mid-Ebb
|
Bottom
|
6.8
|
11:11
|
8.22
|
8.3
|
31.29
|
27.52
|
1.14
|
4
|
<0.10
|
0.161
|
SE
|
|
WSR03
|
20200519
|
Cloudy
|
Moderate
|
Mid-Ebb
|
Middle
|
3.9
|
11:12
|
8.16
|
8.26
|
31.41
|
27.67
|
1.06
|
3
|
<0.10
|
0.211
|
SE
|
|
WSR03
|
20200519
|
Cloudy
|
Moderate
|
Mid-Ebb
|
Middle
|
3.9
|
11:12
|
8.31
|
8.2
|
31.18
|
27.67
|
1.23
|
3
|
<0.10
|
0.182
|
E
|
|
WSR03
|
20200519
|
Cloudy
|
Moderate
|
Mid-Ebb
|
Surface
|
1
|
11:13
|
8.99
|
8.21
|
31.27
|
27.8
|
0.91
|
3
|
<0.10
|
0.139
|
E
|
|
WSR03
|
20200519
|
Cloudy
|
Moderate
|
Mid-Ebb
|
Surface
|
1
|
11:13
|
9.04
|
8.23
|
30.84
|
27.58
|
1.27
|
2
|
<0.10
|
0.187
|
SE
|
|
WSR04
|
20200519
|
Cloudy
|
Moderate
|
Mid-Ebb
|
Bottom
|
6
|
10:55
|
9
|
8.12
|
31.19
|
27.69
|
1.37
|
2
|
<0.10
|
0.159
|
SE
|
|
WSR04
|
20200519
|
Cloudy
|
Moderate
|
Mid-Ebb
|
Bottom
|
6
|
10:55
|
8.79
|
8.36
|
31.56
|
27.66
|
1.18
|
2
|
<0.10
|
0.166
|
SE
|
|
WSR04
|
20200519
|
Cloudy
|
Moderate
|
Mid-Ebb
|
Middle
|
3.5
|
10:56
|
9.09
|
8.16
|
31.46
|
27.73
|
1.32
|
3
|
<0.10
|
0.166
|
E
|
|
WSR04
|
20200519
|
Cloudy
|
Moderate
|
Mid-Ebb
|
Middle
|
3.5
|
10:56
|
8.32
|
8.13
|
31.24
|
27.86
|
1.31
|
3
|
<0.10
|
0.137
|
SE
|
|
WSR04
|
20200519
|
Cloudy
|
Moderate
|
Mid-Ebb
|
Surface
|
1
|
10:57
|
8.85
|
8.16
|
31.07
|
27.53
|
1.06
|
3
|
<0.10
|
0.186
|
SE
|
|
WSR04
|
20200519
|
Cloudy
|
Moderate
|
Mid-Ebb
|
Surface
|
1
|
10:57
|
8.12
|
8.34
|
31.56
|
27.5
|
1.22
|
3
|
<0.10
|
0.136
|
SE
|
|
WSR16
|
20200519
|
Cloudy
|
Moderate
|
Mid-Ebb
|
Bottom
|
10.8
|
9:33
|
8.7
|
8.26
|
31.62
|
27.64
|
1.25
|
<2
|
<0.10
|
0.229
|
E
|
|
WSR16
|
20200519
|
Cloudy
|
Moderate
|
Mid-Ebb
|
Bottom
|
10.8
|
9:33
|
8.78
|
8.35
|
31.06
|
27.85
|
1.53
|
<2
|
<0.10
|
0.141
|
SE
|
|
WSR16
|
20200519
|
Cloudy
|
Moderate
|
Mid-Ebb
|
Middle
|
5.9
|
9:34
|
8.35
|
8.33
|
30.4
|
27.58
|
1.2
|
2
|
<0.10
|
0.22
|
E
|
|
WSR16
|
20200519
|
Cloudy
|
Moderate
|
Mid-Ebb
|
Middle
|
5.9
|
9:34
|
8.75
|
8.12
|
30.55
|
27.5
|
1.14
|
2
|
<0.10
|
0.155
|
SE
|
|
WSR16
|
20200519
|
Cloudy
|
Moderate
|
Mid-Ebb
|
Surface
|
1
|
9:35
|
8.27
|
8.36
|
31.14
|
27.59
|
1.51
|
2
|
<0.10
|
0.225
|
E
|
|
WSR16
|
20200519
|
Cloudy
|
Moderate
|
Mid-Ebb
|
Surface
|
1
|
9:35
|
8.76
|
8.25
|
31.52
|
27.59
|
1.46
|
3
|
<0.10
|
0.221
|
E
|
|
WSR33
|
20200519
|
Cloudy
|
Moderate
|
Mid-Ebb
|
Bottom
|
6.5
|
10:37
|
8.92
|
8.28
|
31.57
|
27.61
|
1.26
|
2
|
<0.10
|
0.13
|
SE
|
|
WSR33
|
20200519
|
Cloudy
|
Moderate
|
Mid-Ebb
|
Bottom
|
6.5
|
10:37
|
8.18
|
8.27
|
31.28
|
27.7
|
1.21
|
2
|
<0.10
|
0.185
|
E
|
|
WSR33
|
20200519
|
Cloudy
|
Moderate
|
Mid-Ebb
|
Middle
|
3.75
|
10:38
|
8.12
|
8.18
|
31.65
|
27.72
|
1.16
|
<2
|
<0.10
|
0.154
|
E
|
|
WSR33
|
20200519
|
Cloudy
|
Moderate
|
Mid-Ebb
|
Middle
|
3.75
|
10:38
|
8.52
|
8.26
|
30.69
|
27.88
|
1.41
|
<2
|
<0.10
|
0.217
|
SE
|
|
WSR33
|
20200519
|
Cloudy
|
Moderate
|
Mid-Ebb
|
Surface
|
1
|
10:39
|
8.34
|
8.31
|
31.26
|
27.84
|
1.58
|
<2
|
<0.10
|
0.192
|
SE
|
|
WSR33
|
20200519
|
Cloudy
|
Moderate
|
Mid-Ebb
|
Surface
|
1
|
10:39
|
8.34
|
8.11
|
30.47
|
27.65
|
1.37
|
<2
|
<0.10
|
0.201
|
E
|
|
WSR36
|
20200519
|
Cloudy
|
Moderate
|
Mid-Ebb
|
Bottom
|
4.1
|
10:25
|
9.08
|
8.13
|
31.58
|
27.86
|
1.43
|
3
|
<0.10
|
0.146
|
E
|
|
WSR36
|
20200519
|
Cloudy
|
Moderate
|
Mid-Ebb
|
Bottom
|
4.1
|
10:25
|
8.33
|
8.11
|
30.44
|
27.67
|
1.46
|
3
|
<0.10
|
0.149
|
E
|
|
WSR36
|
20200519
|
Cloudy
|
Moderate
|
Mid-Ebb
|
Surface
|
1
|
10:26
|
8.24
|
8.36
|
31.56
|
27.7
|
1.17
|
2
|
<0.10
|
0.194
|
E
|
|
WSR36
|
20200519
|
Cloudy
|
Moderate
|
Mid-Ebb
|
Surface
|
1
|
10:26
|
8.22
|
8.36
|
30.46
|
27.91
|
1.64
|
2
|
<0.10
|
0.192
|
SE
|
|
WSR37
|
20200519
|
Cloudy
|
Moderate
|
Mid-Ebb
|
Bottom
|
6.3
|
10:07
|
8.64
|
8.22
|
31.31
|
27.91
|
1.28
|
2
|
<0.10
|
0.136
|
E
|
|
WSR37
|
20200519
|
Cloudy
|
Moderate
|
Mid-Ebb
|
Bottom
|
6.3
|
10:07
|
8.12
|
8.23
|
31.3
|
27.62
|
1.74
|
3
|
<0.10
|
0.136
|
E
|
|
WSR37
|
20200519
|
Cloudy
|
Moderate
|
Mid-Ebb
|
Middle
|
3.65
|
10:08
|
8.29
|
8.24
|
30.72
|
27.53
|
1.13
|
2
|
<0.10
|
0.156
|
SE
|
|
WSR37
|
20200519
|
Cloudy
|
Moderate
|
Mid-Ebb
|
Middle
|
3.65
|
10:08
|
8.66
|
8.3
|
31.37
|
27.79
|
1.34
|
2
|
<0.10
|
0.207
|
SE
|
|
WSR37
|
20200519
|
Cloudy
|
Moderate
|
Mid-Ebb
|
Surface
|
1
|
10:09
|
8.42
|
8.24
|
31.32
|
27.5
|
1.54
|
2
|
<0.10
|
0.191
|
E
|
|
WSR37
|
20200519
|
Cloudy
|
Moderate
|
Mid-Ebb
|
Surface
|
1
|
10:09
|
8.34
|
8.12
|
30.89
|
27.87
|
1.67
|
2
|
<0.10
|
0.14
|
SE
|
|
CE
|
20200519
|
Cloudy
|
Moderate
|
Mid-Flood
|
Bottom
|
11.3
|
15:04
|
8.37
|
8.5
|
31.13
|
28.03
|
1.69
|
4
|
<0.10
|
0.172
|
NW
|
|
CE
|
20200519
|
Cloudy
|
Moderate
|
Mid-Flood
|
Bottom
|
11.3
|
15:04
|
8.6
|
8.48
|
31.42
|
27.79
|
1.25
|
5
|
<0.10
|
0.173
|
N
|
|
CE
|
20200519
|
Cloudy
|
Moderate
|
Mid-Flood
|
Middle
|
6.15
|
15:05
|
8.79
|
8.3
|
31.45
|
27.92
|
1.21
|
3
|
<0.10
|
0.204
|
NW
|
|
CE
|
20200519
|
Cloudy
|
Moderate
|
Mid-Flood
|
Middle
|
6.15
|
15:05
|
8.64
|
8.27
|
30.66
|
27.86
|
1.15
|
4
|
<0.10
|
0.209
|
NW
|
|
CE
|
20200519
|
Cloudy
|
Moderate
|
Mid-Flood
|
Surface
|
1
|
15:06
|
8.46
|
8.36
|
31.1
|
27.9
|
0.95
|
3
|
<0.10
|
0.172
|
NW
|
|
CE
|
20200519
|
Cloudy
|
Moderate
|
Mid-Flood
|
Surface
|
1
|
15:06
|
8.21
|
8.3
|
31.05
|
28.08
|
1.75
|
4
|
<0.10
|
0.181
|
NW
|
|
CF
|
20200519
|
Cloudy
|
Moderate
|
Mid-Flood
|
Bottom
|
11.1
|
15:03
|
8.7
|
8.19
|
30.92
|
27.6
|
0.99
|
5
|
<0.10
|
0.194
|
W
|
|
CF
|
20200519
|
Cloudy
|
Moderate
|
Mid-Flood
|
Bottom
|
11.1
|
15:03
|
8.46
|
8.5
|
30.35
|
27.62
|
1.38
|
6
|
<0.10
|
0.218
|
W
|
|
CF
|
20200519
|
Cloudy
|
Moderate
|
Mid-Flood
|
Middle
|
6.05
|
15:04
|
8.84
|
8.21
|
30.43
|
27.73
|
1.33
|
4
|
<0.10
|
0.174
|
W
|
|
CF
|
20200519
|
Cloudy
|
Moderate
|
Mid-Flood
|
Middle
|
6.05
|
15:04
|
9.11
|
8.31
|
30.56
|
27.91
|
1.71
|
4
|
<0.10
|
0.212
|
W
|
|
CF
|
20200519
|
Cloudy
|
Moderate
|
Mid-Flood
|
Surface
|
1
|
15:05
|
8.48
|
8.23
|
31.33
|
27.82
|
1.48
|
4
|
<0.10
|
0.219
|
W
|
|
CF
|
20200519
|
Cloudy
|
Moderate
|
Mid-Flood
|
Surface
|
1
|
15:05
|
8.26
|
8.29
|
30.57
|
28.06
|
0.92
|
4
|
<0.10
|
0.24
|
NW
|
|
NF1
|
20200519
|
Cloudy
|
Moderate
|
Mid-Flood
|
Bottom
|
9.5
|
15:43
|
8.4
|
8.45
|
30.47
|
27.95
|
1.53
|
2
|
<0.10
|
0.139
|
W
|
|
NF1
|
20200519
|
Cloudy
|
Moderate
|
Mid-Flood
|
Bottom
|
9.5
|
15:43
|
8.65
|
8.39
|
31.41
|
27.88
|
1.57
|
3
|
<0.10
|
0.157
|
SW
|
|
NF1
|
20200519
|
Cloudy
|
Moderate
|
Mid-Flood
|
Middle
|
5.25
|
15:44
|
8.42
|
8.29
|
30.31
|
28.06
|
1.46
|
3
|
<0.10
|
0.195
|
W
|
|
NF1
|
20200519
|
Cloudy
|
Moderate
|
Mid-Flood
|
Middle
|
5.25
|
15:44
|
8.83
|
8.45
|
30.37
|
28
|
1.01
|
2
|
<0.10
|
0.139
|
W
|
|
NF1
|
20200519
|
Cloudy
|
Moderate
|
Mid-Flood
|
Surface
|
1
|
15:45
|
8.24
|
8.29
|
30.34
|
27.77
|
1.06
|
2
|
<0.10
|
0.184
|
W
|
|
NF1
|
20200519
|
Cloudy
|
Moderate
|
Mid-Flood
|
Surface
|
1
|
15:45
|
8.54
|
8.31
|
31.3
|
27.71
|
1.26
|
2
|
<0.10
|
0.143
|
SW
|
|
NF2
|
20200519
|
Cloudy
|
Moderate
|
Mid-Flood
|
Bottom
|
9.4
|
17:16
|
8.84
|
8.42
|
30.95
|
27.74
|
1.02
|
4
|
<0.10
|
0.196
|
W
|
|
NF2
|
20200519
|
Cloudy
|
Moderate
|
Mid-Flood
|
Bottom
|
9.4
|
17:16
|
8.78
|
8.39
|
30.91
|
27.96
|
1.36
|
3
|
<0.10
|
0.173
|
W
|
|
NF2
|
20200519
|
Cloudy
|
Moderate
|
Mid-Flood
|
Middle
|
5.2
|
17:17
|
8.74
|
8.4
|
31.09
|
27.62
|
1.1
|
4
|
<0.10
|
0.14
|
W
|
|
NF2
|
20200519
|
Cloudy
|
Moderate
|
Mid-Flood
|
Middle
|
5.2
|
17:17
|
8.41
|
8.49
|
30.62
|
27.78
|
1.41
|
3
|
<0.10
|
0.139
|
W
|
|
NF2
|
20200519
|
Cloudy
|
Moderate
|
Mid-Flood
|
Surface
|
1
|
17:18
|
8.42
|
8.42
|
31.23
|
27.78
|
1.35
|
2
|
<0.10
|
0.18
|
W
|
|
NF2
|
20200519
|
Cloudy
|
Moderate
|
Mid-Flood
|
Surface
|
1
|
17:18
|
8.63
|
8.28
|
31.21
|
27.82
|
1.79
|
2
|
<0.10
|
0.174
|
W
|
|
NF3
|
20200519
|
Cloudy
|
Moderate
|
Mid-Flood
|
Bottom
|
9.8
|
17:25
|
8.41
|
8.3
|
30.53
|
27.9
|
1.6
|
3
|
<0.10
|
0.169
|
NW
|
|
NF3
|
20200519
|
Cloudy
|
Moderate
|
Mid-Flood
|
Bottom
|
9.8
|
17:25
|
8.25
|
8.29
|
30.52
|
27.95
|
1.65
|
3
|
<0.10
|
0.129
|
W
|
|
NF3
|
20200519
|
Cloudy
|
Moderate
|
Mid-Flood
|
Middle
|
5.4
|
17:26
|
8.71
|
8.4
|
30.67
|
27.68
|
1
|
2
|
<0.10
|
0.185
|
SW
|
|
NF3
|
20200519
|
Cloudy
|
Moderate
|
Mid-Flood
|
Middle
|
5.4
|
17:26
|
8.63
|
8.17
|
30.45
|
27.85
|
1.58
|
2
|
<0.10
|
0.154
|
SW
|
|
NF3
|
20200519
|
Cloudy
|
Moderate
|
Mid-Flood
|
Surface
|
1
|
17:27
|
9.09
|
8.21
|
30.8
|
28.06
|
1.3
|
2
|
<0.10
|
0.154
|
NW
|
|
NF3
|
20200519
|
Cloudy
|
Moderate
|
Mid-Flood
|
Surface
|
1
|
17:27
|
9.1
|
8.42
|
30.52
|
27.95
|
1.5
|
3
|
<0.10
|
0.146
|
W
|
|
WSR01
|
20200519
|
Cloudy
|
Moderate
|
Mid-Flood
|
Bottom
|
8
|
17:56
|
8.22
|
8.37
|
31.33
|
28.09
|
1.78
|
3
|
<0.10
|
0.132
|
SW
|
|
WSR01
|
20200519
|
Cloudy
|
Moderate
|
Mid-Flood
|
Bottom
|
8
|
17:56
|
8.21
|
8.46
|
30.56
|
27.83
|
1.4
|
3
|
<0.10
|
0.153
|
NW
|
|
WSR01
|
20200519
|
Cloudy
|
Moderate
|
Mid-Flood
|
Middle
|
4.5
|
17:57
|
8.22
|
8.31
|
30.63
|
27.69
|
1.02
|
3
|
<0.10
|
0.141
|
W
|
|
WSR01
|
20200519
|
Cloudy
|
Moderate
|
Mid-Flood
|
Middle
|
4.5
|
17:57
|
8.6
|
8.24
|
30.93
|
28.01
|
1.36
|
2
|
<0.10
|
0.139
|
W
|
|
WSR01
|
20200519
|
Cloudy
|
Moderate
|
Mid-Flood
|
Surface
|
1
|
17:58
|
8.9
|
8.33
|
31.33
|
28.06
|
1.29
|
2
|
<0.10
|
0.141
|
W
|
|
WSR01
|
20200519
|
Cloudy
|
Moderate
|
Mid-Flood
|
Surface
|
1
|
17:58
|
8.82
|
8.23
|
31.47
|
27.6
|
1.14
|
3
|
<0.10
|
0.169
|
W
|
|
WSR02
|
20200519
|
Cloudy
|
Moderate
|
Mid-Flood
|
Bottom
|
8
|
17:31
|
8.73
|
8.29
|
30.6
|
27.89
|
1.15
|
4
|
<0.10
|
0.144
|
SW
|
|
WSR02
|
20200519
|
Cloudy
|
Moderate
|
Mid-Flood
|
Bottom
|
8
|
17:31
|
8.62
|
8.28
|
30.73
|
27.84
|
1.49
|
5
|
<0.10
|
0.172
|
SW
|
|
WSR02
|
20200519
|
Cloudy
|
Moderate
|
Mid-Flood
|
Middle
|
4.5
|
17:32
|
8.28
|
8.5
|
30.96
|
27.77
|
1.68
|
4
|
<0.10
|
0.192
|
W
|
|
WSR02
|
20200519
|
Cloudy
|
Moderate
|
Mid-Flood
|
Middle
|
4.5
|
17:32
|
8.89
|
8.42
|
31.06
|
27.79
|
1.13
|
4
|
<0.10
|
0.195
|
W
|
|
WSR02
|
20200519
|
Cloudy
|
Moderate
|
Mid-Flood
|
Surface
|
1
|
17:33
|
8.97
|
8.17
|
30.37
|
27.94
|
1.35
|
3
|
<0.10
|
0.135
|
NW
|
|
WSR02
|
20200519
|
Cloudy
|
Moderate
|
Mid-Flood
|
Surface
|
1
|
17:33
|
9.11
|
8.19
|
30.57
|
27.7
|
1.78
|
4
|
<0.10
|
0.168
|
W
|
|
WSR03
|
20200519
|
Cloudy
|
Moderate
|
Mid-Flood
|
Bottom
|
6.8
|
16:58
|
8.35
|
8.48
|
30.51
|
27.73
|
1.35
|
2
|
<0.10
|
0.196
|
SW
|
|
WSR03
|
20200519
|
Cloudy
|
Moderate
|
Mid-Flood
|
Bottom
|
6.8
|
16:58
|
8.4
|
8.31
|
31.06
|
28.08
|
1.39
|
3
|
<0.10
|
0.192
|
W
|
|
WSR03
|
20200519
|
Cloudy
|
Moderate
|
Mid-Flood
|
Middle
|
3.9
|
16:59
|
8.8
|
8.3
|
30.72
|
27.9
|
1.63
|
3
|
<0.10
|
0.132
|
W
|
|
WSR03
|
20200519
|
Cloudy
|
Moderate
|
Mid-Flood
|
Middle
|
3.9
|
16:59
|
8.77
|
8.4
|
31.35
|
27.78
|
1.7
|
3
|
<0.10
|
0.169
|
NW
|
|
WSR03
|
20200519
|
Cloudy
|
Moderate
|
Mid-Flood
|
Surface
|
1
|
17:00
|
8.68
|
8.23
|
30.21
|
27.83
|
0.99
|
4
|
<0.10
|
0.148
|
W
|
|
WSR03
|
20200519
|
Cloudy
|
Moderate
|
Mid-Flood
|
Surface
|
1
|
17:00
|
8.36
|
8.4
|
30.34
|
27.84
|
1.04
|
3
|
<0.10
|
0.178
|
W
|
|
WSR04
|
20200519
|
Cloudy
|
Moderate
|
Mid-Flood
|
Bottom
|
6.6
|
16:42
|
8.97
|
8.17
|
30.33
|
27.89
|
1.42
|
4
|
<0.10
|
0.167
|
W
|
|
WSR04
|
20200519
|
Cloudy
|
Moderate
|
Mid-Flood
|
Bottom
|
6.6
|
16:42
|
8.66
|
8.37
|
30.99
|
27.77
|
1.3
|
4
|
<0.10
|
0.18
|
W
|
|
WSR04
|
20200519
|
Cloudy
|
Moderate
|
Mid-Flood
|
Middle
|
3.8
|
16:43
|
8.4
|
8.44
|
30.92
|
27.89
|
1.25
|
3
|
<0.10
|
0.169
|
NW
|
|
WSR04
|
20200519
|
Cloudy
|
Moderate
|
Mid-Flood
|
Middle
|
3.8
|
16:43
|
8.92
|
8.28
|
30.51
|
28.01
|
1.64
|
3
|
<0.10
|
0.131
|
NW
|
|
WSR04
|
20200519
|
Cloudy
|
Moderate
|
Mid-Flood
|
Surface
|
1
|
16:44
|
8.86
|
8.34
|
30.73
|
27.64
|
1.64
|
2
|
<0.10
|
0.159
|
W
|
|
WSR04
|
20200519
|
Cloudy
|
Moderate
|
Mid-Flood
|
Surface
|
1
|
16:44
|
8.29
|
8.18
|
31.46
|
28.08
|
1.61
|
2
|
<0.10
|
0.155
|
W
|
|
WSR16
|
20200519
|
Cloudy
|
Moderate
|
Mid-Flood
|
Bottom
|
11.1
|
15:23
|
8.43
|
8.19
|
30.83
|
27.72
|
1.72
|
3
|
<0.10
|
0.172
|
NW
|
|
WSR16
|
20200519
|
Cloudy
|
Moderate
|
Mid-Flood
|
Bottom
|
11.1
|
15:23
|
8.99
|
8.35
|
30.27
|
28.02
|
1.25
|
4
|
<0.10
|
0.191
|
NW
|
|
WSR16
|
20200519
|
Cloudy
|
Moderate
|
Mid-Flood
|
Middle
|
6.05
|
15:24
|
8.73
|
8.29
|
31.21
|
27.6
|
0.98
|
3
|
<0.10
|
0.201
|
N
|
|
WSR16
|
20200519
|
Cloudy
|
Moderate
|
Mid-Flood
|
Middle
|
6.05
|
15:24
|
8.85
|
8.47
|
30.85
|
28.06
|
1.1
|
4
|
<0.10
|
0.173
|
NW
|
|
WSR16
|
20200519
|
Cloudy
|
Moderate
|
Mid-Flood
|
Surface
|
1
|
15:25
|
8.7
|
8.5
|
30.58
|
27.89
|
1.11
|
2
|
<0.10
|
0.219
|
NW
|
|
WSR16
|
20200519
|
Cloudy
|
Moderate
|
Mid-Flood
|
Surface
|
1
|
15:25
|
8.21
|
8.46
|
30.4
|
27.9
|
1.67
|
2
|
<0.10
|
0.207
|
NW
|
|
WSR33
|
20200519
|
Cloudy
|
Moderate
|
Mid-Flood
|
Bottom
|
6.1
|
16:26
|
8.93
|
8.22
|
30.59
|
27.84
|
0.93
|
4
|
<0.10
|
0.134
|
W
|
|
WSR33
|
20200519
|
Cloudy
|
Moderate
|
Mid-Flood
|
Bottom
|
6.1
|
16:26
|
8.99
|
8.25
|
30.65
|
27.62
|
1.22
|
4
|
<0.10
|
0.194
|
SW
|
|
WSR33
|
20200519
|
Cloudy
|
Moderate
|
Mid-Flood
|
Middle
|
3.55
|
16:27
|
8.83
|
8.5
|
30.79
|
27.86
|
1.61
|
3
|
<0.10
|
0.177
|
W
|
|
WSR33
|
20200519
|
Cloudy
|
Moderate
|
Mid-Flood
|
Middle
|
3.55
|
16:27
|
8.26
|
8.39
|
30.7
|
27.86
|
1.27
|
4
|
<0.10
|
0.174
|
W
|
|
WSR33
|
20200519
|
Cloudy
|
Moderate
|
Mid-Flood
|
Surface
|
1
|
16:28
|
8.84
|
8.43
|
30.74
|
27.76
|
1.73
|
3
|
<0.10
|
0.138
|
W
|
|
WSR33
|
20200519
|
Cloudy
|
Moderate
|
Mid-Flood
|
Surface
|
1
|
16:28
|
8.97
|
8.36
|
30.77
|
28.05
|
1.32
|
4
|
<0.10
|
0.162
|
W
|
|
WSR36
|
20200519
|
Cloudy
|
Moderate
|
Mid-Flood
|
Bottom
|
4.6
|
16:13
|
8.38
|
8.44
|
31.34
|
27.69
|
1.12
|
3
|
<0.10
|
0.181
|
W
|
|
WSR36
|
20200519
|
Cloudy
|
Moderate
|
Mid-Flood
|
Bottom
|
4.6
|
16:13
|
8.8
|
8.45
|
31.21
|
27.63
|
1.07
|
3
|
<0.10
|
0.183
|
W
|
|
WSR36
|
20200519
|
Cloudy
|
Moderate
|
Mid-Flood
|
Surface
|
1
|
16:14
|
8.8
|
8.23
|
30.27
|
28.09
|
0.93
|
4
|
<0.10
|
0.14
|
W
|
|
WSR36
|
20200519
|
Cloudy
|
Moderate
|
Mid-Flood
|
Surface
|
1
|
16:14
|
8.28
|
8.19
|
30.97
|
27.99
|
1.19
|
3
|
<0.10
|
0.159
|
W
|
|
WSR37
|
20200519
|
Cloudy
|
Moderate
|
Mid-Flood
|
Bottom
|
7.6
|
15:54
|
8.66
|
8.46
|
30.52
|
27.64
|
1.63
|
4
|
<0.10
|
0.187
|
NW
|
|
WSR37
|
20200519
|
Cloudy
|
Moderate
|
Mid-Flood
|
Bottom
|
7.6
|
15:54
|
8.61
|
8.2
|
31.23
|
27.99
|
1.43
|
4
|
<0.10
|
0.137
|
SW
|
|
WSR37
|
20200519
|
Cloudy
|
Moderate
|
Mid-Flood
|
Middle
|
4.3
|
15:55
|
8.7
|
8.42
|
31.24
|
28.03
|
1.68
|
3
|
<0.10
|
0.131
|
NW
|
|
WSR37
|
20200519
|
Cloudy
|
Moderate
|
Mid-Flood
|
Middle
|
4.3
|
15:55
|
8.42
|
8.23
|
30.85
|
27.61
|
1.19
|
4
|
<0.10
|
0.132
|
W
|
|
WSR37
|
20200519
|
Cloudy
|
Moderate
|
Mid-Flood
|
Surface
|
1
|
15:56
|
8.83
|
8.43
|
30.23
|
28.08
|
1.17
|
2
|
<0.10
|
0.165
|
SW
|
|
WSR37
|
20200519
|
Cloudy
|
Moderate
|
Mid-Flood
|
Surface
|
1
|
15:56
|
8.98
|
8.38
|
30.9
|
27.8
|
1.34
|
3
|
<0.10
|
0.144
|
SW
|
|
CE
|
20200521
|
Cloudy
|
Moderate
|
Mid-Ebb
|
Bottom
|
11.6
|
10:03
|
5.67
|
8.68
|
31.96
|
26.33
|
2.01
|
<2
|
<0.10
|
0.305
|
SE
|
|
CE
|
20200521
|
Cloudy
|
Moderate
|
Mid-Ebb
|
Bottom
|
11.6
|
10:03
|
5
|
8.67
|
32.01
|
26.3
|
1.77
|
<2
|
<0.10
|
0.412
|
SE
|
|
CE
|
20200521
|
Cloudy
|
Moderate
|
Mid-Ebb
|
Middle
|
6.3
|
10:04
|
5.87
|
8.71
|
30.75
|
26.88
|
1.52
|
<2
|
<0.10
|
0.391
|
SE
|
|
CE
|
20200521
|
Cloudy
|
Moderate
|
Mid-Ebb
|
Middle
|
6.3
|
10:04
|
6.1
|
8.71
|
30.52
|
26.88
|
2.02
|
<2
|
<0.10
|
0.385
|
E
|
|
CE
|
20200521
|
Cloudy
|
Moderate
|
Mid-Ebb
|
Surface
|
1
|
10:05
|
6.09
|
8.72
|
28.85
|
27.12
|
2.49
|
<2
|
<0.10
|
0.307
|
E
|
|
CE
|
20200521
|
Cloudy
|
Moderate
|
Mid-Ebb
|
Surface
|
1
|
10:05
|
5.75
|
8.72
|
28.89
|
27.12
|
2.85
|
<2
|
<0.10
|
0.327
|
SE
|
|
CF
|
20200521
|
Cloudy
|
Moderate
|
Mid-Ebb
|
Bottom
|
11.6
|
10:04
|
7.52
|
8.7
|
31.32
|
27.6
|
2.33
|
3
|
<0.10
|
0.172
|
SE
|
|
CF
|
20200521
|
Cloudy
|
Moderate
|
Mid-Ebb
|
Bottom
|
11.6
|
10:04
|
6.9
|
8.79
|
30.85
|
28.01
|
1.93
|
3
|
<0.10
|
0.145
|
E
|
|
CF
|
20200521
|
Cloudy
|
Moderate
|
Mid-Ebb
|
Middle
|
6.3
|
10:05
|
6.71
|
8.52
|
31.6
|
28.01
|
2.14
|
2
|
<0.10
|
0.178
|
SE
|
|
CF
|
20200521
|
Cloudy
|
Moderate
|
Mid-Ebb
|
Middle
|
6.3
|
10:05
|
6.83
|
8.79
|
30.43
|
27.82
|
2.29
|
3
|
<0.10
|
0.138
|
SE
|
|
CF
|
20200521
|
Cloudy
|
Moderate
|
Mid-Ebb
|
Surface
|
1
|
10:06
|
7.26
|
8.63
|
29.75
|
27.5
|
1.71
|
4
|
<0.10
|
0.197
|
SE
|
|
CF
|
20200521
|
Cloudy
|
Moderate
|
Mid-Ebb
|
Surface
|
1
|
10:06
|
7.22
|
8.69
|
29.86
|
27.89
|
1.9
|
3
|
<0.10
|
0.157
|
E
|
|
NF1
|
20200521
|
Cloudy
|
Moderate
|
Mid-Ebb
|
Bottom
|
4.6
|
10:34
|
6.87
|
8.99
|
30.38
|
28.04
|
0.96
|
2
|
<0.10
|
0.182
|
E
|
|
NF1
|
20200521
|
Cloudy
|
Moderate
|
Mid-Ebb
|
Bottom
|
4.6
|
10:34
|
7.26
|
9
|
30.42
|
28.07
|
0.78
|
2
|
<0.10
|
0.217
|
E
|
|
NF1
|
20200521
|
Cloudy
|
Moderate
|
Mid-Ebb
|
Surface
|
1
|
10:35
|
6.86
|
9
|
30.36
|
28.08
|
0.76
|
<2
|
<0.10
|
0.164
|
E
|
|
NF1
|
20200521
|
Cloudy
|
Moderate
|
Mid-Ebb
|
Surface
|
1
|
10:35
|
6.64
|
9
|
30.3
|
28.08
|
0.84
|
<2
|
<0.10
|
0.173
|
E
|
|
NF2
|
20200521
|
Cloudy
|
Moderate
|
Mid-Ebb
|
Bottom
|
7.6
|
12:22
|
6.67
|
8.97
|
30.48
|
27.84
|
0.53
|
<2
|
<0.10
|
0.155
|
SE
|
|
NF2
|
20200521
|
Cloudy
|
Moderate
|
Mid-Ebb
|
Bottom
|
7.6
|
12:22
|
6.38
|
8.85
|
30.59
|
27.81
|
0.49
|
<2
|
<0.10
|
0.169
|
E
|
|
NF2
|
20200521
|
Cloudy
|
Moderate
|
Mid-Ebb
|
Middle
|
4.3
|
12:23
|
7.3
|
8.8
|
30.27
|
27.97
|
0.5
|
2
|
<0.10
|
0.183
|
E
|
|
NF2
|
20200521
|
Cloudy
|
Moderate
|
Mid-Ebb
|
Middle
|
4.3
|
12:23
|
7.24
|
8.8
|
30.25
|
28
|
0.85
|
2
|
<0.10
|
0.15
|
SE
|
|
NF2
|
20200521
|
Cloudy
|
Moderate
|
Mid-Ebb
|
Surface
|
1
|
12:24
|
6.98
|
8.79
|
29.82
|
28.08
|
0.74
|
<2
|
<0.10
|
0.22
|
E
|
|
NF2
|
20200521
|
Cloudy
|
Moderate
|
Mid-Ebb
|
Surface
|
1
|
12:24
|
6.74
|
8.79
|
29.75
|
28.08
|
0.73
|
2
|
<0.10
|
0.155
|
SE
|
|
NF3
|
20200521
|
Cloudy
|
Moderate
|
Mid-Ebb
|
Bottom
|
8.1
|
12:42
|
9.75
|
8.82
|
30.57
|
27.85
|
0.78
|
2
|
<0.10
|
0.2
|
E
|
|
NF3
|
20200521
|
Cloudy
|
Moderate
|
Mid-Ebb
|
Bottom
|
8.1
|
12:42
|
9.24
|
8.81
|
30.63
|
27.81
|
1.03
|
3
|
<0.10
|
0.169
|
SE
|
|
NF3
|
20200521
|
Cloudy
|
Moderate
|
Mid-Ebb
|
Middle
|
4.55
|
12:43
|
8.79
|
8.81
|
30.26
|
28.07
|
0.41
|
<2
|
<0.10
|
0.179
|
SE
|
|
NF3
|
20200521
|
Cloudy
|
Moderate
|
Mid-Ebb
|
Middle
|
4.55
|
12:43
|
8.73
|
8.81
|
30.29
|
28.09
|
0.65
|
2
|
<0.10
|
0.186
|
SE
|
|
NF3
|
20200521
|
Cloudy
|
Moderate
|
Mid-Ebb
|
Surface
|
1
|
12:44
|
7.26
|
8.83
|
29.62
|
27.98
|
1.41
|
2
|
<0.10
|
0.189
|
E
|
|
NF3
|
20200521
|
Cloudy
|
Moderate
|
Mid-Ebb
|
Surface
|
1
|
12:44
|
6.87
|
8.83
|
29.65
|
27.99
|
1.23
|
<2
|
<0.10
|
0.199
|
SE
|
|
WSR01
|
20200521
|
Cloudy
|
Moderate
|
Mid-Ebb
|
Bottom
|
7.6
|
12:29
|
7.51
|
8.78
|
30.35
|
27.7
|
1.17
|
3
|
<0.10
|
0.189
|
E
|
|
WSR01
|
20200521
|
Cloudy
|
Moderate
|
Mid-Ebb
|
Bottom
|
7.6
|
12:29
|
7.46
|
8.46
|
31.58
|
27.67
|
1.3
|
<2
|
<0.10
|
0.211
|
SE
|
|
WSR01
|
20200521
|
Cloudy
|
Moderate
|
Mid-Ebb
|
Middle
|
4.3
|
12:30
|
7.25
|
8.57
|
29.76
|
28.02
|
1.26
|
<2
|
<0.10
|
0.22
|
SE
|
|
WSR01
|
20200521
|
Cloudy
|
Moderate
|
Mid-Ebb
|
Middle
|
4.3
|
12:30
|
7.09
|
8.71
|
30.54
|
27.98
|
1.06
|
3
|
<0.10
|
0.2
|
SE
|
|
WSR01
|
20200521
|
Cloudy
|
Moderate
|
Mid-Ebb
|
Surface
|
1
|
12:31
|
7.63
|
8.66
|
29.8
|
27.5
|
1.29
|
<2
|
<0.10
|
0.189
|
SE
|
|
WSR01
|
20200521
|
Cloudy
|
Moderate
|
Mid-Ebb
|
Surface
|
1
|
12:31
|
7.05
|
8.67
|
29.92
|
27.72
|
1.12
|
3
|
<0.10
|
0.16
|
E
|
|
WSR02
|
20200521
|
Cloudy
|
Moderate
|
Mid-Ebb
|
Bottom
|
7.7
|
12:51
|
6.7
|
8.67
|
30.85
|
27.7
|
1.92
|
2
|
<0.10
|
0.183
|
E
|
|
WSR02
|
20200521
|
Cloudy
|
Moderate
|
Mid-Ebb
|
Bottom
|
7.7
|
12:51
|
7.3
|
8.45
|
30.94
|
27.7
|
1.65
|
<2
|
<0.10
|
0.216
|
SE
|
|
WSR02
|
20200521
|
Cloudy
|
Moderate
|
Mid-Ebb
|
Middle
|
4.35
|
12:52
|
7.45
|
8.65
|
30.3
|
27.58
|
1.26
|
3
|
<0.10
|
0.205
|
SE
|
|
WSR02
|
20200521
|
Cloudy
|
Moderate
|
Mid-Ebb
|
Middle
|
4.35
|
12:52
|
7.97
|
8.56
|
30.74
|
27.87
|
1.03
|
2
|
<0.10
|
0.191
|
E
|
|
WSR02
|
20200521
|
Cloudy
|
Moderate
|
Mid-Ebb
|
Surface
|
1
|
12:53
|
6.89
|
8.49
|
30.22
|
27.99
|
1.42
|
2
|
<0.10
|
0.204
|
SE
|
|
WSR02
|
20200521
|
Cloudy
|
Moderate
|
Mid-Ebb
|
Surface
|
1
|
12:53
|
7.87
|
8.55
|
30.71
|
27.69
|
1.7
|
<2
|
<0.10
|
0.203
|
E
|
|
WSR03
|
20200521
|
Cloudy
|
Moderate
|
Mid-Ebb
|
Bottom
|
8.1
|
12:01
|
6.18
|
8.77
|
31.46
|
26.98
|
1.83
|
<2
|
<0.10
|
0.171
|
E
|
|
WSR03
|
20200521
|
Cloudy
|
Moderate
|
Mid-Ebb
|
Bottom
|
8.1
|
12:01
|
5.73
|
8.76
|
31.64
|
26.84
|
1.71
|
<2
|
<0.10
|
0.167
|
E
|
|
WSR03
|
20200521
|
Cloudy
|
Moderate
|
Mid-Ebb
|
Middle
|
4.55
|
12:02
|
6.34
|
8.78
|
30.76
|
27.52
|
0.96
|
<2
|
<0.10
|
0.18
|
SE
|
|
WSR03
|
20200521
|
Cloudy
|
Moderate
|
Mid-Ebb
|
Middle
|
4.55
|
12:02
|
6.39
|
8.79
|
30.81
|
27.51
|
0.77
|
<2
|
<0.10
|
0.199
|
E
|
|
WSR03
|
20200521
|
Cloudy
|
Moderate
|
Mid-Ebb
|
Surface
|
1
|
12:03
|
7
|
8.8
|
29.96
|
28.04
|
0.77
|
<2
|
<0.10
|
0.171
|
E
|
|
WSR03
|
20200521
|
Cloudy
|
Moderate
|
Mid-Ebb
|
Surface
|
1
|
12:03
|
6.72
|
8.81
|
29.93
|
28.06
|
0.69
|
<2
|
<0.10
|
0.21
|
SE
|
|
WSR04
|
20200521
|
Cloudy
|
Moderate
|
Mid-Ebb
|
Bottom
|
7.7
|
11:42
|
7.71
|
8.82
|
30.6
|
27.57
|
2.57
|
<2
|
<0.10
|
0.181
|
E
|
|
WSR04
|
20200521
|
Cloudy
|
Moderate
|
Mid-Ebb
|
Bottom
|
7.7
|
11:42
|
6.96
|
8.78
|
31.29
|
27
|
4.23
|
2
|
<0.10
|
0.191
|
E
|
|
WSR04
|
20200521
|
Cloudy
|
Moderate
|
Mid-Ebb
|
Middle
|
4.35
|
11:43
|
7.73
|
8.8
|
29.87
|
27.99
|
0.5
|
<2
|
<0.10
|
0.161
|
SE
|
|
WSR04
|
20200521
|
Cloudy
|
Moderate
|
Mid-Ebb
|
Middle
|
4.35
|
11:43
|
7.88
|
8.8
|
29.78
|
28.04
|
0.66
|
2
|
<0.10
|
0.18
|
SE
|
|
WSR04
|
20200521
|
Cloudy
|
Moderate
|
Mid-Ebb
|
Surface
|
1
|
11:44
|
8.18
|
8.82
|
29.29
|
28.04
|
0.93
|
<2
|
<0.10
|
0.175
|
E
|
|
WSR04
|
20200521
|
Cloudy
|
Moderate
|
Mid-Ebb
|
Surface
|
1
|
11:44
|
7.86
|
8.83
|
29.15
|
28.05
|
0.95
|
<2
|
<0.10
|
0.159
|
E
|
|
WSR16
|
20200521
|
Cloudy
|
Moderate
|
Mid-Ebb
|
Bottom
|
11.1
|
13:18
|
6.82
|
8.59
|
31.33
|
27.97
|
1.76
|
4
|
<0.10
|
0.208
|
E
|
|
WSR16
|
20200521
|
Cloudy
|
Moderate
|
Mid-Ebb
|
Bottom
|
11.1
|
13:18
|
7.92
|
8.49
|
31.21
|
27.53
|
2.38
|
4
|
<0.10
|
0.14
|
E
|
|
WSR16
|
20200521
|
Cloudy
|
Moderate
|
Mid-Ebb
|
Middle
|
6.05
|
13:19
|
7.62
|
8.65
|
30.53
|
27.58
|
1.65
|
2
|
<0.10
|
0.145
|
E
|
|
WSR16
|
20200521
|
Cloudy
|
Moderate
|
Mid-Ebb
|
Middle
|
6.05
|
13:19
|
7.95
|
8.79
|
30.15
|
27.53
|
2.2
|
3
|
<0.10
|
0.204
|
SE
|
|
WSR16
|
20200521
|
Cloudy
|
Moderate
|
Mid-Ebb
|
Surface
|
1
|
13:20
|
7.62
|
8.74
|
30.06
|
27.64
|
1.66
|
2
|
<0.10
|
0.167
|
SE
|
|
WSR16
|
20200521
|
Cloudy
|
Moderate
|
Mid-Ebb
|
Surface
|
1
|
13:20
|
6.72
|
8.73
|
30.07
|
27.85
|
1.06
|
3
|
<0.10
|
0.21
|
E
|
|
WSR33
|
20200521
|
Cloudy
|
Moderate
|
Mid-Ebb
|
Bottom
|
6.3
|
11:19
|
6.78
|
8.97
|
30.12
|
27.91
|
3.4
|
<2
|
<0.10
|
0.158
|
E
|
|
WSR33
|
20200521
|
Cloudy
|
Moderate
|
Mid-Ebb
|
Bottom
|
6.3
|
11:19
|
6.45
|
8.95
|
30.5
|
27.67
|
2.95
|
<2
|
<0.10
|
0.163
|
SE
|
|
WSR33
|
20200521
|
Cloudy
|
Moderate
|
Mid-Ebb
|
Middle
|
3.65
|
11:20
|
6.63
|
9.11
|
28.85
|
28.03
|
0.83
|
2
|
<0.10
|
0.192
|
SE
|
|
WSR33
|
20200521
|
Cloudy
|
Moderate
|
Mid-Ebb
|
Middle
|
3.65
|
11:20
|
6.54
|
9.17
|
29.32
|
28.03
|
0.81
|
3
|
<0.10
|
0.183
|
SE
|
|
WSR33
|
20200521
|
Cloudy
|
Moderate
|
Mid-Ebb
|
Surface
|
1
|
11:21
|
6.51
|
9.16
|
29.03
|
28.04
|
1
|
3
|
<0.10
|
0.156
|
E
|
|
WSR33
|
20200521
|
Cloudy
|
Moderate
|
Mid-Ebb
|
Surface
|
1
|
11:21
|
6.35
|
9.15
|
28.7
|
28.05
|
1.02
|
<2
|
<0.10
|
0.182
|
E
|
|
WSR36
|
20200521
|
Cloudy
|
Moderate
|
Mid-Ebb
|
Bottom
|
3.9
|
11:07
|
6.59
|
8.87
|
30.34
|
28.01
|
1.28
|
<2
|
<0.10
|
0.144
|
SE
|
|
WSR36
|
20200521
|
Cloudy
|
Moderate
|
Mid-Ebb
|
Bottom
|
3.9
|
11:07
|
6.59
|
8.86
|
30.26
|
28.04
|
1.9
|
<2
|
<0.10
|
0.173
|
SE
|
|
WSR36
|
20200521
|
Cloudy
|
Moderate
|
Mid-Ebb
|
Surface
|
1
|
11:08
|
6.37
|
8.84
|
29.94
|
28.04
|
1.64
|
<2
|
<0.10
|
0.137
|
SE
|
|
WSR36
|
20200521
|
Cloudy
|
Moderate
|
Mid-Ebb
|
Surface
|
1
|
11:08
|
6.13
|
8.84
|
29.85
|
28.05
|
1.85
|
<2
|
<0.10
|
0.173
|
SE
|
|
WSR37
|
20200521
|
Cloudy
|
Moderate
|
Mid-Ebb
|
Bottom
|
8.6
|
10:51
|
7.28
|
8.93
|
31.07
|
27.56
|
2.28
|
2
|
<0.10
|
0.199
|
E
|
|
WSR37
|
20200521
|
Cloudy
|
Moderate
|
Mid-Ebb
|
Bottom
|
8.6
|
10:51
|
6.22
|
8.77
|
31.62
|
27.07
|
3.22
|
<2
|
<0.10
|
0.138
|
E
|
|
WSR37
|
20200521
|
Cloudy
|
Moderate
|
Mid-Ebb
|
Middle
|
4.8
|
10:52
|
6.62
|
8.76
|
30.44
|
27.94
|
0.69
|
<2
|
<0.10
|
0.155
|
E
|
|
WSR37
|
20200521
|
Cloudy
|
Moderate
|
Mid-Ebb
|
Middle
|
4.8
|
10:52
|
6.84
|
8.75
|
30.37
|
27.97
|
0.59
|
<2
|
<0.10
|
0.174
|
SE
|
|
WSR37
|
20200521
|
Cloudy
|
Moderate
|
Mid-Ebb
|
Surface
|
1
|
10:53
|
6.45
|
8.76
|
29.92
|
28.04
|
0.7
|
<2
|
<0.10
|
0.221
|
SE
|
|
WSR37
|
20200521
|
Cloudy
|
Moderate
|
Mid-Ebb
|
Surface
|
1
|
10:53
|
5.86
|
8.76
|
29.8
|
28.06
|
0.76
|
<2
|
<0.10
|
0.167
|
E
|
|
CE
|
20200521
|
Cloudy
|
Moderate
|
Mid-Flood
|
Bottom
|
12
|
15:22
|
7.07
|
8.53
|
29.97
|
28.16
|
2.4
|
2
|
<0.10
|
0.176
|
NW
|
|
CE
|
20200521
|
Cloudy
|
Moderate
|
Mid-Flood
|
Bottom
|
12
|
15:22
|
7.16
|
8.75
|
30.71
|
28.21
|
2.47
|
<2
|
<0.10
|
0.165
|
NW
|
|
CE
|
20200521
|
Cloudy
|
Moderate
|
Mid-Flood
|
Middle
|
6.5
|
15:23
|
7.58
|
8.57
|
30.92
|
27.98
|
1.68
|
<2
|
<0.10
|
0.173
|
NW
|
|
CE
|
20200521
|
Cloudy
|
Moderate
|
Mid-Flood
|
Middle
|
6.5
|
15:23
|
8.26
|
8.67
|
30.73
|
28.2
|
1.41
|
2
|
<0.10
|
0.221
|
NW
|
|
CE
|
20200521
|
Cloudy
|
Moderate
|
Mid-Flood
|
Surface
|
1
|
15:24
|
7.51
|
8.63
|
30.79
|
28.15
|
0.99
|
2
|
<0.10
|
0.215
|
NW
|
|
CE
|
20200521
|
Cloudy
|
Moderate
|
Mid-Flood
|
Surface
|
1
|
15:24
|
7.18
|
8.72
|
30.09
|
27.96
|
1.28
|
3
|
<0.10
|
0.164
|
NW
|
|
CF
|
20200521
|
Cloudy
|
Moderate
|
Mid-Flood
|
Bottom
|
11.8
|
15:21
|
7.82
|
8.71
|
30.34
|
28.18
|
2.56
|
3
|
<0.10
|
0.163
|
W
|
|
CF
|
20200521
|
Cloudy
|
Moderate
|
Mid-Flood
|
Bottom
|
11.8
|
15:21
|
7.91
|
8.57
|
31.03
|
28.1
|
1.95
|
4
|
<0.10
|
0.214
|
NW
|
|
CF
|
20200521
|
Cloudy
|
Moderate
|
Mid-Flood
|
Middle
|
6.4
|
15:22
|
7.29
|
8.51
|
30.14
|
28.01
|
0.92
|
2
|
<0.10
|
0.17
|
W
|
|
CF
|
20200521
|
Cloudy
|
Moderate
|
Mid-Flood
|
Middle
|
6.4
|
15:22
|
7.87
|
8.77
|
30.6
|
27.91
|
1.03
|
<2
|
<0.10
|
0.17
|
W
|
|
CF
|
20200521
|
Cloudy
|
Moderate
|
Mid-Flood
|
Surface
|
1
|
15:23
|
7.25
|
8.62
|
31.27
|
27.95
|
1.25
|
<2
|
<0.10
|
0.172
|
SW
|
|
CF
|
20200521
|
Cloudy
|
Moderate
|
Mid-Flood
|
Surface
|
1
|
15:23
|
7.01
|
8.52
|
30.08
|
27.91
|
1.58
|
<2
|
<0.10
|
0.206
|
SW
|
|
NF1
|
20200521
|
Cloudy
|
Moderate
|
Mid-Flood
|
Bottom
|
9.9
|
16:01
|
7.34
|
8.54
|
30.43
|
28.07
|
1.69
|
3
|
<0.10
|
0.137
|
SW
|
|
NF1
|
20200521
|
Cloudy
|
Moderate
|
Mid-Flood
|
Bottom
|
9.9
|
16:01
|
7.71
|
8.53
|
30.63
|
27.9
|
1.58
|
4
|
<0.10
|
0.189
|
W
|
|
NF1
|
20200521
|
Cloudy
|
Moderate
|
Mid-Flood
|
Middle
|
5.45
|
16:02
|
7.68
|
8.54
|
30.58
|
28.01
|
1.28
|
2
|
<0.10
|
0.168
|
W
|
|
NF1
|
20200521
|
Cloudy
|
Moderate
|
Mid-Flood
|
Middle
|
5.45
|
16:02
|
7.18
|
8.57
|
30.89
|
27.91
|
1.08
|
3
|
<0.10
|
0.156
|
W
|
|
NF1
|
20200521
|
Cloudy
|
Moderate
|
Mid-Flood
|
Surface
|
1
|
16:03
|
7.47
|
8.8
|
29.94
|
28.05
|
1.65
|
3
|
<0.10
|
0.19
|
NW
|
|
NF1
|
20200521
|
Cloudy
|
Moderate
|
Mid-Flood
|
Surface
|
1
|
16:03
|
8.01
|
8.68
|
30.41
|
27.94
|
1.25
|
<2
|
<0.10
|
0.141
|
NW
|
|
NF2
|
20200521
|
Cloudy
|
Moderate
|
Mid-Flood
|
Bottom
|
8.5
|
17:37
|
7.46
|
8.76
|
30.77
|
28.03
|
2.2
|
2
|
<0.10
|
0.194
|
W
|
|
NF2
|
20200521
|
Cloudy
|
Moderate
|
Mid-Flood
|
Bottom
|
8.5
|
17:37
|
8.24
|
8.55
|
30.65
|
28.15
|
1.64
|
3
|
<0.10
|
0.186
|
NW
|
|
NF2
|
20200521
|
Cloudy
|
Moderate
|
Mid-Flood
|
Middle
|
4.75
|
17:38
|
6.95
|
8.76
|
31.16
|
28.07
|
1.16
|
4
|
<0.10
|
0.143
|
W
|
|
NF2
|
20200521
|
Cloudy
|
Moderate
|
Mid-Flood
|
Middle
|
4.75
|
17:38
|
7.73
|
8.51
|
30.86
|
28
|
1.14
|
2
|
<0.10
|
0.185
|
W
|
|
NF2
|
20200521
|
Cloudy
|
Moderate
|
Mid-Flood
|
Surface
|
1
|
17:39
|
7.32
|
8.75
|
31.1
|
28.13
|
1.21
|
4
|
<0.10
|
0.193
|
W
|
|
NF2
|
20200521
|
Cloudy
|
Moderate
|
Mid-Flood
|
Surface
|
1
|
17:39
|
6.88
|
8.65
|
30.13
|
28.18
|
0.97
|
4
|
<0.10
|
0.184
|
W
|
|
NF3
|
20200521
|
Cloudy
|
Moderate
|
Mid-Flood
|
Bottom
|
9.8
|
17:45
|
6.99
|
8.76
|
29.96
|
28.11
|
1.98
|
4
|
<0.10
|
0.128
|
SW
|
|
NF3
|
20200521
|
Cloudy
|
Moderate
|
Mid-Flood
|
Bottom
|
9.8
|
17:45
|
8.17
|
8.8
|
30.6
|
28.07
|
2.25
|
3
|
<0.10
|
0.145
|
SW
|
|
NF3
|
20200521
|
Cloudy
|
Moderate
|
Mid-Flood
|
Middle
|
5.4
|
17:46
|
7.24
|
8.76
|
30.71
|
28.05
|
1.48
|
3
|
<0.10
|
0.177
|
SW
|
|
NF3
|
20200521
|
Cloudy
|
Moderate
|
Mid-Flood
|
Middle
|
5.4
|
17:46
|
7.11
|
8.65
|
30.23
|
28.06
|
1.57
|
3
|
<0.10
|
0.165
|
SW
|
|
NF3
|
20200521
|
Cloudy
|
Moderate
|
Mid-Flood
|
Surface
|
1
|
17:47
|
7.05
|
8.79
|
29.93
|
28.21
|
1.17
|
2
|
<0.10
|
0.132
|
W
|
|
NF3
|
20200521
|
Cloudy
|
Moderate
|
Mid-Flood
|
Surface
|
1
|
17:47
|
7.26
|
8.64
|
30.58
|
28
|
0.88
|
2
|
<0.10
|
0.156
|
W
|
|
WSR01
|
20200521
|
Cloudy
|
Moderate
|
Mid-Flood
|
Bottom
|
7.3
|
18:09
|
7.43
|
8.79
|
29.96
|
27.96
|
2.16
|
3
|
<0.10
|
0.169
|
W
|
|
WSR01
|
20200521
|
Cloudy
|
Moderate
|
Mid-Flood
|
Bottom
|
7.3
|
18:09
|
7
|
8.63
|
30.78
|
27.95
|
1.87
|
<2
|
<0.10
|
0.183
|
W
|
|
WSR01
|
20200521
|
Cloudy
|
Moderate
|
Mid-Flood
|
Middle
|
4.15
|
18:10
|
8.22
|
8.67
|
30.17
|
28.07
|
1.46
|
3
|
<0.10
|
0.162
|
W
|
|
WSR01
|
20200521
|
Cloudy
|
Moderate
|
Mid-Flood
|
Middle
|
4.15
|
18:10
|
6.96
|
8.6
|
30.01
|
27.95
|
1.74
|
2
|
<0.10
|
0.161
|
NW
|
|
WSR01
|
20200521
|
Cloudy
|
Moderate
|
Mid-Flood
|
Surface
|
1
|
18:11
|
7.99
|
8.57
|
30.51
|
28
|
1.66
|
5
|
<0.10
|
0.162
|
W
|
|
WSR01
|
20200521
|
Cloudy
|
Moderate
|
Mid-Flood
|
Surface
|
1
|
18:11
|
8.04
|
8.61
|
30.83
|
27.91
|
1.43
|
4
|
<0.10
|
0.173
|
SW
|
|
WSR02
|
20200521
|
Cloudy
|
Moderate
|
Mid-Flood
|
Bottom
|
8.9
|
17:45
|
7.18
|
8.54
|
30.75
|
27.96
|
2.37
|
4
|
<0.10
|
0.128
|
W
|
|
WSR02
|
20200521
|
Cloudy
|
Moderate
|
Mid-Flood
|
Bottom
|
8.9
|
17:45
|
8.14
|
8.67
|
30.63
|
27.91
|
1.84
|
3
|
<0.10
|
0.158
|
W
|
|
WSR02
|
20200521
|
Cloudy
|
Moderate
|
Mid-Flood
|
Middle
|
4.95
|
17:46
|
6.95
|
8.63
|
30.21
|
28.03
|
0.99
|
2
|
<0.10
|
0.189
|
W
|
|
WSR02
|
20200521
|
Cloudy
|
Moderate
|
Mid-Flood
|
Middle
|
4.95
|
17:46
|
7.01
|
8.6
|
30.56
|
27.96
|
0.98
|
3
|
<0.10
|
0.166
|
NW
|
|
WSR02
|
20200521
|
Cloudy
|
Moderate
|
Mid-Flood
|
Surface
|
1
|
17:47
|
7.12
|
8.74
|
30.79
|
27.92
|
1.33
|
2
|
<0.10
|
0.159
|
W
|
|
WSR02
|
20200521
|
Cloudy
|
Moderate
|
Mid-Flood
|
Surface
|
1
|
17:47
|
7.61
|
8.71
|
31.17
|
27.97
|
0.94
|
<2
|
<0.10
|
0.161
|
SW
|
|
WSR03
|
20200521
|
Cloudy
|
Moderate
|
Mid-Flood
|
Bottom
|
7.1
|
17:19
|
7.52
|
8.59
|
30.46
|
28.05
|
2.23
|
3
|
<0.10
|
0.128
|
W
|
|
WSR03
|
20200521
|
Cloudy
|
Moderate
|
Mid-Flood
|
Bottom
|
7.1
|
17:19
|
8.06
|
8.72
|
30.05
|
27.95
|
2.11
|
3
|
<0.10
|
0.129
|
W
|
|
WSR03
|
20200521
|
Cloudy
|
Moderate
|
Mid-Flood
|
Middle
|
4.05
|
17:20
|
7.37
|
8.73
|
30.31
|
27.93
|
1.46
|
2
|
<0.10
|
0.175
|
W
|
|
WSR03
|
20200521
|
Cloudy
|
Moderate
|
Mid-Flood
|
Middle
|
4.05
|
17:20
|
7.3
|
8.58
|
29.89
|
28.2
|
1.11
|
2
|
<0.10
|
0.137
|
W
|
|
WSR03
|
20200521
|
Cloudy
|
Moderate
|
Mid-Flood
|
Surface
|
1
|
17:21
|
7.14
|
8.61
|
31
|
28.14
|
0.92
|
2
|
<0.10
|
0.162
|
W
|
|
WSR03
|
20200521
|
Cloudy
|
Moderate
|
Mid-Flood
|
Surface
|
1
|
17:21
|
7.95
|
8.74
|
31.17
|
28.21
|
0.97
|
3
|
<0.10
|
0.149
|
NW
|
|
WSR04
|
20200521
|
Cloudy
|
Moderate
|
Mid-Flood
|
Bottom
|
6.8
|
17:02
|
7.65
|
8.56
|
29.94
|
28.05
|
1.98
|
4
|
<0.10
|
0.171
|
W
|
|
WSR04
|
20200521
|
Cloudy
|
Moderate
|
Mid-Flood
|
Bottom
|
6.8
|
17:02
|
7.01
|
8.52
|
30.5
|
27.97
|
1.62
|
3
|
<0.10
|
0.164
|
W
|
|
WSR04
|
20200521
|
Cloudy
|
Moderate
|
Mid-Flood
|
Middle
|
3.9
|
17:03
|
7.53
|
8.65
|
30.88
|
28.06
|
1.54
|
3
|
<0.10
|
0.156
|
W
|
|
WSR04
|
20200521
|
Cloudy
|
Moderate
|
Mid-Flood
|
Middle
|
3.9
|
17:03
|
7.84
|
8.61
|
30.38
|
27.97
|
1.32
|
3
|
<0.10
|
0.19
|
SW
|
|
WSR04
|
20200521
|
Cloudy
|
Moderate
|
Mid-Flood
|
Surface
|
1
|
17:04
|
7.22
|
8.71
|
29.89
|
27.96
|
1.63
|
2
|
<0.10
|
0.183
|
W
|
|
WSR04
|
20200521
|
Cloudy
|
Moderate
|
Mid-Flood
|
Surface
|
1
|
17:04
|
7.89
|
8.77
|
31.03
|
27.95
|
1.62
|
2
|
<0.10
|
0.177
|
SW
|
|
WSR16
|
20200521
|
Cloudy
|
Moderate
|
Mid-Flood
|
Bottom
|
10.8
|
15:41
|
7.32
|
8.58
|
30.47
|
28.07
|
2.06
|
4
|
<0.10
|
0.164
|
NW
|
|
WSR16
|
20200521
|
Cloudy
|
Moderate
|
Mid-Flood
|
Bottom
|
10.8
|
15:41
|
7.25
|
8.51
|
30.04
|
28.17
|
1.86
|
3
|
<0.10
|
0.181
|
NW
|
|
WSR16
|
20200521
|
Cloudy
|
Moderate
|
Mid-Flood
|
Middle
|
5.9
|
15:42
|
7.46
|
8.62
|
31.19
|
28.11
|
1.39
|
3
|
<0.10
|
0.222
|
N
|
|
WSR16
|
20200521
|
Cloudy
|
Moderate
|
Mid-Flood
|
Middle
|
5.9
|
15:42
|
7.33
|
8.8
|
30.07
|
28.04
|
1.4
|
3
|
<0.10
|
0.184
|
NW
|
|
WSR16
|
20200521
|
Cloudy
|
Moderate
|
Mid-Flood
|
Surface
|
1
|
15:43
|
7.7
|
8.74
|
30.16
|
28.15
|
1.05
|
4
|
<0.10
|
0.199
|
NW
|
|
WSR16
|
20200521
|
Cloudy
|
Moderate
|
Mid-Flood
|
Surface
|
1
|
15:43
|
8.09
|
8.54
|
30.06
|
28.21
|
1.62
|
2
|
<0.10
|
0.217
|
NW
|
|
WSR33
|
20200521
|
Cloudy
|
Moderate
|
Mid-Flood
|
Bottom
|
6.5
|
16:44
|
7.64
|
8.53
|
30.35
|
28.19
|
2.41
|
<2
|
<0.10
|
0.167
|
W
|
|
WSR33
|
20200521
|
Cloudy
|
Moderate
|
Mid-Flood
|
Bottom
|
6.5
|
16:44
|
8.23
|
8.63
|
30
|
27.92
|
1.95
|
2
|
<0.10
|
0.174
|
NW
|
|
WSR33
|
20200521
|
Cloudy
|
Moderate
|
Mid-Flood
|
Middle
|
3.75
|
16:45
|
7.14
|
8.63
|
31.26
|
27.92
|
1.58
|
3
|
<0.10
|
0.193
|
W
|
|
WSR33
|
20200521
|
Cloudy
|
Moderate
|
Mid-Flood
|
Middle
|
3.75
|
16:45
|
8.25
|
8.51
|
30.59
|
28.15
|
1.75
|
4
|
<0.10
|
0.152
|
W
|
|
WSR33
|
20200521
|
Cloudy
|
Moderate
|
Mid-Flood
|
Surface
|
1
|
16:46
|
7.54
|
8.7
|
30.94
|
28.07
|
1.4
|
3
|
<0.10
|
0.13
|
W
|
|
WSR33
|
20200521
|
Cloudy
|
Moderate
|
Mid-Flood
|
Surface
|
1
|
16:46
|
8.09
|
8.78
|
30.61
|
28.17
|
1.48
|
4
|
<0.10
|
0.154
|
W
|
|
WSR36
|
20200521
|
Cloudy
|
Moderate
|
Mid-Flood
|
Bottom
|
3.7
|
16:30
|
7.68
|
8.79
|
30.64
|
27.97
|
1.88
|
2
|
<0.10
|
0.167
|
SW
|
|
WSR36
|
20200521
|
Cloudy
|
Moderate
|
Mid-Flood
|
Bottom
|
3.7
|
16:30
|
7.12
|
8.51
|
30.99
|
28.13
|
1.67
|
<2
|
<0.10
|
0.155
|
NW
|
|
WSR36
|
20200521
|
Cloudy
|
Moderate
|
Mid-Flood
|
Surface
|
1
|
16:31
|
6.89
|
8.63
|
29.9
|
28.17
|
0.82
|
<2
|
<0.10
|
0.159
|
W
|
|
WSR36
|
20200521
|
Cloudy
|
Moderate
|
Mid-Flood
|
Surface
|
1
|
16:31
|
7.48
|
8.52
|
30.12
|
28.21
|
1.65
|
<2
|
<0.10
|
0.148
|
W
|
|
WSR37
|
20200521
|
Cloudy
|
Moderate
|
Mid-Flood
|
Bottom
|
7.4
|
16:13
|
7.21
|
8.68
|
31.26
|
27.93
|
2.38
|
3
|
<0.10
|
0.13
|
SW
|
|
WSR37
|
20200521
|
Cloudy
|
Moderate
|
Mid-Flood
|
Bottom
|
7.4
|
16:13
|
7.27
|
8.59
|
31.01
|
28.21
|
2.21
|
2
|
<0.10
|
0.167
|
W
|
|
WSR37
|
20200521
|
Cloudy
|
Moderate
|
Mid-Flood
|
Middle
|
4.2
|
16:14
|
7.45
|
8.61
|
30.76
|
27.98
|
1.76
|
<2
|
<0.10
|
0.145
|
NW
|
|
WSR37
|
20200521
|
Cloudy
|
Moderate
|
Mid-Flood
|
Middle
|
4.2
|
16:14
|
7.34
|
8.62
|
30.58
|
28.04
|
1.4
|
3
|
<0.10
|
0.166
|
W
|
|
WSR37
|
20200521
|
Cloudy
|
Moderate
|
Mid-Flood
|
Surface
|
1
|
16:15
|
7.44
|
8.8
|
30.72
|
27.97
|
1.06
|
4
|
<0.10
|
0.14
|
W
|
|
WSR37
|
20200521
|
Cloudy
|
Moderate
|
Mid-Flood
|
Surface
|
1
|
16:15
|
6.96
|
8.56
|
30.03
|
28.04
|
1.08
|
3
|
<0.10
|
0.14
|
W
|
|
CE
|
20200523
|
Cloudy
|
Moderate
|
Mid-Ebb
|
Bottom
|
12
|
11:00
|
8.43
|
8.22
|
30.81
|
27.23
|
1.62
|
3
|
<0.10
|
0.286
|
SE
|
|
CE
|
20200523
|
Cloudy
|
Moderate
|
Mid-Ebb
|
Bottom
|
12
|
11:00
|
8.79
|
8.18
|
31.2
|
26.63
|
1.6
|
4
|
<0.10
|
0.42
|
SE
|
|
CE
|
20200523
|
Cloudy
|
Moderate
|
Mid-Ebb
|
Middle
|
6.5
|
11:01
|
9.34
|
8.2
|
31
|
26.76
|
1.5
|
2
|
<0.10
|
0.428
|
SE
|
|
CE
|
20200523
|
Cloudy
|
Moderate
|
Mid-Ebb
|
Middle
|
6.5
|
11:01
|
8.33
|
8.06
|
31.52
|
27.03
|
1.32
|
3
|
<0.10
|
0.343
|
SE
|
|
CE
|
20200523
|
Cloudy
|
Moderate
|
Mid-Ebb
|
Surface
|
1
|
11:02
|
8.13
|
8.27
|
30.99
|
27.14
|
1.37
|
<2
|
<0.10
|
0.309
|
E
|
|
CE
|
20200523
|
Cloudy
|
Moderate
|
Mid-Ebb
|
Surface
|
1
|
11:02
|
8.03
|
8.08
|
30.83
|
26.93
|
0.98
|
<2
|
<0.10
|
0.317
|
E
|
|
CF
|
20200523
|
Cloudy
|
Moderate
|
Mid-Ebb
|
Bottom
|
11.7
|
11:01
|
8.44
|
8.17
|
31.25
|
26.84
|
2.01
|
<2
|
<0.10
|
0.154
|
E
|
|
CF
|
20200523
|
Cloudy
|
Moderate
|
Mid-Ebb
|
Bottom
|
11.7
|
11:01
|
9.05
|
8.02
|
30.92
|
26.79
|
1.59
|
<2
|
<0.10
|
0.167
|
E
|
|
CF
|
20200523
|
Cloudy
|
Moderate
|
Mid-Ebb
|
Middle
|
6.35
|
11:02
|
8.71
|
8.24
|
31.5
|
27.15
|
1.09
|
<2
|
<0.10
|
0.167
|
SE
|
|
CF
|
20200523
|
Cloudy
|
Moderate
|
Mid-Ebb
|
Middle
|
6.35
|
11:02
|
9.44
|
8.17
|
31.58
|
26.82
|
1.3
|
<2
|
<0.10
|
0.142
|
SE
|
|
CF
|
20200523
|
Cloudy
|
Moderate
|
Mid-Ebb
|
Surface
|
1
|
11:03
|
9.3
|
8.14
|
31.63
|
27.1
|
1.36
|
2
|
<0.10
|
0.163
|
SE
|
|
CF
|
20200523
|
Cloudy
|
Moderate
|
Mid-Ebb
|
Surface
|
1
|
11:03
|
9.08
|
8.04
|
30.85
|
26.96
|
1.22
|
2
|
<0.10
|
0.212
|
SE
|
|
NF1
|
20200523
|
Cloudy
|
Moderate
|
Mid-Ebb
|
Bottom
|
10.9
|
11:43
|
9.32
|
8.03
|
31.21
|
26.6
|
1.7
|
6
|
<0.10
|
0.159
|
SE
|
|
NF1
|
20200523
|
Cloudy
|
Moderate
|
Mid-Ebb
|
Bottom
|
10.9
|
11:43
|
8.8
|
8.02
|
30.81
|
26.84
|
1.84
|
7
|
<0.10
|
0.135
|
E
|
|
NF1
|
20200523
|
Cloudy
|
Moderate
|
Mid-Ebb
|
Middle
|
5.95
|
11:44
|
9.49
|
8.09
|
31.32
|
26.53
|
1.45
|
4
|
<0.10
|
0.218
|
SE
|
|
NF1
|
20200523
|
Cloudy
|
Moderate
|
Mid-Ebb
|
Middle
|
5.95
|
11:44
|
7.98
|
8.16
|
31.06
|
26.7
|
1.5
|
5
|
<0.10
|
0.159
|
SE
|
|
NF1
|
20200523
|
Cloudy
|
Moderate
|
Mid-Ebb
|
Surface
|
1
|
11:45
|
9.22
|
8.02
|
30.87
|
26.62
|
1.21
|
4
|
<0.10
|
0.214
|
SE
|
|
NF1
|
20200523
|
Cloudy
|
Moderate
|
Mid-Ebb
|
Surface
|
1
|
11:45
|
8.47
|
8.18
|
31.28
|
27.14
|
1.14
|
4
|
<0.10
|
0.175
|
SE
|
|
NF2
|
20200523
|
Cloudy
|
Moderate
|
Mid-Ebb
|
Bottom
|
8.7
|
13:20
|
7.95
|
8.18
|
30.8
|
27.05
|
1.7
|
2
|
<0.10
|
0.204
|
E
|
|
NF2
|
20200523
|
Cloudy
|
Moderate
|
Mid-Ebb
|
Bottom
|
8.7
|
13:20
|
8.06
|
8.18
|
31.44
|
27.21
|
1.63
|
2
|
<0.10
|
0.169
|
SE
|
|
NF2
|
20200523
|
Cloudy
|
Moderate
|
Mid-Ebb
|
Middle
|
4.85
|
13:21
|
8.77
|
8.25
|
31.59
|
26.92
|
1.26
|
3
|
<0.10
|
0.136
|
SE
|
|
NF2
|
20200523
|
Cloudy
|
Moderate
|
Mid-Ebb
|
Middle
|
4.85
|
13:21
|
7.83
|
8.18
|
30.79
|
26.95
|
1.21
|
4
|
<0.10
|
0.152
|
SE
|
|
NF2
|
20200523
|
Cloudy
|
Moderate
|
Mid-Ebb
|
Surface
|
1
|
13:22
|
9.11
|
8.09
|
31.58
|
26.87
|
1.21
|
3
|
<0.10
|
0.169
|
SE
|
|
NF2
|
20200523
|
Cloudy
|
Moderate
|
Mid-Ebb
|
Surface
|
1
|
13:22
|
8.77
|
8.17
|
31.51
|
26.97
|
1.07
|
4
|
<0.10
|
0.212
|
E
|
|
NF3
|
20200523
|
Cloudy
|
Moderate
|
Mid-Ebb
|
Bottom
|
10.3
|
13:28
|
7.89
|
8.14
|
31.46
|
27.1
|
1.71
|
5
|
<0.10
|
0.174
|
E
|
|
NF3
|
20200523
|
Cloudy
|
Moderate
|
Mid-Ebb
|
Bottom
|
10.3
|
13:28
|
8.69
|
8.31
|
31.6
|
26.86
|
1.64
|
5
|
<0.10
|
0.151
|
SE
|
|
NF3
|
20200523
|
Cloudy
|
Moderate
|
Mid-Ebb
|
Middle
|
5.65
|
13:29
|
7.63
|
8.06
|
30.94
|
27.02
|
1.5
|
5
|
<0.10
|
0.162
|
E
|
|
NF3
|
20200523
|
Cloudy
|
Moderate
|
Mid-Ebb
|
Middle
|
5.65
|
13:29
|
8.69
|
8.23
|
30.97
|
27.06
|
1.11
|
4
|
<0.10
|
0.215
|
E
|
|
NF3
|
20200523
|
Cloudy
|
Moderate
|
Mid-Ebb
|
Surface
|
1
|
13:30
|
9.1
|
8.1
|
30.94
|
26.83
|
1.22
|
2
|
<0.10
|
0.188
|
SE
|
|
NF3
|
20200523
|
Cloudy
|
Moderate
|
Mid-Ebb
|
Surface
|
1
|
13:30
|
8.51
|
8.3
|
30.88
|
27.12
|
1.39
|
3
|
<0.10
|
0.145
|
E
|
|
WSR01
|
20200523
|
Cloudy
|
Moderate
|
Mid-Ebb
|
Bottom
|
7.5
|
13:49
|
7.99
|
8.2
|
31.48
|
27.01
|
1.88
|
2
|
<0.10
|
0.219
|
SE
|
|
WSR01
|
20200523
|
Cloudy
|
Moderate
|
Mid-Ebb
|
Bottom
|
7.5
|
13:49
|
9.01
|
8.24
|
31.05
|
26.91
|
2.01
|
3
|
<0.10
|
0.175
|
SE
|
|
WSR01
|
20200523
|
Cloudy
|
Moderate
|
Mid-Ebb
|
Middle
|
4.25
|
13:50
|
8.86
|
8.2
|
30.83
|
27.08
|
1.06
|
3
|
<0.10
|
0.178
|
E
|
|
WSR01
|
20200523
|
Cloudy
|
Moderate
|
Mid-Ebb
|
Middle
|
4.25
|
13:50
|
7.61
|
8.15
|
31.67
|
27.05
|
1.05
|
2
|
<0.10
|
0.159
|
SE
|
|
WSR01
|
20200523
|
Cloudy
|
Moderate
|
Mid-Ebb
|
Surface
|
1
|
13:51
|
8.51
|
8.02
|
31.28
|
26.73
|
0.97
|
<2
|
<0.10
|
0.172
|
E
|
|
WSR01
|
20200523
|
Cloudy
|
Moderate
|
Mid-Ebb
|
Surface
|
1
|
13:51
|
8.49
|
8.15
|
30.79
|
26.66
|
1
|
<2
|
<0.10
|
0.138
|
SE
|
|
WSR02
|
20200523
|
Cloudy
|
Moderate
|
Mid-Ebb
|
Bottom
|
8
|
13:26
|
8.18
|
8.08
|
31.02
|
26.7
|
1.82
|
<2
|
<0.10
|
0.204
|
E
|
|
WSR02
|
20200523
|
Cloudy
|
Moderate
|
Mid-Ebb
|
Bottom
|
8
|
13:26
|
8.13
|
8.06
|
31.63
|
26.83
|
1.61
|
<2
|
<0.10
|
0.172
|
SE
|
|
WSR02
|
20200523
|
Cloudy
|
Moderate
|
Mid-Ebb
|
Middle
|
4.5
|
13:27
|
8.7
|
8.03
|
31.68
|
27
|
1.46
|
<2
|
<0.10
|
0.14
|
SE
|
|
WSR02
|
20200523
|
Cloudy
|
Moderate
|
Mid-Ebb
|
Middle
|
4.5
|
13:27
|
7.81
|
8.07
|
31.38
|
26.56
|
1.36
|
<2
|
<0.10
|
0.146
|
E
|
|
WSR02
|
20200523
|
Cloudy
|
Moderate
|
Mid-Ebb
|
Surface
|
1
|
13:28
|
7.77
|
8.07
|
31.48
|
26.61
|
1.37
|
<2
|
<0.10
|
0.196
|
SE
|
|
WSR02
|
20200523
|
Cloudy
|
Moderate
|
Mid-Ebb
|
Surface
|
1
|
13:28
|
8.41
|
8.07
|
31.41
|
26.93
|
0.99
|
<2
|
<0.10
|
0.17
|
SE
|
|
WSR03
|
20200523
|
Cloudy
|
Moderate
|
Mid-Ebb
|
Bottom
|
7.5
|
13:02
|
8.68
|
8.14
|
31.17
|
27.2
|
1.86
|
<2
|
<0.10
|
0.18
|
E
|
|
WSR03
|
20200523
|
Cloudy
|
Moderate
|
Mid-Ebb
|
Bottom
|
7.5
|
13:02
|
8.47
|
8.19
|
31.16
|
26.66
|
1.57
|
<2
|
<0.10
|
0.145
|
E
|
|
WSR03
|
20200523
|
Cloudy
|
Moderate
|
Mid-Ebb
|
Middle
|
4.25
|
13:03
|
8.69
|
8.21
|
31.63
|
26.54
|
1.38
|
3
|
<0.10
|
0.196
|
SE
|
|
WSR03
|
20200523
|
Cloudy
|
Moderate
|
Mid-Ebb
|
Middle
|
4.25
|
13:03
|
8.1
|
8.1
|
30.79
|
26.76
|
1.36
|
3
|
<0.10
|
0.205
|
SE
|
|
WSR03
|
20200523
|
Cloudy
|
Moderate
|
Mid-Ebb
|
Surface
|
1
|
13:04
|
9.3
|
8.15
|
31.46
|
26.85
|
1.33
|
4
|
<0.10
|
0.201
|
SE
|
|
WSR03
|
20200523
|
Cloudy
|
Moderate
|
Mid-Ebb
|
Surface
|
1
|
13:04
|
8.87
|
8.2
|
30.99
|
26.89
|
1.26
|
4
|
<0.10
|
0.196
|
E
|
|
WSR04
|
20200523
|
Cloudy
|
Moderate
|
Mid-Ebb
|
Bottom
|
5.9
|
12:45
|
9.08
|
8.27
|
31.45
|
26.86
|
1.78
|
4
|
<0.10
|
0.132
|
SE
|
|
WSR04
|
20200523
|
Cloudy
|
Moderate
|
Mid-Ebb
|
Bottom
|
5.9
|
12:45
|
9.13
|
8.03
|
31.09
|
26.6
|
1.95
|
3
|
<0.10
|
0.218
|
E
|
|
WSR04
|
20200523
|
Cloudy
|
Moderate
|
Mid-Ebb
|
Middle
|
3.45
|
12:46
|
8
|
8.01
|
31.37
|
26.73
|
1.43
|
3
|
<0.10
|
0.191
|
SE
|
|
WSR04
|
20200523
|
Cloudy
|
Moderate
|
Mid-Ebb
|
Middle
|
3.45
|
12:46
|
9.13
|
8.07
|
31.67
|
26.67
|
1.17
|
2
|
<0.10
|
0.142
|
E
|
|
WSR04
|
20200523
|
Cloudy
|
Moderate
|
Mid-Ebb
|
Surface
|
1
|
12:47
|
8.69
|
8.17
|
30.89
|
26.9
|
1.13
|
2
|
<0.10
|
0.176
|
E
|
|
WSR04
|
20200523
|
Cloudy
|
Moderate
|
Mid-Ebb
|
Surface
|
1
|
12:47
|
7.6
|
8.14
|
30.77
|
26.62
|
1.14
|
3
|
<0.10
|
0.153
|
SE
|
|
WSR16
|
20200523
|
Cloudy
|
Moderate
|
Mid-Ebb
|
Bottom
|
11.1
|
11:22
|
7.94
|
8.14
|
31.65
|
27.09
|
1.77
|
2
|
<0.10
|
0.196
|
E
|
|
WSR16
|
20200523
|
Cloudy
|
Moderate
|
Mid-Ebb
|
Bottom
|
11.1
|
11:22
|
8.68
|
8.14
|
31.68
|
26.54
|
1.79
|
3
|
<0.10
|
0.177
|
E
|
|
WSR16
|
20200523
|
Cloudy
|
Moderate
|
Mid-Ebb
|
Middle
|
6.05
|
11:23
|
7.79
|
8.16
|
31.08
|
27.04
|
1.2
|
2
|
<0.10
|
0.217
|
E
|
|
WSR16
|
20200523
|
Cloudy
|
Moderate
|
Mid-Ebb
|
Middle
|
6.05
|
11:23
|
8.65
|
8.23
|
31.05
|
26.89
|
1.41
|
3
|
<0.10
|
0.167
|
E
|
|
WSR16
|
20200523
|
Cloudy
|
Moderate
|
Mid-Ebb
|
Surface
|
1
|
11:24
|
8.98
|
8.26
|
30.9
|
26.64
|
1.42
|
<2
|
<0.10
|
0.163
|
SE
|
|
WSR16
|
20200523
|
Cloudy
|
Moderate
|
Mid-Ebb
|
Surface
|
1
|
11:24
|
8.13
|
8.09
|
31.03
|
27.2
|
1.44
|
<2
|
<0.10
|
0.212
|
E
|
|
WSR33
|
20200523
|
Cloudy
|
Moderate
|
Mid-Ebb
|
Bottom
|
6.2
|
12:27
|
7.57
|
8.31
|
31.46
|
27.23
|
1.73
|
4
|
<0.10
|
0.137
|
SE
|
|
WSR33
|
20200523
|
Cloudy
|
Moderate
|
Mid-Ebb
|
Bottom
|
6.2
|
12:27
|
8.82
|
8.31
|
31.54
|
26.92
|
1.96
|
5
|
<0.10
|
0.181
|
E
|
|
WSR33
|
20200523
|
Cloudy
|
Moderate
|
Mid-Ebb
|
Middle
|
3.6
|
12:28
|
9.42
|
8.28
|
30.98
|
26.87
|
1.35
|
3
|
<0.10
|
0.15
|
E
|
|
WSR33
|
20200523
|
Cloudy
|
Moderate
|
Mid-Ebb
|
Middle
|
3.6
|
12:28
|
7.72
|
8.05
|
31.44
|
26.83
|
1.41
|
3
|
<0.10
|
0.158
|
E
|
|
WSR33
|
20200523
|
Cloudy
|
Moderate
|
Mid-Ebb
|
Surface
|
1
|
12:29
|
8.4
|
8.03
|
31.54
|
26.64
|
1.29
|
2
|
<0.10
|
0.221
|
E
|
|
WSR33
|
20200523
|
Cloudy
|
Moderate
|
Mid-Ebb
|
Surface
|
1
|
12:29
|
8.49
|
8.08
|
31.02
|
26.87
|
1.12
|
2
|
<0.10
|
0.171
|
E
|
|
WSR36
|
20200523
|
Cloudy
|
Moderate
|
Mid-Ebb
|
Bottom
|
4.5
|
12:15
|
7.87
|
8.09
|
31.68
|
27.06
|
1.94
|
2
|
<0.10
|
0.151
|
E
|
|
WSR36
|
20200523
|
Cloudy
|
Moderate
|
Mid-Ebb
|
Bottom
|
4.5
|
12:15
|
8.36
|
8.08
|
31.45
|
26.87
|
1.98
|
3
|
<0.10
|
0.143
|
E
|
|
WSR36
|
20200523
|
Cloudy
|
Moderate
|
Mid-Ebb
|
Surface
|
1
|
12:16
|
8.12
|
8.05
|
31.5
|
26.88
|
1.06
|
5
|
<0.10
|
0.158
|
SE
|
|
WSR36
|
20200523
|
Cloudy
|
Moderate
|
Mid-Ebb
|
Surface
|
1
|
12:16
|
8.63
|
8.08
|
31.12
|
26.62
|
1.28
|
4
|
<0.10
|
0.186
|
SE
|
|
WSR37
|
20200523
|
Cloudy
|
Moderate
|
Mid-Ebb
|
Bottom
|
6.7
|
11:57
|
8.25
|
8.05
|
31.12
|
27.01
|
1.91
|
3
|
<0.10
|
0.216
|
SE
|
|
WSR37
|
20200523
|
Cloudy
|
Moderate
|
Mid-Ebb
|
Bottom
|
6.7
|
11:57
|
8.15
|
8.12
|
31.55
|
26.55
|
1.97
|
4
|
<0.10
|
0.19
|
SE
|
|
WSR37
|
20200523
|
Cloudy
|
Moderate
|
Mid-Ebb
|
Middle
|
3.85
|
11:58
|
9.03
|
8.2
|
31.31
|
27.07
|
1.16
|
3
|
<0.10
|
0.151
|
SE
|
|
WSR37
|
20200523
|
Cloudy
|
Moderate
|
Mid-Ebb
|
Middle
|
3.85
|
11:58
|
8.88
|
8.04
|
30.84
|
26.59
|
1.32
|
3
|
<0.10
|
0.174
|
E
|
|
WSR37
|
20200523
|
Cloudy
|
Moderate
|
Mid-Ebb
|
Surface
|
1
|
11:59
|
8.92
|
8.29
|
31.6
|
26.99
|
1.41
|
2
|
<0.10
|
0.204
|
E
|
|
WSR37
|
20200523
|
Cloudy
|
Moderate
|
Mid-Ebb
|
Surface
|
1
|
11:59
|
8.7
|
8.06
|
30.95
|
26.73
|
1.02
|
2
|
<0.10
|
0.172
|
E
|
|
CE
|
20200523
|
Cloudy
|
Moderate
|
Mid-Flood
|
Bottom
|
12
|
16:21
|
8.43
|
8.02
|
31.79
|
26.85
|
1.98
|
4
|
<0.10
|
0.178
|
N
|
|
CE
|
20200523
|
Cloudy
|
Moderate
|
Mid-Flood
|
Bottom
|
12
|
16:21
|
8.21
|
8.18
|
31.16
|
26.74
|
1.51
|
4
|
<0.10
|
0.225
|
N
|
|
CE
|
20200523
|
Cloudy
|
Moderate
|
Mid-Flood
|
Middle
|
6.5
|
16:22
|
8.86
|
8.12
|
31.33
|
26.56
|
0.82
|
3
|
<0.10
|
0.18
|
NW
|
|
CE
|
20200523
|
Cloudy
|
Moderate
|
Mid-Flood
|
Middle
|
6.5
|
16:22
|
7.75
|
8.24
|
31.86
|
26.74
|
0.92
|
4
|
<0.10
|
0.168
|
NW
|
|
CE
|
20200523
|
Cloudy
|
Moderate
|
Mid-Flood
|
Surface
|
1
|
16:23
|
9.62
|
8.13
|
31.87
|
26.83
|
0.89
|
3
|
<0.10
|
0.192
|
NW
|
|
CE
|
20200523
|
Cloudy
|
Moderate
|
Mid-Flood
|
Surface
|
1
|
16:23
|
8.98
|
8.04
|
31.34
|
26.54
|
0.74
|
3
|
<0.10
|
0.173
|
NW
|
|
CF
|
20200523
|
Cloudy
|
Moderate
|
Mid-Flood
|
Bottom
|
11.6
|
16:20
|
8.54
|
8.11
|
31.09
|
26.88
|
1.66
|
2
|
<0.10
|
0.233
|
SW
|
|
CF
|
20200523
|
Cloudy
|
Moderate
|
Mid-Flood
|
Bottom
|
11.6
|
16:20
|
7.98
|
8.15
|
31.8
|
26.44
|
1.46
|
3
|
<0.10
|
0.168
|
W
|
|
CF
|
20200523
|
Cloudy
|
Moderate
|
Mid-Flood
|
Middle
|
6.3
|
16:21
|
8.95
|
8.12
|
31.35
|
26.41
|
1.16
|
2
|
<0.10
|
0.191
|
W
|
|
CF
|
20200523
|
Cloudy
|
Moderate
|
Mid-Flood
|
Middle
|
6.3
|
16:21
|
8.57
|
8.12
|
31.86
|
26.66
|
1.1
|
2
|
<0.10
|
0.209
|
W
|
|
CF
|
20200523
|
Cloudy
|
Moderate
|
Mid-Flood
|
Surface
|
1
|
16:22
|
7.59
|
8.2
|
31.76
|
26.38
|
0.98
|
2
|
<0.10
|
0.206
|
W
|
|
CF
|
20200523
|
Cloudy
|
Moderate
|
Mid-Flood
|
Surface
|
1
|
16:22
|
7.59
|
8.11
|
31.1
|
26.49
|
1.32
|
2
|
<0.10
|
0.205
|
W
|
|
NF1
|
20200523
|
Cloudy
|
Moderate
|
Mid-Flood
|
Bottom
|
10.4
|
17:04
|
9.54
|
8.09
|
31.1
|
26.57
|
1.37
|
3
|
<0.10
|
0.193
|
SW
|
|
NF1
|
20200523
|
Cloudy
|
Moderate
|
Mid-Flood
|
Bottom
|
10.4
|
17:04
|
8.15
|
8.03
|
31.45
|
26.7
|
1.86
|
2
|
<0.10
|
0.139
|
W
|
|
NF1
|
20200523
|
Cloudy
|
Moderate
|
Mid-Flood
|
Middle
|
5.7
|
17:05
|
9.08
|
8.1
|
31.73
|
26.45
|
1.09
|
3
|
<0.10
|
0.147
|
W
|
|
NF1
|
20200523
|
Cloudy
|
Moderate
|
Mid-Flood
|
Middle
|
5.7
|
17:05
|
8.93
|
8.02
|
31.14
|
26.29
|
1.27
|
4
|
<0.10
|
0.183
|
SW
|
|
NF1
|
20200523
|
Cloudy
|
Moderate
|
Mid-Flood
|
Surface
|
1
|
17:06
|
9.26
|
8.1
|
31.63
|
26.87
|
0.99
|
5
|
<0.10
|
0.163
|
SW
|
|
NF1
|
20200523
|
Cloudy
|
Moderate
|
Mid-Flood
|
Surface
|
1
|
17:06
|
8.96
|
8.23
|
31.36
|
26.67
|
1.23
|
4
|
<0.10
|
0.14
|
W
|
|
NF2
|
20200523
|
Cloudy
|
Moderate
|
Mid-Flood
|
Bottom
|
8.1
|
18:40
|
8.27
|
8.13
|
31.67
|
26.95
|
1.51
|
3
|
<0.10
|
0.169
|
SW
|
|
NF2
|
20200523
|
Cloudy
|
Moderate
|
Mid-Flood
|
Bottom
|
8.1
|
18:40
|
8.64
|
8.01
|
31.4
|
26.4
|
1.46
|
3
|
<0.10
|
0.152
|
W
|
|
NF2
|
20200523
|
Cloudy
|
Moderate
|
Mid-Flood
|
Middle
|
4.55
|
18:41
|
9.4
|
8.18
|
31.27
|
26.83
|
1.34
|
3
|
<0.10
|
0.16
|
W
|
|
NF2
|
20200523
|
Cloudy
|
Moderate
|
Mid-Flood
|
Middle
|
4.55
|
18:41
|
8.27
|
8.19
|
31.16
|
26.57
|
1.11
|
2
|
<0.10
|
0.148
|
W
|
|
NF2
|
20200523
|
Cloudy
|
Moderate
|
Mid-Flood
|
Surface
|
1
|
18:42
|
8.73
|
8.18
|
31.49
|
26.75
|
1.28
|
3
|
<0.10
|
0.139
|
SW
|
|
NF2
|
20200523
|
Cloudy
|
Moderate
|
Mid-Flood
|
Surface
|
1
|
18:42
|
7.84
|
8.19
|
31.78
|
26.85
|
1.35
|
2
|
<0.10
|
0.143
|
NW
|
|
NF3
|
20200523
|
Cloudy
|
Moderate
|
Mid-Flood
|
Bottom
|
9.8
|
18:50
|
9.55
|
8.1
|
31.83
|
26.56
|
2
|
3
|
<0.10
|
0.188
|
W
|
|
NF3
|
20200523
|
Cloudy
|
Moderate
|
Mid-Flood
|
Bottom
|
9.8
|
18:50
|
7.5
|
8.04
|
31.42
|
26.36
|
1.54
|
4
|
<0.10
|
0.128
|
W
|
|
NF3
|
20200523
|
Cloudy
|
Moderate
|
Mid-Flood
|
Middle
|
5.4
|
18:51
|
9.1
|
8.02
|
31.71
|
26.82
|
1.03
|
2
|
<0.10
|
0.175
|
W
|
|
NF3
|
20200523
|
Cloudy
|
Moderate
|
Mid-Flood
|
Middle
|
5.4
|
18:51
|
8.88
|
8.14
|
31.73
|
26.5
|
0.85
|
3
|
<0.10
|
0.168
|
W
|
|
NF3
|
20200523
|
Cloudy
|
Moderate
|
Mid-Flood
|
Surface
|
1
|
18:52
|
7.52
|
8.05
|
31.54
|
26.23
|
1.05
|
<2
|
<0.10
|
0.165
|
SW
|
|
NF3
|
20200523
|
Cloudy
|
Moderate
|
Mid-Flood
|
Surface
|
1
|
18:52
|
8.97
|
8.12
|
31.27
|
26.23
|
1.02
|
<2
|
<0.10
|
0.137
|
W
|
|
WSR01
|
20200523
|
Cloudy
|
Moderate
|
Mid-Flood
|
Bottom
|
8.4
|
18:51
|
9.17
|
8.02
|
31.41
|
26.85
|
1.49
|
2
|
<0.10
|
0.128
|
SW
|
|
WSR01
|
20200523
|
Cloudy
|
Moderate
|
Mid-Flood
|
Bottom
|
8.4
|
18:51
|
9.07
|
8.08
|
31.3
|
26.47
|
1.91
|
2
|
<0.10
|
0.129
|
SW
|
|
WSR01
|
20200523
|
Cloudy
|
Moderate
|
Mid-Flood
|
Middle
|
4.7
|
18:52
|
8.77
|
8.04
|
31.43
|
26.23
|
1.24
|
2
|
<0.10
|
0.195
|
NW
|
|
WSR01
|
20200523
|
Cloudy
|
Moderate
|
Mid-Flood
|
Middle
|
4.7
|
18:52
|
9.07
|
8.06
|
31.56
|
26.34
|
1.31
|
3
|
<0.10
|
0.184
|
NW
|
|
WSR01
|
20200523
|
Cloudy
|
Moderate
|
Mid-Flood
|
Surface
|
1
|
18:53
|
8.96
|
8.21
|
31.8
|
26.48
|
1.16
|
3
|
<0.10
|
0.146
|
SW
|
|
WSR01
|
20200523
|
Cloudy
|
Moderate
|
Mid-Flood
|
Surface
|
1
|
18:53
|
9.23
|
8.11
|
31.9
|
26.78
|
1.09
|
4
|
<0.10
|
0.145
|
W
|
|
WSR02
|
20200523
|
Cloudy
|
Moderate
|
Mid-Flood
|
Bottom
|
8.6
|
18:27
|
9.39
|
8.1
|
31.9
|
26.86
|
1.84
|
<2
|
<0.10
|
0.129
|
W
|
|
WSR02
|
20200523
|
Cloudy
|
Moderate
|
Mid-Flood
|
Bottom
|
8.6
|
18:27
|
7.69
|
8.21
|
31.77
|
26.64
|
1.58
|
<2
|
<0.10
|
0.158
|
W
|
|
WSR02
|
20200523
|
Cloudy
|
Moderate
|
Mid-Flood
|
Middle
|
4.8
|
18:28
|
8.32
|
8.08
|
31.48
|
26.8
|
0.97
|
2
|
<0.10
|
0.174
|
W
|
|
WSR02
|
20200523
|
Cloudy
|
Moderate
|
Mid-Flood
|
Middle
|
4.8
|
18:28
|
8.5
|
8.22
|
31.24
|
26.7
|
1.07
|
2
|
<0.10
|
0.159
|
NW
|
|
WSR02
|
20200523
|
Cloudy
|
Moderate
|
Mid-Flood
|
Surface
|
1
|
18:29
|
9.15
|
8.05
|
31.52
|
26.24
|
1.29
|
3
|
<0.10
|
0.129
|
NW
|
|
WSR02
|
20200523
|
Cloudy
|
Moderate
|
Mid-Flood
|
Surface
|
1
|
18:29
|
8.87
|
8.04
|
31.75
|
26.96
|
1.2
|
4
|
<0.10
|
0.166
|
SW
|
|
WSR03
|
20200523
|
Cloudy
|
Moderate
|
Mid-Flood
|
Bottom
|
6.7
|
18:24
|
9.39
|
8.12
|
31.26
|
26.34
|
1.38
|
2
|
<0.10
|
0.19
|
NW
|
|
WSR03
|
20200523
|
Cloudy
|
Moderate
|
Mid-Flood
|
Bottom
|
6.7
|
18:24
|
8.45
|
8.25
|
31.16
|
26.8
|
1.81
|
2
|
<0.10
|
0.137
|
W
|
|
WSR03
|
20200523
|
Cloudy
|
Moderate
|
Mid-Flood
|
Middle
|
3.85
|
18:25
|
8.73
|
8.2
|
31.51
|
26.68
|
1.37
|
<2
|
<0.10
|
0.192
|
W
|
|
WSR03
|
20200523
|
Cloudy
|
Moderate
|
Mid-Flood
|
Middle
|
3.85
|
18:25
|
8.85
|
8.1
|
31.13
|
26.63
|
0.86
|
<2
|
<0.10
|
0.178
|
NW
|
|
WSR03
|
20200523
|
Cloudy
|
Moderate
|
Mid-Flood
|
Surface
|
1
|
18:26
|
8.47
|
8.06
|
31.37
|
26.28
|
1.01
|
<2
|
<0.10
|
0.131
|
SW
|
|
WSR03
|
20200523
|
Cloudy
|
Moderate
|
Mid-Flood
|
Surface
|
1
|
18:26
|
9.48
|
8.25
|
31.18
|
26.44
|
0.92
|
<2
|
<0.10
|
0.168
|
NW
|
|
WSR04
|
20200523
|
Cloudy
|
Moderate
|
Mid-Flood
|
Bottom
|
6
|
18:07
|
7.61
|
8.22
|
31.51
|
26.38
|
1.34
|
4
|
<0.10
|
0.13
|
SW
|
|
WSR04
|
20200523
|
Cloudy
|
Moderate
|
Mid-Flood
|
Bottom
|
6
|
18:07
|
7.96
|
8.25
|
31.54
|
26.49
|
1.46
|
3
|
<0.10
|
0.145
|
NW
|
|
WSR04
|
20200523
|
Cloudy
|
Moderate
|
Mid-Flood
|
Middle
|
3.5
|
18:08
|
9.64
|
8.1
|
31.88
|
26.48
|
1.17
|
2
|
<0.10
|
0.145
|
W
|
|
WSR04
|
20200523
|
Cloudy
|
Moderate
|
Mid-Flood
|
Middle
|
3.5
|
18:08
|
9.19
|
8.01
|
31.56
|
26.98
|
1.27
|
3
|
<0.10
|
0.132
|
SW
|
|
WSR04
|
20200523
|
Cloudy
|
Moderate
|
Mid-Flood
|
Surface
|
1
|
18:09
|
7.64
|
8.19
|
31.67
|
26.41
|
0.91
|
<2
|
<0.10
|
0.16
|
W
|
|
WSR04
|
20200523
|
Cloudy
|
Moderate
|
Mid-Flood
|
Surface
|
1
|
18:09
|
9.41
|
8.24
|
31.09
|
26.47
|
0.79
|
<2
|
<0.10
|
0.154
|
W
|
|
WSR16
|
20200523
|
Cloudy
|
Moderate
|
Mid-Flood
|
Bottom
|
11.6
|
16:42
|
7.78
|
8.02
|
31.39
|
26.66
|
1.86
|
2
|
<0.10
|
0.211
|
N
|
|
WSR16
|
20200523
|
Cloudy
|
Moderate
|
Mid-Flood
|
Bottom
|
11.6
|
16:42
|
9.26
|
8.13
|
31.66
|
26.44
|
1.67
|
3
|
<0.10
|
0.206
|
NW
|
|
WSR16
|
20200523
|
Cloudy
|
Moderate
|
Mid-Flood
|
Middle
|
6.3
|
16:43
|
9.2
|
8.06
|
31.73
|
26.94
|
1.16
|
2
|
<0.10
|
0.217
|
NW
|
|
WSR16
|
20200523
|
Cloudy
|
Moderate
|
Mid-Flood
|
Middle
|
6.3
|
16:43
|
8.3
|
8.11
|
31.57
|
26.88
|
1.34
|
3
|
<0.10
|
0.208
|
N
|
|
WSR16
|
20200523
|
Cloudy
|
Moderate
|
Mid-Flood
|
Surface
|
1
|
16:44
|
7.79
|
8.13
|
31.47
|
26.73
|
1.38
|
2
|
<0.10
|
0.17
|
NW
|
|
WSR16
|
20200523
|
Cloudy
|
Moderate
|
Mid-Flood
|
Surface
|
1
|
16:44
|
8.79
|
8.18
|
31.75
|
26.34
|
1.01
|
3
|
<0.10
|
0.19
|
NW
|
|
WSR33
|
20200523
|
Cloudy
|
Moderate
|
Mid-Flood
|
Bottom
|
6
|
17:49
|
9.24
|
8.18
|
31.39
|
26.8
|
1.58
|
<2
|
<0.10
|
0.189
|
SW
|
|
WSR33
|
20200523
|
Cloudy
|
Moderate
|
Mid-Flood
|
Bottom
|
6
|
17:49
|
8.57
|
8.02
|
31.76
|
26.27
|
1.52
|
<2
|
<0.10
|
0.146
|
NW
|
|
WSR33
|
20200523
|
Cloudy
|
Moderate
|
Mid-Flood
|
Middle
|
3.5
|
17:50
|
8.13
|
8.03
|
31.72
|
26.69
|
0.77
|
2
|
<0.10
|
0.145
|
SW
|
|
WSR33
|
20200523
|
Cloudy
|
Moderate
|
Mid-Flood
|
Middle
|
3.5
|
17:50
|
9.02
|
8.09
|
31.36
|
26.94
|
1.26
|
2
|
<0.10
|
0.147
|
W
|
|
WSR33
|
20200523
|
Cloudy
|
Moderate
|
Mid-Flood
|
Surface
|
1
|
17:51
|
8.42
|
8.2
|
31.22
|
26.83
|
0.91
|
3
|
<0.10
|
0.146
|
NW
|
|
WSR33
|
20200523
|
Cloudy
|
Moderate
|
Mid-Flood
|
Surface
|
1
|
17:51
|
9.62
|
8.13
|
31.26
|
26.79
|
1.11
|
3
|
<0.10
|
0.177
|
W
|
|
WSR36
|
20200523
|
Cloudy
|
Moderate
|
Mid-Flood
|
Bottom
|
4.1
|
17:36
|
8.5
|
8.19
|
31.9
|
26.59
|
1.45
|
5
|
<0.10
|
0.165
|
W
|
|
WSR36
|
20200523
|
Cloudy
|
Moderate
|
Mid-Flood
|
Bottom
|
4.1
|
17:36
|
8.16
|
8.22
|
31.75
|
26.77
|
1.55
|
4
|
<0.10
|
0.178
|
SW
|
|
WSR36
|
20200523
|
Cloudy
|
Moderate
|
Mid-Flood
|
Surface
|
1
|
17:37
|
7.83
|
8.1
|
31.38
|
26.35
|
0.92
|
3
|
<0.10
|
0.174
|
W
|
|
WSR36
|
20200523
|
Cloudy
|
Moderate
|
Mid-Flood
|
Surface
|
1
|
17:37
|
9.16
|
8.03
|
31.14
|
26.33
|
1.32
|
3
|
<0.10
|
0.154
|
W
|
|
WSR37
|
20200523
|
Cloudy
|
Moderate
|
Mid-Flood
|
Bottom
|
7.5
|
17:17
|
8.82
|
8.04
|
31.65
|
26.54
|
1.6
|
5
|
<0.10
|
0.183
|
W
|
|
WSR37
|
20200523
|
Cloudy
|
Moderate
|
Mid-Flood
|
Bottom
|
7.5
|
17:17
|
9.25
|
8.02
|
31.26
|
26.36
|
1.37
|
5
|
<0.10
|
0.135
|
W
|
|
WSR37
|
20200523
|
Cloudy
|
Moderate
|
Mid-Flood
|
Middle
|
4.25
|
17:18
|
8.52
|
8.18
|
31.41
|
26.33
|
1.35
|
4
|
<0.10
|
0.132
|
W
|
|
WSR37
|
20200523
|
Cloudy
|
Moderate
|
Mid-Flood
|
Middle
|
4.25
|
17:18
|
7.89
|
8.04
|
31.78
|
26.44
|
1.06
|
5
|
<0.10
|
0.16
|
W
|
|
WSR37
|
20200523
|
Cloudy
|
Moderate
|
Mid-Flood
|
Surface
|
1
|
17:19
|
8.36
|
8.1
|
31.3
|
26.53
|
0.71
|
3
|
<0.10
|
0.143
|
SW
|
|
WSR37
|
20200523
|
Cloudy
|
Moderate
|
Mid-Flood
|
Surface
|
1
|
17:19
|
9.1
|
8.22
|
31.16
|
26.43
|
0.99
|
4
|
<0.10
|
0.131
|
W
|
|
CE
|
20200526
|
Cloudy
|
Moderate
|
Mid-Flood
|
Bottom
|
11.4
|
8:02
|
8.38
|
8.24
|
31.63
|
27.36
|
1.98
|
<2
|
<0.10
|
0.17
|
NW
|
|
CE
|
20200526
|
Cloudy
|
Moderate
|
Mid-Flood
|
Bottom
|
11.4
|
8:02
|
7.87
|
8.19
|
31.55
|
27.77
|
1.74
|
<2
|
<0.10
|
0.182
|
NW
|
|
CE
|
20200526
|
Cloudy
|
Moderate
|
Mid-Flood
|
Middle
|
6.2
|
8:03
|
7.34
|
8.11
|
32.28
|
27.32
|
1.37
|
2
|
<0.10
|
0.222
|
NW
|
|
CE
|
20200526
|
Cloudy
|
Moderate
|
Mid-Flood
|
Middle
|
6.2
|
8:03
|
8.48
|
8.21
|
31.58
|
27.53
|
1.36
|
2
|
<0.10
|
0.159
|
NW
|
|
CE
|
20200526
|
Cloudy
|
Moderate
|
Mid-Flood
|
Surface
|
1
|
8:04
|
8.57
|
8.04
|
31.22
|
27.44
|
1.32
|
<2
|
<0.10
|
0.206
|
NW
|
|
CE
|
20200526
|
Cloudy
|
Moderate
|
Mid-Flood
|
Surface
|
1
|
8:04
|
8.41
|
8.23
|
31.28
|
27.78
|
1.26
|
<2
|
<0.10
|
0.209
|
NW
|
|
CF
|
20200526
|
Cloudy
|
Moderate
|
Mid-Flood
|
Bottom
|
11.4
|
8:00
|
8.27
|
8.12
|
31.96
|
27.47
|
1.88
|
<2
|
<0.10
|
0.215
|
W
|
|
CF
|
20200526
|
Cloudy
|
Moderate
|
Mid-Flood
|
Bottom
|
11.4
|
8:00
|
8.06
|
8.1
|
31.39
|
27.79
|
2
|
<2
|
<0.10
|
0.214
|
W
|
|
CF
|
20200526
|
Cloudy
|
Moderate
|
Mid-Flood
|
Middle
|
6.2
|
8:01
|
8.82
|
8.14
|
31.95
|
27.63
|
1.38
|
<2
|
<0.10
|
0.237
|
W
|
|
CF
|
20200526
|
Cloudy
|
Moderate
|
Mid-Flood
|
Middle
|
6.2
|
8:01
|
8.18
|
8.12
|
31.18
|
27.55
|
1.19
|
<2
|
<0.10
|
0.245
|
SW
|
|
CF
|
20200526
|
Cloudy
|
Moderate
|
Mid-Flood
|
Surface
|
1
|
8:02
|
8.15
|
8.28
|
31.12
|
27.54
|
1.12
|
<2
|
<0.10
|
0.221
|
W
|
|
CF
|
20200526
|
Cloudy
|
Moderate
|
Mid-Flood
|
Surface
|
1
|
8:02
|
7.93
|
8.17
|
32.05
|
27.53
|
1.26
|
<2
|
<0.10
|
0.219
|
W
|
|
NF1
|
20200526
|
Cloudy
|
Moderate
|
Mid-Flood
|
Bottom
|
10.7
|
8:43
|
8.45
|
8.1
|
31.95
|
27.66
|
1.94
|
<2
|
<0.10
|
0.181
|
W
|
|
NF1
|
20200526
|
Cloudy
|
Moderate
|
Mid-Flood
|
Bottom
|
10.7
|
8:43
|
8.99
|
8.22
|
31.8
|
27.51
|
1.96
|
<2
|
<0.10
|
0.137
|
W
|
|
NF1
|
20200526
|
Cloudy
|
Moderate
|
Mid-Flood
|
Middle
|
5.85
|
8:44
|
7.63
|
8.24
|
31.7
|
27.5
|
1.2
|
<2
|
<0.10
|
0.15
|
NW
|
|
NF1
|
20200526
|
Cloudy
|
Moderate
|
Mid-Flood
|
Middle
|
5.85
|
8:44
|
7.35
|
8.26
|
32.2
|
27.36
|
1.3
|
<2
|
<0.10
|
0.184
|
W
|
|
NF1
|
20200526
|
Cloudy
|
Moderate
|
Mid-Flood
|
Surface
|
1
|
8:45
|
8.36
|
8.06
|
32.26
|
27.71
|
1.22
|
<2
|
<0.10
|
0.179
|
NW
|
|
NF1
|
20200526
|
Cloudy
|
Moderate
|
Mid-Flood
|
Surface
|
1
|
8:45
|
8.6
|
8.17
|
31.38
|
27.3
|
1.14
|
<2
|
<0.10
|
0.151
|
W
|
|
NF2
|
20200526
|
Cloudy
|
Moderate
|
Mid-Flood
|
Bottom
|
9.4
|
10:18
|
8.43
|
8.15
|
32.28
|
27.4
|
1.79
|
<2
|
<0.10
|
0.128
|
W
|
|
NF2
|
20200526
|
Cloudy
|
Moderate
|
Mid-Flood
|
Bottom
|
9.4
|
10:18
|
7.66
|
8.07
|
31.8
|
27.58
|
1.68
|
<2
|
<0.10
|
0.148
|
NW
|
|
NF2
|
20200526
|
Cloudy
|
Moderate
|
Mid-Flood
|
Middle
|
5.2
|
10:19
|
8.05
|
8.1
|
31.63
|
27.57
|
1.3
|
<2
|
<0.10
|
0.166
|
W
|
|
NF2
|
20200526
|
Cloudy
|
Moderate
|
Mid-Flood
|
Middle
|
5.2
|
10:19
|
7.34
|
8.17
|
31.28
|
27.79
|
1.24
|
<2
|
<0.10
|
0.161
|
W
|
|
NF2
|
20200526
|
Cloudy
|
Moderate
|
Mid-Flood
|
Surface
|
1
|
10:20
|
8.16
|
8.11
|
31.67
|
27.46
|
1.44
|
<2
|
<0.10
|
0.148
|
W
|
|
NF2
|
20200526
|
Cloudy
|
Moderate
|
Mid-Flood
|
Surface
|
1
|
10:20
|
7.7
|
8.17
|
31.92
|
27.46
|
1.31
|
<2
|
<0.10
|
0.169
|
W
|
|
NF3
|
20200526
|
Cloudy
|
Moderate
|
Mid-Flood
|
Bottom
|
9.8
|
10:26
|
8.92
|
8.12
|
32.2
|
27.81
|
1.86
|
<2
|
<0.10
|
0.194
|
W
|
|
NF3
|
20200526
|
Cloudy
|
Moderate
|
Mid-Flood
|
Bottom
|
9.8
|
10:26
|
7.53
|
8.03
|
31.54
|
27.38
|
1.83
|
<2
|
<0.10
|
0.179
|
SW
|
|
NF3
|
20200526
|
Cloudy
|
Moderate
|
Mid-Flood
|
Middle
|
5.4
|
10:27
|
8.71
|
8.03
|
31.25
|
27.68
|
1.32
|
<2
|
<0.10
|
0.157
|
W
|
|
NF3
|
20200526
|
Cloudy
|
Moderate
|
Mid-Flood
|
Middle
|
5.4
|
10:27
|
9.03
|
8.04
|
31.51
|
27.67
|
1.38
|
<2
|
<0.10
|
0.128
|
NW
|
|
NF3
|
20200526
|
Cloudy
|
Moderate
|
Mid-Flood
|
Surface
|
1
|
10:28
|
8.34
|
8.09
|
31.33
|
27.54
|
1.25
|
<2
|
<0.10
|
0.162
|
W
|
|
NF3
|
20200526
|
Cloudy
|
Moderate
|
Mid-Flood
|
Surface
|
1
|
10:28
|
7.47
|
8.05
|
32.21
|
27.31
|
1.12
|
<2
|
<0.10
|
0.13
|
W
|
|
WSR01
|
20200526
|
Cloudy
|
Moderate
|
Mid-Flood
|
Bottom
|
8.5
|
10:53
|
8.52
|
8.12
|
32.07
|
27.46
|
2.02
|
<2
|
<0.10
|
0.165
|
W
|
|
WSR01
|
20200526
|
Cloudy
|
Moderate
|
Mid-Flood
|
Bottom
|
8.5
|
10:53
|
7.38
|
8.25
|
31.73
|
27.33
|
1.83
|
<2
|
<0.10
|
0.143
|
W
|
|
WSR01
|
20200526
|
Cloudy
|
Moderate
|
Mid-Flood
|
Middle
|
4.75
|
10:54
|
7.73
|
8.28
|
32.24
|
27.75
|
1.2
|
<2
|
<0.10
|
0.133
|
W
|
|
WSR01
|
20200526
|
Cloudy
|
Moderate
|
Mid-Flood
|
Middle
|
4.75
|
10:54
|
8.81
|
8.07
|
32.1
|
27.63
|
1.17
|
<2
|
<0.10
|
0.178
|
NW
|
|
WSR01
|
20200526
|
Cloudy
|
Moderate
|
Mid-Flood
|
Surface
|
1
|
10:55
|
8.47
|
8.15
|
32.07
|
27.61
|
1.17
|
<2
|
<0.10
|
0.139
|
W
|
|
WSR01
|
20200526
|
Cloudy
|
Moderate
|
Mid-Flood
|
Surface
|
1
|
10:55
|
7.37
|
8.24
|
31.89
|
27.43
|
1.44
|
<2
|
<0.10
|
0.14
|
W
|
|
WSR02
|
20200526
|
Cloudy
|
Moderate
|
Mid-Flood
|
Bottom
|
8.2
|
10:29
|
8.92
|
8.27
|
31.92
|
27.75
|
1.87
|
<2
|
<0.10
|
0.166
|
NW
|
|
WSR02
|
20200526
|
Cloudy
|
Moderate
|
Mid-Flood
|
Bottom
|
8.2
|
10:29
|
8.79
|
8.28
|
31.45
|
27.38
|
1.89
|
<2
|
<0.10
|
0.157
|
NW
|
|
WSR02
|
20200526
|
Cloudy
|
Moderate
|
Mid-Flood
|
Middle
|
4.6
|
10:30
|
7.37
|
8.15
|
31.18
|
27.65
|
1.17
|
<2
|
<0.10
|
0.196
|
NW
|
|
WSR02
|
20200526
|
Cloudy
|
Moderate
|
Mid-Flood
|
Middle
|
4.6
|
10:30
|
9
|
8.19
|
32.19
|
27.65
|
1.34
|
<2
|
<0.10
|
0.192
|
W
|
|
WSR02
|
20200526
|
Cloudy
|
Moderate
|
Mid-Flood
|
Surface
|
1
|
10:31
|
7.53
|
8.08
|
31.33
|
27.65
|
1.37
|
<2
|
<0.10
|
0.177
|
SW
|
|
WSR02
|
20200526
|
Cloudy
|
Moderate
|
Mid-Flood
|
Surface
|
1
|
10:31
|
7.39
|
8.07
|
31.54
|
27.65
|
1.39
|
<2
|
<0.10
|
0.13
|
W
|
|
WSR03
|
20200526
|
Cloudy
|
Moderate
|
Mid-Flood
|
Bottom
|
6.9
|
10:01
|
8.84
|
8.18
|
31.45
|
27.61
|
2.02
|
<2
|
<0.10
|
0.196
|
W
|
|
WSR03
|
20200526
|
Cloudy
|
Moderate
|
Mid-Flood
|
Bottom
|
6.9
|
10:01
|
7.38
|
8.2
|
31.43
|
27.74
|
1.71
|
<2
|
<0.10
|
0.186
|
W
|
|
WSR03
|
20200526
|
Cloudy
|
Moderate
|
Mid-Flood
|
Middle
|
3.95
|
10:02
|
7.7
|
8.18
|
31.48
|
27.69
|
1.42
|
<2
|
<0.10
|
0.195
|
NW
|
|
WSR03
|
20200526
|
Cloudy
|
Moderate
|
Mid-Flood
|
Middle
|
3.95
|
10:02
|
8.16
|
8.18
|
31.58
|
27.57
|
1.28
|
<2
|
<0.10
|
0.181
|
NW
|
|
WSR03
|
20200526
|
Cloudy
|
Moderate
|
Mid-Flood
|
Surface
|
1
|
10:03
|
8.22
|
8.23
|
32.24
|
27.59
|
1.17
|
2
|
<0.10
|
0.165
|
NW
|
|
WSR03
|
20200526
|
Cloudy
|
Moderate
|
Mid-Flood
|
Surface
|
1
|
10:03
|
8.12
|
8.25
|
31.08
|
27.58
|
1.17
|
2
|
<0.10
|
0.147
|
W
|
|
WSR04
|
20200526
|
Cloudy
|
Moderate
|
Mid-Flood
|
Bottom
|
6.2
|
9:43
|
8.54
|
8.27
|
31.29
|
27.49
|
1.9
|
<2
|
<0.10
|
0.166
|
W
|
|
WSR04
|
20200526
|
Cloudy
|
Moderate
|
Mid-Flood
|
Bottom
|
6.2
|
9:43
|
8.4
|
8.06
|
31.41
|
27.32
|
1.89
|
<2
|
<0.10
|
0.137
|
SW
|
|
WSR04
|
20200526
|
Cloudy
|
Moderate
|
Mid-Flood
|
Middle
|
3.6
|
9:44
|
8.85
|
8.13
|
31.28
|
27.53
|
1.21
|
<2
|
<0.10
|
0.154
|
W
|
|
WSR04
|
20200526
|
Cloudy
|
Moderate
|
Mid-Flood
|
Middle
|
3.6
|
9:44
|
7.28
|
8.05
|
31.89
|
27.76
|
1.18
|
<2
|
<0.10
|
0.169
|
W
|
|
WSR04
|
20200526
|
Cloudy
|
Moderate
|
Mid-Flood
|
Surface
|
1
|
9:45
|
7.73
|
8.09
|
31.62
|
27.63
|
1.42
|
<2
|
<0.10
|
0.156
|
W
|
|
WSR04
|
20200526
|
Cloudy
|
Moderate
|
Mid-Flood
|
Surface
|
1
|
9:45
|
7.93
|
8.06
|
32.06
|
27.36
|
1.38
|
<2
|
<0.10
|
0.15
|
W
|
|
WSR16
|
20200526
|
Cloudy
|
Moderate
|
Mid-Flood
|
Bottom
|
11
|
8:24
|
8.34
|
8.14
|
32.17
|
27.43
|
1.81
|
<2
|
<0.10
|
0.215
|
NW
|
|
WSR16
|
20200526
|
Cloudy
|
Moderate
|
Mid-Flood
|
Bottom
|
11
|
8:24
|
8.98
|
8.14
|
31.74
|
27.7
|
1.77
|
<2
|
<0.10
|
0.196
|
NW
|
|
WSR16
|
20200526
|
Cloudy
|
Moderate
|
Mid-Flood
|
Middle
|
6
|
8:25
|
7.83
|
8.18
|
31.18
|
27.35
|
1.38
|
<2
|
<0.10
|
0.173
|
NW
|
|
WSR16
|
20200526
|
Cloudy
|
Moderate
|
Mid-Flood
|
Middle
|
6
|
8:25
|
8.07
|
8.03
|
31.34
|
27.52
|
1.39
|
<2
|
<0.10
|
0.177
|
NW
|
|
WSR16
|
20200526
|
Cloudy
|
Moderate
|
Mid-Flood
|
Surface
|
1
|
8:26
|
8.07
|
8.05
|
31.69
|
27.71
|
1.14
|
<2
|
<0.10
|
0.188
|
NW
|
|
WSR16
|
20200526
|
Cloudy
|
Moderate
|
Mid-Flood
|
Surface
|
1
|
8:26
|
8.63
|
8.18
|
32.11
|
27.64
|
1.25
|
<2
|
<0.10
|
0.166
|
NW
|
|
WSR33
|
20200526
|
Cloudy
|
Moderate
|
Mid-Flood
|
Bottom
|
6.4
|
9:25
|
8.87
|
8.2
|
31.89
|
27.47
|
1.71
|
<2
|
<0.10
|
0.188
|
NW
|
|
WSR33
|
20200526
|
Cloudy
|
Moderate
|
Mid-Flood
|
Bottom
|
6.4
|
9:25
|
7.83
|
8.06
|
31.72
|
27.65
|
1.7
|
<2
|
<0.10
|
0.153
|
W
|
|
WSR33
|
20200526
|
Cloudy
|
Moderate
|
Mid-Flood
|
Middle
|
3.7
|
9:26
|
8.73
|
8.21
|
31.83
|
27.68
|
1.38
|
<2
|
<0.10
|
0.173
|
NW
|
|
WSR33
|
20200526
|
Cloudy
|
Moderate
|
Mid-Flood
|
Middle
|
3.7
|
9:26
|
7.96
|
8.13
|
31.94
|
27.4
|
1.14
|
<2
|
<0.10
|
0.154
|
W
|
|
WSR33
|
20200526
|
Cloudy
|
Moderate
|
Mid-Flood
|
Surface
|
1
|
9:27
|
9.01
|
8.15
|
31.88
|
27.8
|
1.39
|
<2
|
<0.10
|
0.154
|
W
|
|
WSR33
|
20200526
|
Cloudy
|
Moderate
|
Mid-Flood
|
Surface
|
1
|
9:27
|
8.89
|
8.04
|
31.11
|
27.39
|
1.29
|
<2
|
<0.10
|
0.162
|
W
|
|
WSR36
|
20200526
|
Cloudy
|
Moderate
|
Mid-Flood
|
Bottom
|
3.9
|
9:13
|
8.89
|
8.11
|
31.28
|
27.36
|
1.78
|
<2
|
<0.10
|
0.183
|
SW
|
|
WSR36
|
20200526
|
Cloudy
|
Moderate
|
Mid-Flood
|
Bottom
|
3.9
|
9:13
|
7.54
|
8.24
|
32.25
|
27.81
|
1.86
|
<2
|
<0.10
|
0.142
|
SW
|
|
WSR36
|
20200526
|
Cloudy
|
Moderate
|
Mid-Flood
|
Surface
|
1
|
9:14
|
8.41
|
8.23
|
31.75
|
27.36
|
1.21
|
<2
|
<0.10
|
0.158
|
W
|
|
WSR36
|
20200526
|
Cloudy
|
Moderate
|
Mid-Flood
|
Surface
|
1
|
9:14
|
9.03
|
8.15
|
31.36
|
27.72
|
1.16
|
<2
|
<0.10
|
0.171
|
W
|
|
WSR37
|
20200526
|
Cloudy
|
Moderate
|
Mid-Flood
|
Bottom
|
7.7
|
8:57
|
8.88
|
8.17
|
32.09
|
27.51
|
1.82
|
<2
|
<0.10
|
0.166
|
W
|
|
WSR37
|
20200526
|
Cloudy
|
Moderate
|
Mid-Flood
|
Bottom
|
7.7
|
8:57
|
8.76
|
8.28
|
31.89
|
27.39
|
1.78
|
<2
|
<0.10
|
0.192
|
W
|
|
WSR37
|
20200526
|
Cloudy
|
Moderate
|
Mid-Flood
|
Middle
|
4.35
|
8:58
|
8.4
|
8.07
|
32.26
|
27.56
|
1.34
|
<2
|
<0.10
|
0.175
|
W
|
|
WSR37
|
20200526
|
Cloudy
|
Moderate
|
Mid-Flood
|
Middle
|
4.35
|
8:58
|
7.83
|
8.15
|
31.34
|
27.68
|
1.39
|
<2
|
<0.10
|
0.158
|
W
|
|
WSR37
|
20200526
|
Cloudy
|
Moderate
|
Mid-Flood
|
Surface
|
1
|
8:59
|
8.73
|
8.06
|
32
|
27.51
|
1.43
|
<2
|
<0.10
|
0.161
|
W
|
|
WSR37
|
20200526
|
Cloudy
|
Moderate
|
Mid-Flood
|
Surface
|
1
|
8:59
|
8.62
|
8.15
|
32.24
|
27.66
|
1.21
|
<2
|
<0.10
|
0.136
|
W
|
|
CE
|
20200526
|
Cloudy
|
Moderate
|
Mid-Ebb
|
Bottom
|
11.2
|
12:59
|
7.85
|
8.09
|
31.94
|
27.15
|
1.66
|
<2
|
<0.10
|
0.447
|
SE
|
|
CE
|
20200526
|
Cloudy
|
Moderate
|
Mid-Ebb
|
Bottom
|
11.2
|
12:59
|
8.85
|
8.31
|
31.94
|
27.3
|
2.25
|
<2
|
<0.10
|
0.368
|
SE
|
|
CE
|
20200526
|
Cloudy
|
Moderate
|
Mid-Ebb
|
Middle
|
6.1
|
13:00
|
7.48
|
8.21
|
31.66
|
27.63
|
1.82
|
<2
|
<0.10
|
0.349
|
E
|
|
CE
|
20200526
|
Cloudy
|
Moderate
|
Mid-Ebb
|
Middle
|
6.1
|
13:00
|
7.89
|
8.05
|
31.61
|
27.22
|
1.67
|
<2
|
<0.10
|
0.429
|
SE
|
|
CE
|
20200526
|
Cloudy
|
Moderate
|
Mid-Ebb
|
Surface
|
1
|
13:01
|
8.2
|
8.09
|
32.13
|
27.2
|
1.46
|
<2
|
<0.10
|
0.313
|
E
|
|
CE
|
20200526
|
Cloudy
|
Moderate
|
Mid-Ebb
|
Surface
|
1
|
13:01
|
7.87
|
8.07
|
31.7
|
27.59
|
1.28
|
<2
|
<0.10
|
0.451
|
E
|
|
CF
|
20200526
|
Cloudy
|
Moderate
|
Mid-Ebb
|
Bottom
|
11
|
13:03
|
8.18
|
8.03
|
31.83
|
27.45
|
1.67
|
<2
|
<0.10
|
0.209
|
SE
|
|
CF
|
20200526
|
Cloudy
|
Moderate
|
Mid-Ebb
|
Bottom
|
11
|
13:03
|
8.06
|
8.1
|
31.8
|
27.21
|
2.3
|
<2
|
<0.10
|
0.15
|
E
|
|
CF
|
20200526
|
Cloudy
|
Moderate
|
Mid-Ebb
|
Middle
|
6
|
13:04
|
7.84
|
8.31
|
32.1
|
27.11
|
1.72
|
<2
|
<0.10
|
0.214
|
E
|
|
CF
|
20200526
|
Cloudy
|
Moderate
|
Mid-Ebb
|
Middle
|
6
|
13:04
|
8.39
|
8.26
|
31.64
|
27.11
|
1.47
|
<2
|
<0.10
|
0.141
|
E
|
|
CF
|
20200526
|
Cloudy
|
Moderate
|
Mid-Ebb
|
Surface
|
1
|
13:05
|
7.95
|
8.02
|
31.81
|
27.57
|
1.59
|
<2
|
<0.10
|
0.214
|
SE
|
|
CF
|
20200526
|
Cloudy
|
Moderate
|
Mid-Ebb
|
Surface
|
1
|
13:05
|
7.79
|
8.08
|
31.92
|
27.26
|
1.18
|
<2
|
<0.10
|
0.166
|
SE
|
|
NF1
|
20200526
|
Cloudy
|
Moderate
|
Mid-Ebb
|
Bottom
|
10.7
|
13:39
|
7.82
|
8.28
|
32.2
|
27.65
|
2.07
|
<2
|
<0.10
|
0.178
|
E
|
|
NF1
|
20200526
|
Cloudy
|
Moderate
|
Mid-Ebb
|
Bottom
|
10.7
|
13:39
|
7.97
|
8.27
|
32.12
|
27.35
|
1.79
|
<2
|
<0.10
|
0.211
|
E
|
|
NF1
|
20200526
|
Cloudy
|
Moderate
|
Mid-Ebb
|
Middle
|
5.85
|
13:40
|
8.26
|
8.14
|
31.79
|
27.49
|
1.39
|
<2
|
<0.10
|
0.158
|
SE
|
|
NF1
|
20200526
|
Cloudy
|
Moderate
|
Mid-Ebb
|
Middle
|
5.85
|
13:40
|
7.39
|
8.23
|
32.23
|
27.32
|
1.37
|
<2
|
<0.10
|
0.148
|
E
|
|
NF1
|
20200526
|
Cloudy
|
Moderate
|
Mid-Ebb
|
Surface
|
1
|
13:41
|
8.01
|
8.25
|
32.13
|
27.24
|
1.33
|
<2
|
<0.10
|
0.132
|
E
|
|
NF1
|
20200526
|
Cloudy
|
Moderate
|
Mid-Ebb
|
Surface
|
1
|
13:41
|
8.04
|
8.2
|
31.7
|
27.35
|
1.46
|
<2
|
<0.10
|
0.167
|
E
|
|
NF2
|
20200526
|
Cloudy
|
Moderate
|
Mid-Ebb
|
Bottom
|
7.8
|
15:14
|
8.19
|
8.09
|
31.89
|
27.61
|
2.1
|
<2
|
<0.10
|
0.189
|
SE
|
|
NF2
|
20200526
|
Cloudy
|
Moderate
|
Mid-Ebb
|
Bottom
|
7.8
|
15:14
|
7.64
|
8.2
|
32.15
|
27.47
|
1.93
|
<2
|
<0.10
|
0.201
|
E
|
|
NF2
|
20200526
|
Cloudy
|
Moderate
|
Mid-Ebb
|
Middle
|
4.4
|
15:15
|
7.64
|
8.15
|
31.99
|
27.28
|
1.38
|
<2
|
<0.10
|
0.174
|
SE
|
|
NF2
|
20200526
|
Cloudy
|
Moderate
|
Mid-Ebb
|
Middle
|
4.4
|
15:15
|
7.43
|
8.04
|
32.05
|
27.49
|
1.7
|
<2
|
<0.10
|
0.216
|
SE
|
|
NF2
|
20200526
|
Cloudy
|
Moderate
|
Mid-Ebb
|
Surface
|
1
|
15:16
|
7.62
|
8.14
|
31.84
|
27.17
|
1.44
|
<2
|
<0.10
|
0.187
|
E
|
|
NF2
|
20200526
|
Cloudy
|
Moderate
|
Mid-Ebb
|
Surface
|
1
|
15:16
|
7.87
|
8.17
|
32.24
|
27.24
|
1.53
|
<2
|
<0.10
|
0.187
|
E
|
|
NF3
|
20200526
|
Cloudy
|
Moderate
|
Mid-Ebb
|
Bottom
|
9.2
|
15:23
|
7.49
|
8.06
|
31.77
|
27.26
|
2.02
|
<2
|
<0.10
|
0.202
|
SE
|
|
NF3
|
20200526
|
Cloudy
|
Moderate
|
Mid-Ebb
|
Bottom
|
9.2
|
15:23
|
7.66
|
8.25
|
32.11
|
27.43
|
1.68
|
<2
|
<0.10
|
0.192
|
E
|
|
NF3
|
20200526
|
Cloudy
|
Moderate
|
Mid-Ebb
|
Middle
|
5.1
|
15:24
|
8.05
|
8.04
|
31.61
|
27.15
|
1.5
|
<2
|
<0.10
|
0.2
|
E
|
|
NF3
|
20200526
|
Cloudy
|
Moderate
|
Mid-Ebb
|
Middle
|
5.1
|
15:24
|
8.05
|
8.01
|
31.79
|
27.49
|
1.41
|
<2
|
<0.10
|
0.178
|
E
|
|
NF3
|
20200526
|
Cloudy
|
Moderate
|
Mid-Ebb
|
Surface
|
1
|
15:25
|
7.45
|
8.2
|
31.92
|
27.57
|
1.7
|
<2
|
<0.10
|
0.218
|
E
|
|
NF3
|
20200526
|
Cloudy
|
Moderate
|
Mid-Ebb
|
Surface
|
1
|
15:25
|
7.69
|
8.2
|
32.19
|
27.36
|
1.77
|
<2
|
<0.10
|
0.2
|
SE
|
|
WSR01
|
20200526
|
Cloudy
|
Moderate
|
Mid-Ebb
|
Bottom
|
7.1
|
15:54
|
8.25
|
8.25
|
32.2
|
27.43
|
1.88
|
2
|
<0.10
|
0.214
|
SE
|
|
WSR01
|
20200526
|
Cloudy
|
Moderate
|
Mid-Ebb
|
Bottom
|
7.1
|
15:54
|
8.26
|
8.21
|
32.02
|
27.62
|
1.83
|
3
|
<0.10
|
0.177
|
E
|
|
WSR01
|
20200526
|
Cloudy
|
Moderate
|
Mid-Ebb
|
Middle
|
4.05
|
15:55
|
8.39
|
8.02
|
32.09
|
27.24
|
1.66
|
<2
|
<0.10
|
0.175
|
SE
|
|
WSR01
|
20200526
|
Cloudy
|
Moderate
|
Mid-Ebb
|
Middle
|
4.05
|
15:55
|
8.1
|
8.2
|
31.91
|
27.66
|
1.32
|
<2
|
<0.10
|
0.173
|
SE
|
|
WSR01
|
20200526
|
Cloudy
|
Moderate
|
Mid-Ebb
|
Surface
|
1
|
15:56
|
7.94
|
8.22
|
32.02
|
27.6
|
1.45
|
<2
|
<0.10
|
0.156
|
SE
|
|
WSR01
|
20200526
|
Cloudy
|
Moderate
|
Mid-Ebb
|
Surface
|
1
|
15:56
|
8.42
|
8.1
|
31.91
|
27.33
|
1.55
|
<2
|
<0.10
|
0.206
|
SE
|
|
WSR02
|
20200526
|
Cloudy
|
Moderate
|
Mid-Ebb
|
Bottom
|
7.1
|
15:31
|
8.83
|
8.31
|
31.88
|
27.63
|
1.75
|
<2
|
<0.10
|
0.132
|
SE
|
|
WSR02
|
20200526
|
Cloudy
|
Moderate
|
Mid-Ebb
|
Bottom
|
7.1
|
15:31
|
8.56
|
8.07
|
32.01
|
27.6
|
1.86
|
<2
|
<0.10
|
0.216
|
SE
|
|
WSR02
|
20200526
|
Cloudy
|
Moderate
|
Mid-Ebb
|
Middle
|
4.05
|
15:32
|
7.58
|
8.28
|
31.68
|
27.68
|
1.79
|
<2
|
<0.10
|
0.198
|
E
|
|
WSR02
|
20200526
|
Cloudy
|
Moderate
|
Mid-Ebb
|
Middle
|
4.05
|
15:32
|
8.8
|
8.11
|
31.66
|
27.66
|
1.44
|
<2
|
<0.10
|
0.175
|
SE
|
|
WSR02
|
20200526
|
Cloudy
|
Moderate
|
Mid-Ebb
|
Surface
|
1
|
15:33
|
8.02
|
8.18
|
32.12
|
27.48
|
1.69
|
<2
|
<0.10
|
0.146
|
SE
|
|
WSR02
|
20200526
|
Cloudy
|
Moderate
|
Mid-Ebb
|
Surface
|
1
|
15:33
|
8.06
|
8.21
|
31.82
|
27.33
|
1.37
|
<2
|
<0.10
|
0.216
|
E
|
|
WSR03
|
20200526
|
Cloudy
|
Moderate
|
Mid-Ebb
|
Bottom
|
6.2
|
14:57
|
8.83
|
8.22
|
31.77
|
27.5
|
1.79
|
3
|
<0.10
|
0.131
|
E
|
|
WSR03
|
20200526
|
Cloudy
|
Moderate
|
Mid-Ebb
|
Bottom
|
6.2
|
14:57
|
8.45
|
8.21
|
31.79
|
27.59
|
2.1
|
2
|
<0.10
|
0.197
|
E
|
|
WSR03
|
20200526
|
Cloudy
|
Moderate
|
Mid-Ebb
|
Middle
|
3.6
|
14:58
|
8.55
|
8.21
|
31.55
|
27.49
|
1.49
|
<2
|
<0.10
|
0.205
|
SE
|
|
WSR03
|
20200526
|
Cloudy
|
Moderate
|
Mid-Ebb
|
Middle
|
3.6
|
14:58
|
7.69
|
8.1
|
31.97
|
27.17
|
1.68
|
<2
|
<0.10
|
0.202
|
SE
|
|
WSR03
|
20200526
|
Cloudy
|
Moderate
|
Mid-Ebb
|
Surface
|
1
|
14:59
|
8.69
|
8.05
|
31.79
|
27.19
|
1.2
|
<2
|
<0.10
|
0.187
|
SE
|
|
WSR03
|
20200526
|
Cloudy
|
Moderate
|
Mid-Ebb
|
Surface
|
1
|
14:59
|
8.28
|
8.13
|
31.55
|
27.18
|
1.41
|
<2
|
<0.10
|
0.148
|
E
|
|
WSR04
|
20200526
|
Cloudy
|
Moderate
|
Mid-Ebb
|
Bottom
|
6.2
|
14:40
|
7.43
|
8.14
|
31.98
|
27.6
|
1.8
|
<2
|
<0.10
|
0.179
|
SE
|
|
WSR04
|
20200526
|
Cloudy
|
Moderate
|
Mid-Ebb
|
Bottom
|
6.2
|
14:40
|
8.36
|
8.11
|
31.76
|
27.61
|
2.26
|
<2
|
<0.10
|
0.17
|
SE
|
|
WSR04
|
20200526
|
Cloudy
|
Moderate
|
Mid-Ebb
|
Middle
|
3.6
|
14:41
|
7.67
|
8.23
|
32.01
|
27.22
|
1.85
|
<2
|
<0.10
|
0.155
|
E
|
|
WSR04
|
20200526
|
Cloudy
|
Moderate
|
Mid-Ebb
|
Middle
|
3.6
|
14:41
|
7.55
|
8.01
|
31.59
|
27.18
|
1.87
|
<2
|
<0.10
|
0.175
|
SE
|
|
WSR04
|
20200526
|
Cloudy
|
Moderate
|
Mid-Ebb
|
Surface
|
1
|
14:42
|
8.59
|
8.06
|
32.07
|
27.29
|
1.35
|
<2
|
<0.10
|
0.171
|
SE
|
|
WSR04
|
20200526
|
Cloudy
|
Moderate
|
Mid-Ebb
|
Surface
|
1
|
14:42
|
7.88
|
8.15
|
31.96
|
27.52
|
1.44
|
<2
|
<0.10
|
0.209
|
E
|
|
WSR16
|
20200526
|
Cloudy
|
Moderate
|
Mid-Ebb
|
Bottom
|
11
|
13:19
|
8.15
|
8.06
|
31.73
|
27.6
|
2.25
|
2
|
<0.10
|
0.149
|
SE
|
|
WSR16
|
20200526
|
Cloudy
|
Moderate
|
Mid-Ebb
|
Bottom
|
11
|
13:19
|
7.58
|
8.14
|
31.56
|
27.61
|
2.17
|
3
|
<0.10
|
0.211
|
E
|
|
WSR16
|
20200526
|
Cloudy
|
Moderate
|
Mid-Ebb
|
Middle
|
6
|
13:20
|
8.72
|
8.1
|
31.92
|
27.14
|
1.78
|
<2
|
<0.10
|
0.142
|
SE
|
|
WSR16
|
20200526
|
Cloudy
|
Moderate
|
Mid-Ebb
|
Middle
|
6
|
13:20
|
7.77
|
8.23
|
31.8
|
27.28
|
1.62
|
<2
|
<0.10
|
0.218
|
SE
|
|
WSR16
|
20200526
|
Cloudy
|
Moderate
|
Mid-Ebb
|
Surface
|
1
|
13:21
|
8.41
|
8.18
|
31.56
|
27.15
|
1.19
|
<2
|
<0.10
|
0.159
|
SE
|
|
WSR16
|
20200526
|
Cloudy
|
Moderate
|
Mid-Ebb
|
Surface
|
1
|
13:21
|
8.61
|
8.3
|
32.11
|
27.23
|
1.37
|
<2
|
<0.10
|
0.214
|
E
|
|
WSR33
|
20200526
|
Cloudy
|
Moderate
|
Mid-Ebb
|
Bottom
|
6.5
|
14:24
|
8.06
|
8.09
|
31.82
|
27.11
|
1.9
|
<2
|
<0.10
|
0.139
|
SE
|
|
WSR33
|
20200526
|
Cloudy
|
Moderate
|
Mid-Ebb
|
Bottom
|
6.5
|
14:24
|
8.6
|
8.25
|
31.56
|
27.69
|
1.69
|
<2
|
<0.10
|
0.144
|
SE
|
|
WSR33
|
20200526
|
Cloudy
|
Moderate
|
Mid-Ebb
|
Middle
|
3.75
|
14:25
|
7.49
|
8.07
|
31.77
|
27.66
|
1.51
|
2
|
<0.10
|
0.197
|
SE
|
|
WSR33
|
20200526
|
Cloudy
|
Moderate
|
Mid-Ebb
|
Middle
|
3.75
|
14:25
|
8.76
|
8.02
|
31.73
|
27.63
|
1.31
|
3
|
<0.10
|
0.207
|
E
|
|
WSR33
|
20200526
|
Cloudy
|
Moderate
|
Mid-Ebb
|
Surface
|
1
|
14:26
|
7.98
|
8.18
|
31.83
|
27.46
|
1.57
|
2
|
<0.10
|
0.181
|
E
|
|
WSR33
|
20200526
|
Cloudy
|
Moderate
|
Mid-Ebb
|
Surface
|
1
|
14:26
|
7.5
|
8.2
|
31.67
|
27.48
|
1.76
|
3
|
<0.10
|
0.171
|
SE
|
|
WSR36
|
20200526
|
Cloudy
|
Moderate
|
Mid-Ebb
|
Bottom
|
3.9
|
14:11
|
7.87
|
8.15
|
31.68
|
27.61
|
1.93
|
<2
|
<0.10
|
0.139
|
SE
|
|
WSR36
|
20200526
|
Cloudy
|
Moderate
|
Mid-Ebb
|
Bottom
|
3.9
|
14:11
|
7.59
|
8.22
|
32.17
|
27.28
|
1.67
|
<2
|
<0.10
|
0.197
|
SE
|
|
WSR36
|
20200526
|
Cloudy
|
Moderate
|
Mid-Ebb
|
Surface
|
1
|
14:12
|
7.73
|
8.19
|
32.15
|
27.59
|
1.61
|
<2
|
<0.10
|
0.197
|
E
|
|
WSR36
|
20200526
|
Cloudy
|
Moderate
|
Mid-Ebb
|
Surface
|
1
|
14:12
|
8.49
|
8.28
|
31.81
|
27.55
|
1.19
|
<2
|
<0.10
|
0.167
|
E
|
|
WSR37
|
20200526
|
Cloudy
|
Moderate
|
Mid-Ebb
|
Bottom
|
6.5
|
13:53
|
8.1
|
8.05
|
32.04
|
27.49
|
2.08
|
<2
|
<0.10
|
0.142
|
E
|
|
WSR37
|
20200526
|
Cloudy
|
Moderate
|
Mid-Ebb
|
Bottom
|
6.5
|
13:53
|
7.62
|
8.05
|
31.72
|
27.19
|
1.84
|
<2
|
<0.10
|
0.221
|
E
|
|
WSR37
|
20200526
|
Cloudy
|
Moderate
|
Mid-Ebb
|
Middle
|
3.75
|
13:54
|
8.06
|
8.19
|
31.83
|
27.39
|
1.87
|
<2
|
<0.10
|
0.18
|
SE
|
|
WSR37
|
20200526
|
Cloudy
|
Moderate
|
Mid-Ebb
|
Middle
|
3.75
|
13:54
|
8
|
8.19
|
32.19
|
27.29
|
1.71
|
<2
|
<0.10
|
0.186
|
E
|
|
WSR37
|
20200526
|
Cloudy
|
Moderate
|
Mid-Ebb
|
Surface
|
1
|
13:55
|
7.72
|
8.3
|
31.63
|
27.69
|
1.13
|
<2
|
<0.10
|
0.13
|
E
|
|
WSR37
|
20200526
|
Cloudy
|
Moderate
|
Mid-Ebb
|
Surface
|
1
|
13:55
|
8.09
|
8.1
|
31.79
|
27.12
|
1.63
|
<2
|
<0.10
|
0.151
|
SE
|
|
CE
|
20200528
|
Cloudy
|
Moderate
|
Mid-Flood
|
Bottom
|
12.1
|
8:50
|
9.49
|
7.99
|
32.36
|
26.27
|
0.59
|
2
|
<0.10
|
0.16
|
NW
|
|
CE
|
20200528
|
Cloudy
|
Moderate
|
Mid-Flood
|
Bottom
|
12.1
|
8:50
|
9.46
|
8.07
|
32.5
|
26.22
|
0.77
|
3
|
<0.10
|
0.183
|
N
|
|
CE
|
20200528
|
Cloudy
|
Moderate
|
Mid-Flood
|
Middle
|
6.55
|
8:51
|
9.33
|
8.09
|
32.24
|
26.29
|
0.87
|
3
|
<0.10
|
0.195
|
NW
|
|
CE
|
20200528
|
Cloudy
|
Moderate
|
Mid-Flood
|
Middle
|
6.55
|
8:51
|
8.93
|
8.08
|
32.23
|
26.31
|
0.51
|
2
|
<0.10
|
0.175
|
NW
|
|
CE
|
20200528
|
Cloudy
|
Moderate
|
Mid-Flood
|
Surface
|
1
|
8:52
|
8.39
|
8.06
|
31.81
|
26.47
|
0.97
|
2
|
<0.10
|
0.185
|
NW
|
|
CE
|
20200528
|
Cloudy
|
Moderate
|
Mid-Flood
|
Surface
|
1
|
8:52
|
8.38
|
8.05
|
31.8
|
26.48
|
0.8
|
2
|
<0.10
|
0.213
|
N
|
|
CF
|
20200528
|
Cloudy
|
Moderate
|
Mid-Flood
|
Bottom
|
11.4
|
8:00
|
9.88
|
8.07
|
32.19
|
26.4
|
1.54
|
<2
|
<0.10
|
0.242
|
W
|
|
CF
|
20200528
|
Cloudy
|
Moderate
|
Mid-Flood
|
Bottom
|
11.4
|
8:00
|
8.57
|
8.09
|
31.93
|
26.78
|
1.28
|
<2
|
<0.10
|
0.198
|
SW
|
|
CF
|
20200528
|
Cloudy
|
Moderate
|
Mid-Flood
|
Middle
|
6.2
|
8:01
|
8.67
|
8.19
|
32.1
|
26.63
|
0.81
|
3
|
<0.10
|
0.216
|
W
|
|
CF
|
20200528
|
Cloudy
|
Moderate
|
Mid-Flood
|
Middle
|
6.2
|
8:01
|
9.71
|
8.21
|
32.04
|
26.37
|
0.71
|
2
|
<0.10
|
0.202
|
W
|
|
CF
|
20200528
|
Cloudy
|
Moderate
|
Mid-Flood
|
Surface
|
1
|
8:02
|
9.46
|
8.09
|
32.18
|
26.46
|
1.23
|
2
|
<0.10
|
0.185
|
W
|
|
CF
|
20200528
|
Cloudy
|
Moderate
|
Mid-Flood
|
Surface
|
1
|
8:02
|
9.44
|
8.1
|
32.63
|
26.55
|
1.21
|
3
|
<0.10
|
0.208
|
W
|
|
NF1
|
20200528
|
Cloudy
|
Moderate
|
Mid-Flood
|
Bottom
|
10.7
|
9:25
|
10.02
|
8.05
|
32.35
|
26.68
|
0.47
|
3
|
<0.10
|
0.17
|
W
|
|
NF1
|
20200528
|
Cloudy
|
Moderate
|
Mid-Flood
|
Bottom
|
10.7
|
9:25
|
9.86
|
8.08
|
32.45
|
26.63
|
0.66
|
3
|
<0.10
|
0.18
|
SW
|
|
NF1
|
20200528
|
Cloudy
|
Moderate
|
Mid-Flood
|
Middle
|
5.85
|
9:26
|
10.1
|
8.14
|
32.17
|
26.78
|
0.85
|
2
|
<0.10
|
0.16
|
W
|
|
NF1
|
20200528
|
Cloudy
|
Moderate
|
Mid-Flood
|
Middle
|
5.85
|
9:26
|
9.95
|
8.13
|
32.15
|
26.78
|
0.67
|
3
|
<0.10
|
0.134
|
W
|
|
NF1
|
20200528
|
Cloudy
|
Moderate
|
Mid-Flood
|
Surface
|
1
|
9:27
|
8.95
|
8.13
|
32.02
|
26.91
|
0.93
|
2
|
<0.10
|
0.181
|
W
|
|
NF1
|
20200528
|
Cloudy
|
Moderate
|
Mid-Flood
|
Surface
|
1
|
9:27
|
8.67
|
8.12
|
32.04
|
26.92
|
0.75
|
2
|
<0.10
|
0.129
|
W
|
|
NF2
|
20200528
|
Cloudy
|
Moderate
|
Mid-Flood
|
Bottom
|
7.8
|
11:11
|
10.56
|
8.07
|
33.06
|
26.65
|
1.66
|
5
|
<0.10
|
0.18
|
W
|
|
NF2
|
20200528
|
Cloudy
|
Moderate
|
Mid-Flood
|
Bottom
|
7.8
|
11:11
|
10.33
|
8.07
|
33.09
|
26.61
|
1.5
|
6
|
<0.10
|
0.146
|
NW
|
|
NF2
|
20200528
|
Cloudy
|
Moderate
|
Mid-Flood
|
Middle
|
4.4
|
11:12
|
9.87
|
8.15
|
33.05
|
26.76
|
1.12
|
3
|
<0.10
|
0.185
|
NW
|
|
NF2
|
20200528
|
Cloudy
|
Moderate
|
Mid-Flood
|
Middle
|
4.4
|
11:12
|
9.68
|
8.13
|
33.09
|
26.75
|
1.32
|
4
|
<0.10
|
0.192
|
W
|
|
NF2
|
20200528
|
Cloudy
|
Moderate
|
Mid-Flood
|
Surface
|
1
|
11:13
|
8.94
|
8.11
|
32.87
|
26.91
|
0.63
|
3
|
<0.10
|
0.155
|
W
|
|
NF2
|
20200528
|
Cloudy
|
Moderate
|
Mid-Flood
|
Surface
|
1
|
11:13
|
8.79
|
8.09
|
32.87
|
26.92
|
0.96
|
4
|
<0.10
|
0.152
|
NW
|
|
NF3
|
20200528
|
Cloudy
|
Moderate
|
Mid-Flood
|
Bottom
|
7.3
|
11:24
|
12.63
|
8.07
|
32.26
|
26.65
|
0.54
|
4
|
<0.10
|
0.128
|
W
|
|
NF3
|
20200528
|
Cloudy
|
Moderate
|
Mid-Flood
|
Bottom
|
7.3
|
11:24
|
11.34
|
8.07
|
32.24
|
26.64
|
0.58
|
3
|
<0.10
|
0.145
|
SW
|
|
NF3
|
20200528
|
Cloudy
|
Moderate
|
Mid-Flood
|
Middle
|
4.15
|
11:25
|
10.14
|
8.08
|
32.42
|
26.76
|
0.64
|
<2
|
<0.10
|
0.191
|
SW
|
|
NF3
|
20200528
|
Cloudy
|
Moderate
|
Mid-Flood
|
Middle
|
4.15
|
11:25
|
9.97
|
8.08
|
32.42
|
26.74
|
0.64
|
3
|
<0.10
|
0.195
|
SW
|
|
NF3
|
20200528
|
Cloudy
|
Moderate
|
Mid-Flood
|
Surface
|
1
|
11:26
|
8.85
|
8.11
|
32.09
|
26.93
|
0.96
|
<2
|
<0.10
|
0.137
|
SW
|
|
NF3
|
20200528
|
Cloudy
|
Moderate
|
Mid-Flood
|
Surface
|
1
|
11:26
|
8.88
|
8.07
|
32.11
|
26.95
|
1.05
|
<2
|
<0.10
|
0.174
|
W
|
|
WSR01
|
20200528
|
Cloudy
|
Moderate
|
Mid-Flood
|
Bottom
|
8.4
|
10:47
|
9.66
|
8.04
|
32.22
|
26.64
|
1.59
|
4
|
<0.10
|
0.194
|
W
|
|
WSR01
|
20200528
|
Cloudy
|
Moderate
|
Mid-Flood
|
Bottom
|
8.4
|
10:47
|
8.99
|
8.19
|
32.05
|
26.55
|
1.19
|
4
|
<0.10
|
0.129
|
W
|
|
WSR01
|
20200528
|
Cloudy
|
Moderate
|
Mid-Flood
|
Middle
|
4.7
|
10:48
|
9.71
|
8.23
|
32.41
|
26.69
|
0.89
|
3
|
<0.10
|
0.151
|
SW
|
|
WSR01
|
20200528
|
Cloudy
|
Moderate
|
Mid-Flood
|
Middle
|
4.7
|
10:48
|
8.46
|
8.05
|
32.52
|
26.54
|
1.05
|
2
|
<0.10
|
0.141
|
W
|
|
WSR01
|
20200528
|
Cloudy
|
Moderate
|
Mid-Flood
|
Surface
|
1
|
10:49
|
8.94
|
8.2
|
32.38
|
26.61
|
1.09
|
2
|
<0.10
|
0.147
|
SW
|
|
WSR01
|
20200528
|
Cloudy
|
Moderate
|
Mid-Flood
|
Surface
|
1
|
10:49
|
8.64
|
8.08
|
32.04
|
26.64
|
1.18
|
2
|
<0.10
|
0.188
|
NW
|
|
WSR02
|
20200528
|
Cloudy
|
Moderate
|
Mid-Flood
|
Bottom
|
8.1
|
10:24
|
8.49
|
8.04
|
32.27
|
26.6
|
1.36
|
<2
|
<0.10
|
0.191
|
W
|
|
WSR02
|
20200528
|
Cloudy
|
Moderate
|
Mid-Flood
|
Bottom
|
8.1
|
10:24
|
9.08
|
8.01
|
32.38
|
26.68
|
1.47
|
<2
|
<0.10
|
0.167
|
NW
|
|
WSR02
|
20200528
|
Cloudy
|
Moderate
|
Mid-Flood
|
Middle
|
4.55
|
10:25
|
9.06
|
8.19
|
32.57
|
26.58
|
1.03
|
<2
|
<0.10
|
0.129
|
W
|
|
WSR02
|
20200528
|
Cloudy
|
Moderate
|
Mid-Flood
|
Middle
|
4.55
|
10:25
|
9.19
|
8.23
|
32.33
|
26.31
|
0.81
|
<2
|
<0.10
|
0.157
|
W
|
|
WSR02
|
20200528
|
Cloudy
|
Moderate
|
Mid-Flood
|
Surface
|
1
|
10:26
|
9.45
|
8.02
|
31.91
|
26.45
|
0.79
|
3
|
<0.10
|
0.177
|
W
|
|
WSR02
|
20200528
|
Cloudy
|
Moderate
|
Mid-Flood
|
Surface
|
1
|
10:26
|
9.92
|
8.01
|
32.26
|
26.75
|
0.99
|
2
|
<0.10
|
0.159
|
W
|
|
WSR03
|
20200528
|
Cloudy
|
Moderate
|
Mid-Flood
|
Bottom
|
8.4
|
10:40
|
9.87
|
8.06
|
32.8
|
26.34
|
4.14
|
<2
|
<0.10
|
0.184
|
W
|
|
WSR03
|
20200528
|
Cloudy
|
Moderate
|
Mid-Flood
|
Bottom
|
8.4
|
10:40
|
9.56
|
8.06
|
32.78
|
26.38
|
4.12
|
<2
|
<0.10
|
0.173
|
W
|
|
WSR03
|
20200528
|
Cloudy
|
Moderate
|
Mid-Flood
|
Middle
|
4.7
|
10:41
|
9.83
|
8.15
|
32.35
|
26.7
|
1.01
|
<2
|
<0.10
|
0.14
|
W
|
|
WSR03
|
20200528
|
Cloudy
|
Moderate
|
Mid-Flood
|
Middle
|
4.7
|
10:41
|
9.73
|
8.12
|
32.39
|
26.69
|
1
|
<2
|
<0.10
|
0.148
|
W
|
|
WSR03
|
20200528
|
Cloudy
|
Moderate
|
Mid-Flood
|
Surface
|
1
|
10:42
|
9.13
|
8.13
|
29.9
|
26.74
|
0.31
|
<2
|
<0.10
|
0.16
|
SW
|
|
WSR03
|
20200528
|
Cloudy
|
Moderate
|
Mid-Flood
|
Surface
|
1
|
10:42
|
8.29
|
8.07
|
32.55
|
26.74
|
0.35
|
<2
|
<0.10
|
0.181
|
W
|
|
WSR04
|
20200528
|
Cloudy
|
Moderate
|
Mid-Flood
|
Bottom
|
7.2
|
10:25
|
10.18
|
8.08
|
32.69
|
26.77
|
0.99
|
<2
|
<0.10
|
0.186
|
W
|
|
WSR04
|
20200528
|
Cloudy
|
Moderate
|
Mid-Flood
|
Bottom
|
7.2
|
10:25
|
10.01
|
8.25
|
32.5
|
26.66
|
1.03
|
<2
|
<0.10
|
0.146
|
W
|
|
WSR04
|
20200528
|
Cloudy
|
Moderate
|
Mid-Flood
|
Middle
|
4.1
|
10:26
|
10.29
|
8.33
|
32.21
|
26.41
|
0.79
|
<2
|
<0.10
|
0.172
|
W
|
|
WSR04
|
20200528
|
Cloudy
|
Moderate
|
Mid-Flood
|
Middle
|
4.1
|
10:26
|
10.33
|
8.19
|
32.17
|
26.37
|
0.87
|
<2
|
<0.10
|
0.139
|
W
|
|
WSR04
|
20200528
|
Cloudy
|
Moderate
|
Mid-Flood
|
Surface
|
1
|
10:27
|
10.49
|
8.38
|
32.41
|
26.5
|
0.78
|
<2
|
<0.10
|
0.157
|
SW
|
|
WSR04
|
20200528
|
Cloudy
|
Moderate
|
Mid-Flood
|
Surface
|
1
|
10:27
|
10.55
|
8.28
|
32.68
|
26.54
|
0.57
|
<2
|
<0.10
|
0.186
|
NW
|
|
WSR16
|
20200528
|
Cloudy
|
Moderate
|
Mid-Flood
|
Bottom
|
11.7
|
11:14
|
9.76
|
8.02
|
32.25
|
26.42
|
1.18
|
<2
|
<0.10
|
0.176
|
N
|
|
WSR16
|
20200528
|
Cloudy
|
Moderate
|
Mid-Flood
|
Bottom
|
11.7
|
11:14
|
9.66
|
8.18
|
31.94
|
26.55
|
1.18
|
<2
|
<0.10
|
0.21
|
NW
|
|
WSR16
|
20200528
|
Cloudy
|
Moderate
|
Mid-Flood
|
Middle
|
6.35
|
11:15
|
9.17
|
8.01
|
32.61
|
26.41
|
0.94
|
<2
|
<0.10
|
0.192
|
NW
|
|
WSR16
|
20200528
|
Cloudy
|
Moderate
|
Mid-Flood
|
Middle
|
6.35
|
11:15
|
9.85
|
8.19
|
32.42
|
26.62
|
0.69
|
<2
|
<0.10
|
0.184
|
NW
|
|
WSR16
|
20200528
|
Cloudy
|
Moderate
|
Mid-Flood
|
Surface
|
1
|
11:16
|
9.66
|
8.22
|
32.29
|
26.45
|
0.87
|
<2
|
<0.10
|
0.173
|
NW
|
|
WSR16
|
20200528
|
Cloudy
|
Moderate
|
Mid-Flood
|
Surface
|
1
|
11:16
|
8.79
|
8.15
|
32.54
|
26.72
|
0.79
|
<2
|
<0.10
|
0.177
|
N
|
|
WSR33
|
20200528
|
Cloudy
|
Moderate
|
Mid-Flood
|
Bottom
|
7.4
|
10:10
|
10.76
|
8.09
|
32.04
|
26.98
|
0.85
|
3
|
<0.10
|
0.142
|
SW
|
|
WSR33
|
20200528
|
Cloudy
|
Moderate
|
Mid-Flood
|
Bottom
|
7.4
|
10:10
|
10.49
|
8.09
|
32.01
|
26.96
|
0.94
|
4
|
<0.10
|
0.149
|
W
|
|
WSR33
|
20200528
|
Cloudy
|
Moderate
|
Mid-Flood
|
Middle
|
4.2
|
10:11
|
10.89
|
8.14
|
32.71
|
26.95
|
0.89
|
2
|
<0.10
|
0.175
|
NW
|
|
WSR33
|
20200528
|
Cloudy
|
Moderate
|
Mid-Flood
|
Middle
|
4.2
|
10:11
|
10.08
|
8.14
|
32.61
|
26.94
|
0.52
|
3
|
<0.10
|
0.151
|
W
|
|
WSR33
|
20200528
|
Cloudy
|
Moderate
|
Mid-Flood
|
Surface
|
1
|
10:12
|
9.45
|
8.18
|
32.59
|
26.93
|
0.65
|
2
|
<0.10
|
0.178
|
W
|
|
WSR33
|
20200528
|
Cloudy
|
Moderate
|
Mid-Flood
|
Surface
|
1
|
10:12
|
9.35
|
8.18
|
32.44
|
26.96
|
0.88
|
2
|
<0.10
|
0.186
|
W
|
|
WSR36
|
20200528
|
Cloudy
|
Moderate
|
Mid-Flood
|
Bottom
|
3.4
|
9:56
|
10.03
|
8.11
|
32.51
|
26.91
|
1.46
|
4
|
<0.10
|
0.193
|
W
|
|
WSR36
|
20200528
|
Cloudy
|
Moderate
|
Mid-Flood
|
Bottom
|
3.4
|
9:56
|
9.79
|
8.11
|
32.51
|
26.91
|
1.21
|
4
|
<0.10
|
0.159
|
NW
|
|
WSR36
|
20200528
|
Cloudy
|
Moderate
|
Mid-Flood
|
Surface
|
1
|
9:57
|
9.53
|
8.13
|
32.52
|
26.97
|
0.46
|
2
|
<0.10
|
0.158
|
W
|
|
WSR36
|
20200528
|
Cloudy
|
Moderate
|
Mid-Flood
|
Surface
|
1
|
9:57
|
9.16
|
8.13
|
32.53
|
26.97
|
0.52
|
3
|
<0.10
|
0.139
|
SW
|
|
WSR37
|
20200528
|
Cloudy
|
Moderate
|
Mid-Flood
|
Bottom
|
5.8
|
9:40
|
9.99
|
8.12
|
32.39
|
26.95
|
0.63
|
<2
|
<0.10
|
0.186
|
W
|
|
WSR37
|
20200528
|
Cloudy
|
Moderate
|
Mid-Flood
|
Bottom
|
5.8
|
9:40
|
9.93
|
8.13
|
32.39
|
26.94
|
0.45
|
<2
|
<0.10
|
0.181
|
NW
|
|
WSR37
|
20200528
|
Cloudy
|
Moderate
|
Mid-Flood
|
Middle
|
3.4
|
9:41
|
9.71
|
8.17
|
32.47
|
26.95
|
0.21
|
<2
|
<0.10
|
0.192
|
SW
|
|
WSR37
|
20200528
|
Cloudy
|
Moderate
|
Mid-Flood
|
Middle
|
3.4
|
9:41
|
9.32
|
8.17
|
32.47
|
26.95
|
0.2
|
<2
|
<0.10
|
0.14
|
W
|
|
WSR37
|
20200528
|
Cloudy
|
Moderate
|
Mid-Flood
|
Surface
|
1
|
9:42
|
8.65
|
8.13
|
32.26
|
26.98
|
0.56
|
2
|
<0.10
|
0.176
|
SW
|
|
WSR37
|
20200528
|
Cloudy
|
Moderate
|
Mid-Flood
|
Surface
|
1
|
9:42
|
8.68
|
8.13
|
32.27
|
26.99
|
0.36
|
2
|
<0.10
|
0.147
|
W
|
|
CE
|
20200528
|
Cloudy
|
Moderate
|
Mid-Ebb
|
Bottom
|
11.4
|
14:10
|
9.63
|
8.31
|
31.89
|
26.8
|
1.39
|
2
|
<0.10
|
0.443
|
E
|
|
CE
|
20200528
|
Cloudy
|
Moderate
|
Mid-Ebb
|
Bottom
|
11.4
|
14:10
|
8.97
|
8.15
|
31.74
|
26.84
|
1.42
|
3
|
<0.10
|
0.311
|
SE
|
|
CE
|
20200528
|
Cloudy
|
Moderate
|
Mid-Ebb
|
Middle
|
6.2
|
14:11
|
8.58
|
8.14
|
31.94
|
26.75
|
1.38
|
2
|
<0.10
|
0.369
|
SE
|
|
CE
|
20200528
|
Cloudy
|
Moderate
|
Mid-Ebb
|
Middle
|
6.2
|
14:11
|
9.08
|
8.2
|
31.9
|
26.95
|
1.1
|
2
|
<0.10
|
0.322
|
SE
|
|
CE
|
20200528
|
Cloudy
|
Moderate
|
Mid-Ebb
|
Surface
|
1
|
14:12
|
9.13
|
8.17
|
32.49
|
26.76
|
0.87
|
<2
|
<0.10
|
0.37
|
E
|
|
CE
|
20200528
|
Cloudy
|
Moderate
|
Mid-Ebb
|
Surface
|
1
|
14:12
|
8.92
|
8.11
|
32.22
|
26.9
|
1.33
|
<2
|
<0.10
|
0.275
|
SE
|
|
CF
|
20200528
|
Cloudy
|
Moderate
|
Mid-Ebb
|
Bottom
|
11.7
|
14:13
|
9.26
|
8.21
|
32.61
|
26.55
|
1.46
|
2
|
<0.10
|
0.199
|
E
|
|
CF
|
20200528
|
Cloudy
|
Moderate
|
Mid-Ebb
|
Bottom
|
11.7
|
14:13
|
8.89
|
8.09
|
31.79
|
26.97
|
1.38
|
2
|
<0.10
|
0.208
|
E
|
|
CF
|
20200528
|
Cloudy
|
Moderate
|
Mid-Ebb
|
Middle
|
6.35
|
14:14
|
9.17
|
8.25
|
32.15
|
26.95
|
1.02
|
<2
|
<0.10
|
0.17
|
SE
|
|
CF
|
20200528
|
Cloudy
|
Moderate
|
Mid-Ebb
|
Middle
|
6.35
|
14:14
|
9.4
|
8.29
|
31.82
|
26.66
|
1.2
|
<2
|
<0.10
|
0.207
|
E
|
|
CF
|
20200528
|
Cloudy
|
Moderate
|
Mid-Ebb
|
Surface
|
1
|
14:15
|
9.64
|
8.11
|
32.56
|
26.86
|
0.81
|
2
|
<0.10
|
0.154
|
SE
|
|
CF
|
20200528
|
Cloudy
|
Moderate
|
Mid-Ebb
|
Surface
|
1
|
14:15
|
9.05
|
8.12
|
32.65
|
26.47
|
1.1
|
3
|
<0.10
|
0.158
|
E
|
|
NF1
|
20200528
|
Cloudy
|
Moderate
|
Mid-Ebb
|
Bottom
|
10.1
|
14:51
|
8.82
|
8.05
|
32.48
|
26.51
|
1.32
|
4
|
<0.10
|
0.189
|
SE
|
|
NF1
|
20200528
|
Cloudy
|
Moderate
|
Mid-Ebb
|
Bottom
|
10.1
|
14:51
|
9.26
|
8.22
|
31.88
|
26.8
|
1.6
|
3
|
<0.10
|
0.165
|
SE
|
|
NF1
|
20200528
|
Cloudy
|
Moderate
|
Mid-Ebb
|
Middle
|
5.55
|
14:52
|
9.38
|
8.14
|
32.16
|
26.72
|
1.38
|
2
|
<0.10
|
0.169
|
SE
|
|
NF1
|
20200528
|
Cloudy
|
Moderate
|
Mid-Ebb
|
Middle
|
5.55
|
14:52
|
9.03
|
8.19
|
31.97
|
26.82
|
0.88
|
3
|
<0.10
|
0.169
|
E
|
|
NF1
|
20200528
|
Cloudy
|
Moderate
|
Mid-Ebb
|
Surface
|
1
|
14:53
|
9.38
|
8.16
|
31.8
|
26.72
|
0.85
|
<2
|
<0.10
|
0.205
|
E
|
|
NF1
|
20200528
|
Cloudy
|
Moderate
|
Mid-Ebb
|
Surface
|
1
|
14:53
|
8.96
|
8.23
|
32.5
|
26.63
|
0.8
|
<2
|
<0.10
|
0.194
|
E
|
|
NF2
|
20200528
|
Cloudy
|
Moderate
|
Mid-Ebb
|
Bottom
|
7.6
|
16:25
|
9.16
|
8.18
|
31.72
|
27.08
|
1.26
|
<2
|
<0.10
|
0.158
|
SE
|
|
NF2
|
20200528
|
Cloudy
|
Moderate
|
Mid-Ebb
|
Bottom
|
7.6
|
16:25
|
9.45
|
8.24
|
32.14
|
26.56
|
1.19
|
<2
|
<0.10
|
0.169
|
SE
|
|
NF2
|
20200528
|
Cloudy
|
Moderate
|
Mid-Ebb
|
Middle
|
4.3
|
16:26
|
9.29
|
8.11
|
32.08
|
26.89
|
1.17
|
<2
|
<0.10
|
0.176
|
SE
|
|
NF2
|
20200528
|
Cloudy
|
Moderate
|
Mid-Ebb
|
Middle
|
4.3
|
16:26
|
9.4
|
8.18
|
31.8
|
26.83
|
1.32
|
<2
|
<0.10
|
0.149
|
E
|
|
NF2
|
20200528
|
Cloudy
|
Moderate
|
Mid-Ebb
|
Surface
|
1
|
16:27
|
9.11
|
8.14
|
32.36
|
26.4
|
0.83
|
<2
|
<0.10
|
0.147
|
SE
|
|
NF2
|
20200528
|
Cloudy
|
Moderate
|
Mid-Ebb
|
Surface
|
1
|
16:27
|
9.75
|
8.15
|
32.19
|
26.52
|
1.12
|
<2
|
<0.10
|
0.188
|
E
|
|
NF3
|
20200528
|
Cloudy
|
Moderate
|
Mid-Ebb
|
Bottom
|
9.4
|
16:33
|
9.21
|
8.05
|
32.64
|
26.73
|
1.34
|
3
|
<0.10
|
0.217
|
E
|
|
NF3
|
20200528
|
Cloudy
|
Moderate
|
Mid-Ebb
|
Bottom
|
9.4
|
16:33
|
9.08
|
8.11
|
31.93
|
26.62
|
1.36
|
2
|
<0.10
|
0.205
|
E
|
|
NF3
|
20200528
|
Cloudy
|
Moderate
|
Mid-Ebb
|
Middle
|
5.2
|
16:34
|
8.99
|
8.29
|
32.11
|
27.07
|
1.3
|
3
|
<0.10
|
0.156
|
SE
|
|
NF3
|
20200528
|
Cloudy
|
Moderate
|
Mid-Ebb
|
Middle
|
5.2
|
16:34
|
8.94
|
8.27
|
32.59
|
26.95
|
1.44
|
3
|
<0.10
|
0.147
|
SE
|
|
NF3
|
20200528
|
Cloudy
|
Moderate
|
Mid-Ebb
|
Surface
|
1
|
16:35
|
9.57
|
8.18
|
31.96
|
26.67
|
1.24
|
4
|
<0.10
|
0.167
|
E
|
|
NF3
|
20200528
|
Cloudy
|
Moderate
|
Mid-Ebb
|
Surface
|
1
|
16:35
|
9.63
|
8.08
|
32.43
|
26.81
|
0.89
|
3
|
<0.10
|
0.205
|
SE
|
|
WSR01
|
20200528
|
Cloudy
|
Moderate
|
Mid-Ebb
|
Bottom
|
7.4
|
17:07
|
9.7
|
8.16
|
31.85
|
26.79
|
1.4
|
<2
|
<0.10
|
0.195
|
SE
|
|
WSR01
|
20200528
|
Cloudy
|
Moderate
|
Mid-Ebb
|
Bottom
|
7.4
|
17:07
|
9.67
|
8.05
|
32.07
|
26.73
|
1.2
|
<2
|
<0.10
|
0.166
|
E
|
|
WSR01
|
20200528
|
Cloudy
|
Moderate
|
Mid-Ebb
|
Middle
|
4.2
|
17:08
|
8.9
|
8.3
|
32.11
|
26.96
|
1.28
|
<2
|
<0.10
|
0.178
|
E
|
|
WSR01
|
20200528
|
Cloudy
|
Moderate
|
Mid-Ebb
|
Middle
|
4.2
|
17:08
|
9.2
|
8.07
|
31.77
|
26.87
|
1.25
|
<2
|
<0.10
|
0.133
|
E
|
|
WSR01
|
20200528
|
Cloudy
|
Moderate
|
Mid-Ebb
|
Surface
|
1
|
17:09
|
9.41
|
8.19
|
32.48
|
26.49
|
1.28
|
<2
|
<0.10
|
0.21
|
E
|
|
WSR01
|
20200528
|
Cloudy
|
Moderate
|
Mid-Ebb
|
Surface
|
1
|
17:09
|
8.71
|
8.23
|
32.11
|
26.61
|
1
|
<2
|
<0.10
|
0.198
|
SE
|
|
WSR02
|
20200528
|
Cloudy
|
Moderate
|
Mid-Ebb
|
Bottom
|
7.5
|
16:43
|
9.41
|
8.11
|
31.82
|
26.44
|
1.6
|
3
|
<0.10
|
0.163
|
E
|
|
WSR02
|
20200528
|
Cloudy
|
Moderate
|
Mid-Ebb
|
Bottom
|
7.5
|
16:43
|
8.96
|
8.09
|
31.79
|
26.89
|
1.2
|
4
|
<0.10
|
0.166
|
SE
|
|
WSR02
|
20200528
|
Cloudy
|
Moderate
|
Mid-Ebb
|
Middle
|
4.25
|
16:44
|
9.08
|
8.14
|
32.21
|
26.94
|
1.31
|
4
|
<0.10
|
0.133
|
SE
|
|
WSR02
|
20200528
|
Cloudy
|
Moderate
|
Mid-Ebb
|
Middle
|
4.25
|
16:44
|
9.09
|
8.05
|
32.63
|
26.86
|
1.07
|
3
|
<0.10
|
0.159
|
E
|
|
WSR02
|
20200528
|
Cloudy
|
Moderate
|
Mid-Ebb
|
Surface
|
1
|
16:45
|
9.71
|
8.29
|
32.03
|
26.71
|
0.8
|
5
|
<0.10
|
0.15
|
E
|
|
WSR02
|
20200528
|
Cloudy
|
Moderate
|
Mid-Ebb
|
Surface
|
1
|
16:45
|
8.81
|
8.11
|
32.27
|
26.66
|
0.93
|
4
|
<0.10
|
0.187
|
SE
|
|
WSR03
|
20200528
|
Cloudy
|
Moderate
|
Mid-Ebb
|
Bottom
|
6.1
|
16:08
|
8.95
|
8.25
|
32.42
|
26.41
|
1.51
|
2
|
<0.10
|
0.179
|
SE
|
|
WSR03
|
20200528
|
Cloudy
|
Moderate
|
Mid-Ebb
|
Bottom
|
6.1
|
16:08
|
9
|
8.28
|
32.57
|
26.91
|
1.59
|
2
|
<0.10
|
0.134
|
SE
|
|
WSR03
|
20200528
|
Cloudy
|
Moderate
|
Mid-Ebb
|
Middle
|
3.55
|
16:09
|
8.73
|
8.06
|
31.69
|
26.47
|
1.4
|
3
|
<0.10
|
0.146
|
E
|
|
WSR03
|
20200528
|
Cloudy
|
Moderate
|
Mid-Ebb
|
Middle
|
3.55
|
16:09
|
9.62
|
8.07
|
31.88
|
26.8
|
1.15
|
3
|
<0.10
|
0.199
|
SE
|
|
WSR03
|
20200528
|
Cloudy
|
Moderate
|
Mid-Ebb
|
Surface
|
1
|
16:10
|
9.54
|
8.08
|
32.68
|
26.73
|
1.08
|
2
|
<0.10
|
0.16
|
E
|
|
WSR03
|
20200528
|
Cloudy
|
Moderate
|
Mid-Ebb
|
Surface
|
1
|
16:10
|
9.04
|
8.19
|
31.9
|
26.65
|
1.29
|
3
|
<0.10
|
0.2
|
E
|
|
WSR04
|
20200528
|
Cloudy
|
Moderate
|
Mid-Ebb
|
Bottom
|
5.8
|
15:50
|
9.78
|
8.19
|
31.72
|
26.99
|
1.46
|
3
|
<0.10
|
0.181
|
E
|
|
WSR04
|
20200528
|
Cloudy
|
Moderate
|
Mid-Ebb
|
Bottom
|
5.8
|
15:50
|
9.09
|
8.31
|
32.66
|
26.54
|
1.66
|
2
|
<0.10
|
0.163
|
SE
|
|
WSR04
|
20200528
|
Cloudy
|
Moderate
|
Mid-Ebb
|
Middle
|
3.4
|
15:51
|
9.63
|
8.3
|
31.78
|
26.88
|
1.17
|
<2
|
<0.10
|
0.194
|
E
|
|
WSR04
|
20200528
|
Cloudy
|
Moderate
|
Mid-Ebb
|
Middle
|
3.4
|
15:51
|
8.84
|
8.1
|
32.43
|
26.63
|
1.25
|
<2
|
<0.10
|
0.219
|
SE
|
|
WSR04
|
20200528
|
Cloudy
|
Moderate
|
Mid-Ebb
|
Surface
|
1
|
15:52
|
9.7
|
8.07
|
32.18
|
26.59
|
1.07
|
<2
|
<0.10
|
0.182
|
E
|
|
WSR04
|
20200528
|
Cloudy
|
Moderate
|
Mid-Ebb
|
Surface
|
1
|
15:52
|
8.74
|
8.29
|
31.83
|
26.48
|
0.78
|
<2
|
<0.10
|
0.16
|
SE
|
|
WSR16
|
20200528
|
Cloudy
|
Moderate
|
Mid-Ebb
|
Bottom
|
10.5
|
14:32
|
8.79
|
8.1
|
32.64
|
26.97
|
1.18
|
<2
|
<0.10
|
0.155
|
E
|
|
WSR16
|
20200528
|
Cloudy
|
Moderate
|
Mid-Ebb
|
Bottom
|
10.5
|
14:32
|
9.71
|
8.08
|
32.35
|
26.82
|
1.35
|
<2
|
<0.10
|
0.209
|
E
|
|
WSR16
|
20200528
|
Cloudy
|
Moderate
|
Mid-Ebb
|
Middle
|
5.75
|
14:33
|
9.13
|
8.25
|
31.91
|
26.49
|
0.97
|
2
|
<0.10
|
0.226
|
SE
|
|
WSR16
|
20200528
|
Cloudy
|
Moderate
|
Mid-Ebb
|
Middle
|
5.75
|
14:33
|
8.92
|
8.17
|
31.74
|
26.94
|
0.96
|
3
|
<0.10
|
0.215
|
SE
|
|
WSR16
|
20200528
|
Cloudy
|
Moderate
|
Mid-Ebb
|
Surface
|
1
|
14:34
|
8.6
|
8.07
|
31.81
|
26.54
|
1.28
|
2
|
<0.10
|
0.208
|
E
|
|
WSR16
|
20200528
|
Cloudy
|
Moderate
|
Mid-Ebb
|
Surface
|
1
|
14:34
|
9.65
|
8.21
|
32
|
26.51
|
1.12
|
3
|
<0.10
|
0.228
|
SE
|
|
WSR33
|
20200528
|
Cloudy
|
Moderate
|
Mid-Ebb
|
Bottom
|
5.9
|
15:33
|
8.68
|
8.26
|
31.72
|
26.72
|
1.55
|
<2
|
<0.10
|
0.193
|
SE
|
|
WSR33
|
20200528
|
Cloudy
|
Moderate
|
Mid-Ebb
|
Bottom
|
5.9
|
15:33
|
9.59
|
8.07
|
32.35
|
26.58
|
1.35
|
<2
|
<0.10
|
0.148
|
SE
|
|
WSR33
|
20200528
|
Cloudy
|
Moderate
|
Mid-Ebb
|
Middle
|
3.45
|
15:34
|
9.45
|
8.27
|
31.75
|
26.58
|
1.08
|
2
|
<0.10
|
0.148
|
SE
|
|
WSR33
|
20200528
|
Cloudy
|
Moderate
|
Mid-Ebb
|
Middle
|
3.45
|
15:34
|
9.5
|
8.27
|
32.16
|
26.61
|
1.41
|
2
|
<0.10
|
0.163
|
SE
|
|
WSR33
|
20200528
|
Cloudy
|
Moderate
|
Mid-Ebb
|
Surface
|
1
|
15:35
|
9.27
|
8.31
|
32.02
|
26.91
|
1.1
|
2
|
<0.10
|
0.154
|
E
|
|
WSR33
|
20200528
|
Cloudy
|
Moderate
|
Mid-Ebb
|
Surface
|
1
|
15:35
|
9.02
|
8.12
|
32.33
|
26.71
|
1.22
|
2
|
<0.10
|
0.162
|
E
|
|
WSR36
|
20200528
|
Cloudy
|
Moderate
|
Mid-Ebb
|
Bottom
|
4
|
15:21
|
8.7
|
8.27
|
31.76
|
26.98
|
1.54
|
3
|
<0.10
|
0.209
|
SE
|
|
WSR36
|
20200528
|
Cloudy
|
Moderate
|
Mid-Ebb
|
Bottom
|
4
|
15:21
|
9.46
|
8.12
|
32.26
|
26.87
|
1.43
|
3
|
<0.10
|
0.165
|
SE
|
|
WSR36
|
20200528
|
Cloudy
|
Moderate
|
Mid-Ebb
|
Surface
|
1
|
15:22
|
9.12
|
8.22
|
31.97
|
26.62
|
1.14
|
<2
|
<0.10
|
0.203
|
SE
|
|
WSR36
|
20200528
|
Cloudy
|
Moderate
|
Mid-Ebb
|
Surface
|
1
|
15:22
|
8.92
|
8.27
|
31.84
|
27.04
|
1.29
|
<2
|
<0.10
|
0.183
|
SE
|
|
WSR37
|
20200528
|
Cloudy
|
Moderate
|
Mid-Ebb
|
Bottom
|
6.5
|
15:05
|
9.61
|
8.14
|
32.64
|
26.82
|
1.34
|
<2
|
<0.10
|
0.169
|
E
|
|
WSR37
|
20200528
|
Cloudy
|
Moderate
|
Mid-Ebb
|
Bottom
|
6.5
|
15:05
|
8.97
|
8.18
|
32.48
|
26.72
|
1.54
|
<2
|
<0.10
|
0.143
|
SE
|
|
WSR37
|
20200528
|
Cloudy
|
Moderate
|
Mid-Ebb
|
Middle
|
3.75
|
15:06
|
8.84
|
8.23
|
32.54
|
26.57
|
1.2
|
<2
|
<0.10
|
0.187
|
SE
|
|
WSR37
|
20200528
|
Cloudy
|
Moderate
|
Mid-Ebb
|
Middle
|
3.75
|
15:06
|
9.61
|
8.16
|
31.81
|
27.01
|
1.15
|
<2
|
<0.10
|
0.189
|
SE
|
|
WSR37
|
20200528
|
Cloudy
|
Moderate
|
Mid-Ebb
|
Surface
|
1
|
15:07
|
8.82
|
8.28
|
31.76
|
26.62
|
1.31
|
<2
|
<0.10
|
0.155
|
SE
|
|
WSR37
|
20200528
|
Cloudy
|
Moderate
|
Mid-Ebb
|
Surface
|
1
|
15:07
|
8.67
|
8.28
|
32.42
|
26.5
|
0.95
|
<2
|
<0.10
|
0.158
|
SE
|
|
CE
|
20200530
|
Rainy
|
Moderate
|
Mid-Flood
|
Bottom
|
11.9
|
9:15
|
9.2
|
8.3
|
32.04
|
27.49
|
1.27
|
3
|
<0.10
|
0.196
|
NW
|
|
CE
|
20200530
|
Rainy
|
Moderate
|
Mid-Flood
|
Bottom
|
11.9
|
9:15
|
8.65
|
8.29
|
32.09
|
27.67
|
1.54
|
3
|
<0.10
|
0.177
|
NW
|
|
CE
|
20200530
|
Rainy
|
Moderate
|
Mid-Flood
|
Middle
|
6.45
|
9:16
|
9.93
|
8.13
|
31.44
|
27.38
|
1.41
|
4
|
<0.10
|
0.161
|
NW
|
|
CE
|
20200530
|
Rainy
|
Moderate
|
Mid-Flood
|
Middle
|
6.45
|
9:16
|
9.66
|
8.18
|
32.21
|
27.73
|
0.76
|
4
|
<0.10
|
0.183
|
NW
|
|
CE
|
20200530
|
Rainy
|
Moderate
|
Mid-Flood
|
Surface
|
1
|
9:17
|
9.16
|
8.04
|
31.34
|
27.35
|
1.6
|
4
|
<0.10
|
0.209
|
NW
|
|
CE
|
20200530
|
Rainy
|
Moderate
|
Mid-Flood
|
Surface
|
1
|
9:17
|
9.8
|
8.08
|
31.1
|
27.56
|
1.68
|
4
|
<0.10
|
0.208
|
N
|
|
CF
|
20200530
|
Rainy
|
Moderate
|
Mid-Flood
|
Bottom
|
11.6
|
9:11
|
8.9
|
8.08
|
31.75
|
27.35
|
1.96
|
4
|
<0.10
|
0.19
|
W
|
|
CF
|
20200530
|
Rainy
|
Moderate
|
Mid-Flood
|
Bottom
|
11.6
|
9:11
|
9.74
|
8.18
|
31.24
|
27.49
|
1.38
|
4
|
<0.10
|
0.186
|
SW
|
|
CF
|
20200530
|
Rainy
|
Moderate
|
Mid-Flood
|
Middle
|
6.3
|
9:12
|
9.39
|
8.17
|
31.73
|
27.6
|
0.93
|
3
|
<0.10
|
0.244
|
SW
|
|
CF
|
20200530
|
Rainy
|
Moderate
|
Mid-Flood
|
Middle
|
6.3
|
9:12
|
8.52
|
8.11
|
31.51
|
27.51
|
1.34
|
3
|
<0.10
|
0.179
|
W
|
|
CF
|
20200530
|
Rainy
|
Moderate
|
Mid-Flood
|
Surface
|
1
|
9:13
|
9.75
|
8.18
|
31.51
|
27.39
|
1.45
|
3
|
<0.10
|
0.21
|
SW
|
|
CF
|
20200530
|
Rainy
|
Moderate
|
Mid-Flood
|
Surface
|
1
|
9:13
|
9.75
|
8.15
|
32.04
|
27.67
|
1.82
|
3
|
<0.10
|
0.243
|
SW
|
|
NF1
|
20200530
|
Rainy
|
Moderate
|
Mid-Flood
|
Bottom
|
10.9
|
9:56
|
9.66
|
8.07
|
31.81
|
27.42
|
1.47
|
6
|
<0.10
|
0.15
|
W
|
|
NF1
|
20200530
|
Rainy
|
Moderate
|
Mid-Flood
|
Bottom
|
10.9
|
9:56
|
9.32
|
8.23
|
31.93
|
27.63
|
1.88
|
6
|
<0.10
|
0.157
|
W
|
|
NF1
|
20200530
|
Rainy
|
Moderate
|
Mid-Flood
|
Middle
|
5.95
|
9:57
|
9.97
|
8.1
|
31.49
|
27.66
|
0.84
|
4
|
<0.10
|
0.156
|
SW
|
|
NF1
|
20200530
|
Rainy
|
Moderate
|
Mid-Flood
|
Middle
|
5.95
|
9:57
|
8.59
|
8.04
|
31.72
|
27.47
|
1.37
|
4
|
<0.10
|
0.132
|
W
|
|
NF1
|
20200530
|
Rainy
|
Moderate
|
Mid-Flood
|
Surface
|
1
|
9:58
|
9.56
|
8.37
|
31.14
|
27.31
|
2.02
|
4
|
<0.10
|
0.13
|
SW
|
|
NF1
|
20200530
|
Rainy
|
Moderate
|
Mid-Flood
|
Surface
|
1
|
9:58
|
9.45
|
8.17
|
31.95
|
27.56
|
1.57
|
4
|
<0.10
|
0.184
|
W
|
|
NF2
|
20200530
|
Rainy
|
Moderate
|
Mid-Flood
|
Bottom
|
8.8
|
11:33
|
9.92
|
8.14
|
31.18
|
27.58
|
1.11
|
2
|
<0.10
|
0.156
|
NW
|
|
NF2
|
20200530
|
Rainy
|
Moderate
|
Mid-Flood
|
Bottom
|
8.8
|
11:33
|
9.97
|
8.06
|
32.12
|
27.71
|
1.18
|
2
|
<0.10
|
0.19
|
W
|
|
NF2
|
20200530
|
Rainy
|
Moderate
|
Mid-Flood
|
Middle
|
4.9
|
11:34
|
8.98
|
8.13
|
32.1
|
27.35
|
1.67
|
2
|
<0.10
|
0.193
|
SW
|
|
NF2
|
20200530
|
Rainy
|
Moderate
|
Mid-Flood
|
Middle
|
4.9
|
11:34
|
9.52
|
8.01
|
31.28
|
27.52
|
0.77
|
3
|
<0.10
|
0.135
|
W
|
|
NF2
|
20200530
|
Rainy
|
Moderate
|
Mid-Flood
|
Surface
|
1
|
11:35
|
8.71
|
8.22
|
31.67
|
27.63
|
1.16
|
4
|
<0.10
|
0.177
|
SW
|
|
NF2
|
20200530
|
Rainy
|
Moderate
|
Mid-Flood
|
Surface
|
1
|
11:35
|
8.85
|
8.35
|
31.59
|
27.44
|
1.8
|
4
|
<0.10
|
0.184
|
W
|
|
NF3
|
20200530
|
Rainy
|
Moderate
|
Mid-Flood
|
Bottom
|
9.9
|
11:41
|
8.62
|
8.18
|
31.26
|
27.7
|
1.83
|
4
|
<0.10
|
0.128
|
SW
|
|
NF3
|
20200530
|
Rainy
|
Moderate
|
Mid-Flood
|
Bottom
|
9.9
|
11:41
|
9.03
|
8.19
|
31.21
|
27.41
|
1.65
|
3
|
<0.10
|
0.169
|
W
|
|
NF3
|
20200530
|
Rainy
|
Moderate
|
Mid-Flood
|
Middle
|
5.45
|
11:42
|
8.98
|
8.21
|
31.15
|
27.7
|
1.4
|
2
|
<0.10
|
0.164
|
W
|
|
NF3
|
20200530
|
Rainy
|
Moderate
|
Mid-Flood
|
Middle
|
5.45
|
11:42
|
8.71
|
8.33
|
31.44
|
27.61
|
0.96
|
2
|
<0.10
|
0.138
|
NW
|
|
NF3
|
20200530
|
Rainy
|
Moderate
|
Mid-Flood
|
Surface
|
1
|
11:43
|
8.87
|
8.2
|
31.94
|
27.73
|
1.25
|
2
|
<0.10
|
0.149
|
SW
|
|
NF3
|
20200530
|
Rainy
|
Moderate
|
Mid-Flood
|
Surface
|
1
|
11:43
|
8.86
|
8.01
|
31.23
|
27.43
|
1.44
|
2
|
<0.10
|
0.186
|
W
|
|
WSR01
|
20200530
|
Rainy
|
Moderate
|
Mid-Flood
|
Bottom
|
8.5
|
11:41
|
9.85
|
8.13
|
31.4
|
27.56
|
1.47
|
4
|
<0.10
|
0.156
|
W
|
|
WSR01
|
20200530
|
Rainy
|
Moderate
|
Mid-Flood
|
Bottom
|
8.5
|
11:41
|
9.54
|
8.1
|
31.86
|
27.63
|
1.83
|
4
|
<0.10
|
0.163
|
SW
|
|
WSR01
|
20200530
|
Rainy
|
Moderate
|
Mid-Flood
|
Middle
|
4.75
|
11:42
|
9.98
|
8.2
|
31.72
|
27.53
|
1.67
|
3
|
<0.10
|
0.154
|
NW
|
|
WSR01
|
20200530
|
Rainy
|
Moderate
|
Mid-Flood
|
Middle
|
4.75
|
11:42
|
9.99
|
8.04
|
31.19
|
27.73
|
0.85
|
3
|
<0.10
|
0.157
|
NW
|
|
WSR01
|
20200530
|
Rainy
|
Moderate
|
Mid-Flood
|
Surface
|
1
|
11:43
|
8.92
|
8.25
|
31.85
|
27.67
|
1.42
|
3
|
<0.10
|
0.171
|
W
|
|
WSR01
|
20200530
|
Rainy
|
Moderate
|
Mid-Flood
|
Surface
|
1
|
11:43
|
9.47
|
8.25
|
31.37
|
27.41
|
1.58
|
3
|
<0.10
|
0.137
|
W
|
|
WSR02
|
20200530
|
Rainy
|
Moderate
|
Mid-Flood
|
Bottom
|
8.8
|
12:06
|
9.07
|
8.23
|
31.25
|
27.58
|
1.82
|
2
|
<0.10
|
0.184
|
SW
|
|
WSR02
|
20200530
|
Rainy
|
Moderate
|
Mid-Flood
|
Bottom
|
8.8
|
12:06
|
8.87
|
8.05
|
31.93
|
27.47
|
1.35
|
2
|
<0.10
|
0.153
|
W
|
|
WSR02
|
20200530
|
Rainy
|
Moderate
|
Mid-Flood
|
Middle
|
4.9
|
12:07
|
9.02
|
8.18
|
31.42
|
27.68
|
1.52
|
2
|
<0.10
|
0.147
|
SW
|
|
WSR02
|
20200530
|
Rainy
|
Moderate
|
Mid-Flood
|
Middle
|
4.9
|
12:07
|
9.65
|
8.35
|
31.71
|
27.67
|
1.42
|
2
|
<0.10
|
0.17
|
W
|
|
WSR02
|
20200530
|
Rainy
|
Moderate
|
Mid-Flood
|
Surface
|
1
|
12:08
|
9.74
|
8.1
|
31.88
|
27.63
|
1.34
|
3
|
<0.10
|
0.148
|
W
|
|
WSR02
|
20200530
|
Rainy
|
Moderate
|
Mid-Flood
|
Surface
|
1
|
12:08
|
8.93
|
8.19
|
31.45
|
27.58
|
1.6
|
3
|
<0.10
|
0.174
|
W
|
|
WSR03
|
20200530
|
Rainy
|
Moderate
|
Mid-Flood
|
Bottom
|
7.1
|
11:15
|
9.21
|
8.17
|
31.27
|
27.31
|
1.18
|
3
|
<0.10
|
0.162
|
NW
|
|
WSR03
|
20200530
|
Rainy
|
Moderate
|
Mid-Flood
|
Bottom
|
7.1
|
11:15
|
9.64
|
8.19
|
31.5
|
27.3
|
1.93
|
3
|
<0.10
|
0.186
|
W
|
|
WSR03
|
20200530
|
Rainy
|
Moderate
|
Mid-Flood
|
Middle
|
4.05
|
11:16
|
8.66
|
8.2
|
31.24
|
27.35
|
1.22
|
4
|
<0.10
|
0.179
|
W
|
|
WSR03
|
20200530
|
Rainy
|
Moderate
|
Mid-Flood
|
Middle
|
4.05
|
11:16
|
9.86
|
8.17
|
31.9
|
27.7
|
1.02
|
4
|
<0.10
|
0.145
|
W
|
|
WSR03
|
20200530
|
Rainy
|
Moderate
|
Mid-Flood
|
Surface
|
1
|
11:17
|
8.45
|
8.29
|
31.85
|
27.41
|
1.9
|
5
|
<0.10
|
0.18
|
SW
|
|
WSR03
|
20200530
|
Rainy
|
Moderate
|
Mid-Flood
|
Surface
|
1
|
11:17
|
9.15
|
8.3
|
31.2
|
27.45
|
1.14
|
5
|
<0.10
|
0.13
|
W
|
|
WSR04
|
20200530
|
Rainy
|
Moderate
|
Mid-Flood
|
Bottom
|
5.7
|
10:57
|
9.63
|
8.21
|
31.47
|
27.68
|
1.7
|
2
|
<0.10
|
0.135
|
W
|
|
WSR04
|
20200530
|
Rainy
|
Moderate
|
Mid-Flood
|
Bottom
|
5.7
|
10:57
|
9.32
|
8.21
|
32.07
|
27.53
|
1.36
|
2
|
<0.10
|
0.186
|
W
|
|
WSR04
|
20200530
|
Rainy
|
Moderate
|
Mid-Flood
|
Middle
|
3.35
|
10:58
|
9.44
|
8.32
|
31.77
|
27.46
|
1.36
|
4
|
<0.10
|
0.185
|
W
|
|
WSR04
|
20200530
|
Rainy
|
Moderate
|
Mid-Flood
|
Middle
|
3.35
|
10:58
|
8.85
|
8.12
|
31.94
|
27.67
|
1.2
|
4
|
<0.10
|
0.18
|
W
|
|
WSR04
|
20200530
|
Rainy
|
Moderate
|
Mid-Flood
|
Surface
|
1
|
10:59
|
9.69
|
8.25
|
31.44
|
27.45
|
1.75
|
6
|
<0.10
|
0.146
|
W
|
|
WSR04
|
20200530
|
Rainy
|
Moderate
|
Mid-Flood
|
Surface
|
1
|
10:59
|
9.13
|
8.24
|
31.29
|
27.37
|
1.15
|
6
|
<0.10
|
0.142
|
W
|
|
WSR16
|
20200530
|
Rainy
|
Moderate
|
Mid-Flood
|
Bottom
|
11.7
|
9:34
|
9.34
|
8.19
|
32.26
|
27.4
|
1.55
|
3
|
<0.10
|
0.206
|
NW
|
|
WSR16
|
20200530
|
Rainy
|
Moderate
|
Mid-Flood
|
Bottom
|
11.7
|
9:34
|
9.99
|
8.2
|
31.23
|
27.71
|
1.39
|
3
|
<0.10
|
0.214
|
NW
|
|
WSR16
|
20200530
|
Rainy
|
Moderate
|
Mid-Flood
|
Middle
|
6.35
|
9:35
|
8.94
|
8.37
|
31.38
|
27.71
|
0.83
|
5
|
<0.10
|
0.216
|
N
|
|
WSR16
|
20200530
|
Rainy
|
Moderate
|
Mid-Flood
|
Middle
|
6.35
|
9:35
|
9.57
|
8.14
|
32.01
|
27.57
|
1.68
|
5
|
<0.10
|
0.213
|
NW
|
|
WSR16
|
20200530
|
Rainy
|
Moderate
|
Mid-Flood
|
Surface
|
1
|
9:36
|
9.32
|
8.16
|
31.25
|
27.43
|
2.03
|
6
|
<0.10
|
0.167
|
N
|
|
WSR16
|
20200530
|
Rainy
|
Moderate
|
Mid-Flood
|
Surface
|
1
|
9:36
|
9.07
|
8.06
|
32.02
|
27.63
|
1.59
|
6
|
<0.10
|
0.166
|
NW
|
|
WSR33
|
20200530
|
Rainy
|
Moderate
|
Mid-Flood
|
Bottom
|
6.7
|
10:40
|
8.49
|
8.35
|
31.98
|
27.67
|
1.22
|
5
|
<0.10
|
0.154
|
W
|
|
WSR33
|
20200530
|
Rainy
|
Moderate
|
Mid-Flood
|
Bottom
|
6.7
|
10:40
|
9.69
|
8.27
|
31.93
|
27.45
|
1.21
|
5
|
<0.10
|
0.132
|
W
|
|
WSR33
|
20200530
|
Rainy
|
Moderate
|
Mid-Flood
|
Middle
|
3.85
|
10:41
|
8.62
|
8.19
|
31.4
|
27.4
|
1.03
|
4
|
<0.10
|
0.153
|
SW
|
|
WSR33
|
20200530
|
Rainy
|
Moderate
|
Mid-Flood
|
Middle
|
3.85
|
10:41
|
8.84
|
8.25
|
31.83
|
27.34
|
1.63
|
4
|
<0.10
|
0.141
|
W
|
|
WSR33
|
20200530
|
Rainy
|
Moderate
|
Mid-Flood
|
Surface
|
1
|
10:42
|
9.58
|
8.3
|
31.84
|
27.45
|
1.5
|
3
|
<0.10
|
0.157
|
SW
|
|
WSR33
|
20200530
|
Rainy
|
Moderate
|
Mid-Flood
|
Surface
|
1
|
10:42
|
9.35
|
8.31
|
31.69
|
27.39
|
1.95
|
3
|
<0.10
|
0.192
|
W
|
|
WSR36
|
20200530
|
Rainy
|
Moderate
|
Mid-Flood
|
Bottom
|
4.1
|
10:26
|
9.05
|
8.26
|
32.21
|
27.55
|
1.32
|
3
|
<0.10
|
0.156
|
W
|
|
WSR36
|
20200530
|
Rainy
|
Moderate
|
Mid-Flood
|
Bottom
|
4.1
|
10:26
|
8.56
|
8.22
|
31.23
|
27.59
|
1.96
|
3
|
<0.10
|
0.144
|
SW
|
|
WSR36
|
20200530
|
Rainy
|
Moderate
|
Mid-Flood
|
Surface
|
1
|
10:27
|
8.92
|
8.3
|
31.71
|
27.41
|
1.8
|
4
|
<0.10
|
0.192
|
W
|
|
WSR36
|
20200530
|
Rainy
|
Moderate
|
Mid-Flood
|
Surface
|
1
|
10:27
|
9.31
|
8.22
|
32.09
|
27.45
|
1.28
|
4
|
<0.10
|
0.144
|
W
|
|
WSR37
|
20200530
|
Rainy
|
Moderate
|
Mid-Flood
|
Bottom
|
6.6
|
10:10
|
9.06
|
8.12
|
31.44
|
27.55
|
1.19
|
3
|
<0.10
|
0.188
|
SW
|
|
WSR37
|
20200530
|
Rainy
|
Moderate
|
Mid-Flood
|
Bottom
|
6.6
|
10:10
|
8.98
|
8.36
|
31.91
|
27.56
|
2.01
|
3
|
<0.10
|
0.155
|
W
|
|
WSR37
|
20200530
|
Rainy
|
Moderate
|
Mid-Flood
|
Middle
|
3.8
|
10:11
|
9.56
|
8.13
|
31.85
|
27.49
|
1.67
|
4
|
<0.10
|
0.161
|
NW
|
|
WSR37
|
20200530
|
Rainy
|
Moderate
|
Mid-Flood
|
Middle
|
3.8
|
10:11
|
9.29
|
8.34
|
31.39
|
27.3
|
1.65
|
4
|
<0.10
|
0.134
|
SW
|
|
WSR37
|
20200530
|
Rainy
|
Moderate
|
Mid-Flood
|
Surface
|
1
|
10:12
|
9.72
|
8.19
|
31.45
|
27.62
|
1.13
|
5
|
<0.10
|
0.15
|
NW
|
|
WSR37
|
20200530
|
Rainy
|
Moderate
|
Mid-Flood
|
Surface
|
1
|
10:12
|
9.73
|
8.1
|
32.15
|
27.51
|
1.15
|
5
|
<0.10
|
0.176
|
W
|
|
CE
|
20200530
|
Rainy
|
Moderate
|
Mid-Ebb
|
Bottom
|
10.8
|
14:31
|
10.42
|
8.05
|
31.1
|
27.59
|
1.58
|
4
|
<0.10
|
0.41
|
E
|
|
CE
|
20200530
|
Rainy
|
Moderate
|
Mid-Ebb
|
Bottom
|
10.8
|
14:31
|
9.59
|
8.28
|
31.27
|
27.35
|
1.4
|
4
|
<0.10
|
0.45
|
SE
|
|
CE
|
20200530
|
Rainy
|
Moderate
|
Mid-Ebb
|
Middle
|
5.9
|
14:32
|
10.02
|
8.05
|
31.33
|
27.38
|
1.36
|
3
|
<0.10
|
0.286
|
E
|
|
CE
|
20200530
|
Rainy
|
Moderate
|
Mid-Ebb
|
Middle
|
5.9
|
14:32
|
9.95
|
8.01
|
32.03
|
27.5
|
1.15
|
3
|
<0.10
|
0.325
|
SE
|
|
CE
|
20200530
|
Rainy
|
Moderate
|
Mid-Ebb
|
Surface
|
1
|
14:33
|
9.34
|
8.05
|
31.99
|
27.62
|
1.38
|
3
|
<0.10
|
0.283
|
SE
|
|
CE
|
20200530
|
Rainy
|
Moderate
|
Mid-Ebb
|
Surface
|
1
|
14:33
|
9.74
|
8.18
|
31.17
|
27.16
|
1.16
|
3
|
<0.10
|
0.351
|
SE
|
|
CF
|
20200530
|
Rainy
|
Moderate
|
Mid-Ebb
|
Bottom
|
12.2
|
14:33
|
10.39
|
8.17
|
31.31
|
27.4
|
1.17
|
<2
|
<0.10
|
0.18
|
SE
|
|
CF
|
20200530
|
Rainy
|
Moderate
|
Mid-Ebb
|
Bottom
|
12.2
|
14:33
|
9.16
|
8.07
|
31.47
|
27.25
|
1.8
|
<2
|
<0.10
|
0.136
|
SE
|
|
CF
|
20200530
|
Rainy
|
Moderate
|
Mid-Ebb
|
Middle
|
6.6
|
14:34
|
9.56
|
8.08
|
31.4
|
27.57
|
1.44
|
3
|
<0.10
|
0.137
|
SE
|
|
CF
|
20200530
|
Rainy
|
Moderate
|
Mid-Ebb
|
Middle
|
6.6
|
14:34
|
9.5
|
8.12
|
31.86
|
27.65
|
1.15
|
3
|
<0.10
|
0.219
|
SE
|
|
CF
|
20200530
|
Rainy
|
Moderate
|
Mid-Ebb
|
Surface
|
1
|
14:35
|
9.66
|
8.12
|
31.96
|
27.4
|
1.4
|
4
|
<0.10
|
0.221
|
E
|
|
CF
|
20200530
|
Rainy
|
Moderate
|
Mid-Ebb
|
Surface
|
1
|
14:35
|
9.16
|
8.12
|
31.46
|
27.15
|
1.79
|
4
|
<0.10
|
0.143
|
E
|
|
NF1
|
20200530
|
Rainy
|
Moderate
|
Mid-Ebb
|
Bottom
|
10.4
|
15:14
|
10.47
|
8.26
|
31.21
|
27.48
|
1.32
|
4
|
<0.10
|
0.193
|
SE
|
|
NF1
|
20200530
|
Rainy
|
Moderate
|
Mid-Ebb
|
Bottom
|
10.4
|
15:14
|
10.45
|
8.09
|
31.57
|
27.31
|
1.74
|
4
|
<0.10
|
0.203
|
E
|
|
NF1
|
20200530
|
Rainy
|
Moderate
|
Mid-Ebb
|
Middle
|
5.7
|
15:15
|
10.44
|
8.1
|
31.9
|
27.37
|
0.9
|
4
|
<0.10
|
0.132
|
SE
|
|
NF1
|
20200530
|
Rainy
|
Moderate
|
Mid-Ebb
|
Middle
|
5.7
|
15:15
|
10.25
|
8.03
|
32.29
|
27.68
|
1.52
|
4
|
<0.10
|
0.188
|
SE
|
|
NF1
|
20200530
|
Rainy
|
Moderate
|
Mid-Ebb
|
Surface
|
1
|
15:16
|
8.61
|
8.13
|
32.1
|
27.63
|
1.35
|
6
|
<0.10
|
0.167
|
E
|
|
NF1
|
20200530
|
Rainy
|
Moderate
|
Mid-Ebb
|
Surface
|
1
|
15:16
|
8.67
|
8.18
|
31.43
|
27.36
|
1.77
|
6
|
<0.10
|
0.189
|
E
|
|
NF2
|
20200530
|
Rainy
|
Moderate
|
Mid-Ebb
|
Bottom
|
8.3
|
16:46
|
10.39
|
8.08
|
31.55
|
27.3
|
1.15
|
4
|
<0.10
|
0.214
|
SE
|
|
NF2
|
20200530
|
Rainy
|
Moderate
|
Mid-Ebb
|
Bottom
|
8.3
|
16:46
|
8.7
|
8.05
|
31.72
|
27.56
|
1.27
|
4
|
<0.10
|
0.161
|
E
|
|
NF2
|
20200530
|
Rainy
|
Moderate
|
Mid-Ebb
|
Middle
|
4.65
|
16:47
|
9.61
|
8.11
|
31.93
|
27.54
|
0.87
|
3
|
<0.10
|
0.177
|
E
|
|
NF2
|
20200530
|
Rainy
|
Moderate
|
Mid-Ebb
|
Middle
|
4.65
|
16:47
|
8.9
|
8.27
|
31.07
|
27.41
|
1.21
|
3
|
<0.10
|
0.165
|
E
|
|
NF2
|
20200530
|
Rainy
|
Moderate
|
Mid-Ebb
|
Surface
|
1
|
16:48
|
9.3
|
8.04
|
31.15
|
27.64
|
1.13
|
3
|
<0.10
|
0.162
|
E
|
|
NF2
|
20200530
|
Rainy
|
Moderate
|
Mid-Ebb
|
Surface
|
1
|
16:48
|
9.13
|
8.15
|
32.06
|
27.41
|
1.81
|
3
|
<0.10
|
0.19
|
SE
|
|
NF3
|
20200530
|
Rainy
|
Moderate
|
Mid-Ebb
|
Bottom
|
9.5
|
16:58
|
9.97
|
8.08
|
31.11
|
27.13
|
1.6
|
4
|
<0.10
|
0.217
|
SE
|
|
NF3
|
20200530
|
Rainy
|
Moderate
|
Mid-Ebb
|
Bottom
|
9.5
|
16:58
|
9.43
|
8.06
|
31.55
|
27.31
|
1.29
|
4
|
<0.10
|
0.17
|
E
|
|
NF3
|
20200530
|
Rainy
|
Moderate
|
Mid-Ebb
|
Middle
|
5.25
|
16:59
|
8.89
|
8.2
|
31.89
|
27.15
|
1.46
|
3
|
<0.10
|
0.135
|
SE
|
|
NF3
|
20200530
|
Rainy
|
Moderate
|
Mid-Ebb
|
Middle
|
5.25
|
16:59
|
10.26
|
8.19
|
32.32
|
27.65
|
0.93
|
3
|
<0.10
|
0.147
|
SE
|
|
NF3
|
20200530
|
Rainy
|
Moderate
|
Mid-Ebb
|
Surface
|
1
|
17:00
|
8.8
|
8.02
|
31.21
|
27.18
|
1.51
|
3
|
<0.10
|
0.168
|
SE
|
|
NF3
|
20200530
|
Rainy
|
Moderate
|
Mid-Ebb
|
Surface
|
1
|
17:00
|
9.75
|
8.16
|
32.02
|
27.68
|
1.29
|
3
|
<0.10
|
0.208
|
E
|
|
WSR01
|
20200530
|
Rainy
|
Moderate
|
Mid-Ebb
|
Bottom
|
7.2
|
17:22
|
9.27
|
8.12
|
31.92
|
27.23
|
1.27
|
3
|
<0.10
|
0.22
|
E
|
|
WSR01
|
20200530
|
Rainy
|
Moderate
|
Mid-Ebb
|
Bottom
|
7.2
|
17:22
|
9.17
|
8.04
|
31.84
|
27.31
|
1.48
|
3
|
<0.10
|
0.17
|
E
|
|
WSR01
|
20200530
|
Rainy
|
Moderate
|
Mid-Ebb
|
Middle
|
4.1
|
17:23
|
9.66
|
8.1
|
31.34
|
27.67
|
0.92
|
3
|
<0.10
|
0.158
|
E
|
|
WSR01
|
20200530
|
Rainy
|
Moderate
|
Mid-Ebb
|
Middle
|
4.1
|
17:23
|
9.14
|
8.22
|
31.92
|
27.47
|
1.22
|
3
|
<0.10
|
0.166
|
SE
|
|
WSR01
|
20200530
|
Rainy
|
Moderate
|
Mid-Ebb
|
Surface
|
1
|
17:24
|
9.07
|
8.2
|
31.69
|
27.19
|
1.46
|
4
|
<0.10
|
0.134
|
SE
|
|
WSR01
|
20200530
|
Rainy
|
Moderate
|
Mid-Ebb
|
Surface
|
1
|
17:24
|
10.31
|
8.02
|
31.87
|
27.56
|
1.55
|
4
|
<0.10
|
0.133
|
E
|
|
WSR02
|
20200530
|
Rainy
|
Moderate
|
Mid-Ebb
|
Bottom
|
8.6
|
16:58
|
8.94
|
8.22
|
32.16
|
27.34
|
1.67
|
2
|
<0.10
|
0.15
|
E
|
|
WSR02
|
20200530
|
Rainy
|
Moderate
|
Mid-Ebb
|
Bottom
|
8.6
|
16:58
|
9.21
|
8.16
|
31.93
|
27.25
|
1.31
|
2
|
<0.10
|
0.192
|
E
|
|
WSR02
|
20200530
|
Rainy
|
Moderate
|
Mid-Ebb
|
Middle
|
4.8
|
16:59
|
9.91
|
8.12
|
32.29
|
27.23
|
1.05
|
2
|
<0.10
|
0.153
|
SE
|
|
WSR02
|
20200530
|
Rainy
|
Moderate
|
Mid-Ebb
|
Middle
|
4.8
|
16:59
|
9.13
|
8.17
|
31.08
|
27.64
|
0.93
|
2
|
<0.10
|
0.186
|
SE
|
|
WSR02
|
20200530
|
Rainy
|
Moderate
|
Mid-Ebb
|
Surface
|
1
|
17:00
|
9.48
|
8.27
|
32.37
|
27.52
|
1.69
|
3
|
<0.10
|
0.151
|
SE
|
|
WSR02
|
20200530
|
Rainy
|
Moderate
|
Mid-Ebb
|
Surface
|
1
|
17:00
|
8.98
|
8.1
|
31.83
|
27.37
|
1.59
|
3
|
<0.10
|
0.197
|
SE
|
|
WSR03
|
20200530
|
Rainy
|
Moderate
|
Mid-Ebb
|
Bottom
|
6.8
|
16:28
|
9.83
|
8.22
|
31.31
|
27.39
|
1.41
|
4
|
<0.10
|
0.158
|
E
|
|
WSR03
|
20200530
|
Rainy
|
Moderate
|
Mid-Ebb
|
Bottom
|
6.8
|
16:28
|
9.19
|
8.08
|
31.5
|
27.12
|
1.68
|
4
|
<0.10
|
0.141
|
E
|
|
WSR03
|
20200530
|
Rainy
|
Moderate
|
Mid-Ebb
|
Middle
|
3.9
|
16:29
|
10.19
|
8.23
|
32.14
|
27.24
|
0.88
|
<2
|
<0.10
|
0.212
|
SE
|
|
WSR03
|
20200530
|
Rainy
|
Moderate
|
Mid-Ebb
|
Middle
|
3.9
|
16:29
|
9.66
|
8.11
|
31.97
|
27.17
|
1.42
|
<2
|
<0.10
|
0.16
|
E
|
|
WSR03
|
20200530
|
Rainy
|
Moderate
|
Mid-Ebb
|
Surface
|
1
|
16:30
|
9.51
|
8.03
|
32.35
|
27.4
|
1.81
|
<2
|
<0.10
|
0.22
|
SE
|
|
WSR03
|
20200530
|
Rainy
|
Moderate
|
Mid-Ebb
|
Surface
|
1
|
16:30
|
9.84
|
8.24
|
32.29
|
27.15
|
1.26
|
<2
|
<0.10
|
0.187
|
SE
|
|
WSR04
|
20200530
|
Rainy
|
Moderate
|
Mid-Ebb
|
Bottom
|
6.1
|
16:11
|
8.59
|
8.06
|
31.87
|
27.4
|
1.81
|
3
|
<0.10
|
0.154
|
SE
|
|
WSR04
|
20200530
|
Rainy
|
Moderate
|
Mid-Ebb
|
Bottom
|
6.1
|
16:11
|
9.02
|
8.25
|
32.13
|
27.14
|
1.35
|
3
|
<0.10
|
0.209
|
E
|
|
WSR04
|
20200530
|
Rainy
|
Moderate
|
Mid-Ebb
|
Middle
|
3.55
|
16:12
|
9.72
|
8.17
|
31.48
|
27.24
|
1.35
|
2
|
<0.10
|
0.203
|
SE
|
|
WSR04
|
20200530
|
Rainy
|
Moderate
|
Mid-Ebb
|
Middle
|
3.55
|
16:12
|
8.84
|
8.2
|
31.68
|
27.16
|
1.11
|
2
|
<0.10
|
0.217
|
E
|
|
WSR04
|
20200530
|
Rainy
|
Moderate
|
Mid-Ebb
|
Surface
|
1
|
16:13
|
8.57
|
8.13
|
31.98
|
27.57
|
1.64
|
2
|
<0.10
|
0.21
|
SE
|
|
WSR04
|
20200530
|
Rainy
|
Moderate
|
Mid-Ebb
|
Surface
|
1
|
16:13
|
8.64
|
8.27
|
31.07
|
27.58
|
1.49
|
2
|
<0.10
|
0.156
|
E
|
|
WSR16
|
20200530
|
Rainy
|
Moderate
|
Mid-Ebb
|
Bottom
|
11.5
|
14:53
|
9.51
|
8.02
|
32.04
|
27.16
|
1.12
|
2
|
<0.10
|
0.145
|
SE
|
|
WSR16
|
20200530
|
Rainy
|
Moderate
|
Mid-Ebb
|
Bottom
|
11.5
|
14:53
|
9.4
|
8.01
|
32.03
|
27.65
|
1.43
|
2
|
<0.10
|
0.143
|
SE
|
|
WSR16
|
20200530
|
Rainy
|
Moderate
|
Mid-Ebb
|
Middle
|
6.25
|
14:54
|
8.79
|
8.02
|
31.85
|
27.59
|
1.25
|
4
|
<0.10
|
0.164
|
SE
|
|
WSR16
|
20200530
|
Rainy
|
Moderate
|
Mid-Ebb
|
Middle
|
6.25
|
14:54
|
9.52
|
8.09
|
32.27
|
27.66
|
1.52
|
4
|
<0.10
|
0.167
|
SE
|
|
WSR16
|
20200530
|
Rainy
|
Moderate
|
Mid-Ebb
|
Surface
|
1
|
14:55
|
9.88
|
8.14
|
32.1
|
27.42
|
1.14
|
4
|
<0.10
|
0.177
|
E
|
|
WSR16
|
20200530
|
Rainy
|
Moderate
|
Mid-Ebb
|
Surface
|
1
|
14:55
|
9.43
|
8.23
|
31.06
|
27.61
|
1.46
|
4
|
<0.10
|
0.198
|
SE
|
|
WSR33
|
20200530
|
Rainy
|
Moderate
|
Mid-Ebb
|
Bottom
|
6.4
|
15:55
|
10.14
|
8.16
|
31.49
|
27.43
|
1.81
|
<2
|
<0.10
|
0.159
|
SE
|
|
WSR33
|
20200530
|
Rainy
|
Moderate
|
Mid-Ebb
|
Bottom
|
6.4
|
15:55
|
10.38
|
8.02
|
31.41
|
27.5
|
1.81
|
<2
|
<0.10
|
0.154
|
SE
|
|
WSR33
|
20200530
|
Rainy
|
Moderate
|
Mid-Ebb
|
Middle
|
3.7
|
15:56
|
9.24
|
8.01
|
31.8
|
27.26
|
1.4
|
2
|
<0.10
|
0.217
|
SE
|
|
WSR33
|
20200530
|
Rainy
|
Moderate
|
Mid-Ebb
|
Middle
|
3.7
|
15:56
|
10.2
|
8.03
|
31.78
|
27.12
|
1.25
|
2
|
<0.10
|
0.171
|
E
|
|
WSR33
|
20200530
|
Rainy
|
Moderate
|
Mid-Ebb
|
Surface
|
1
|
15:57
|
10.31
|
8.07
|
32.25
|
27.51
|
1.36
|
3
|
<0.10
|
0.137
|
E
|
|
WSR33
|
20200530
|
Rainy
|
Moderate
|
Mid-Ebb
|
Surface
|
1
|
15:57
|
9.38
|
8.1
|
32.21
|
27.26
|
1.12
|
3
|
<0.10
|
0.153
|
E
|
|
WSR36
|
20200530
|
Rainy
|
Moderate
|
Mid-Ebb
|
Bottom
|
3.9
|
15:43
|
8.72
|
8.24
|
31.98
|
27.49
|
1.66
|
2
|
<0.10
|
0.169
|
SE
|
|
WSR36
|
20200530
|
Rainy
|
Moderate
|
Mid-Ebb
|
Bottom
|
3.9
|
15:43
|
9.72
|
8.06
|
32.24
|
27.61
|
1.25
|
2
|
<0.10
|
0.167
|
E
|
|
WSR36
|
20200530
|
Rainy
|
Moderate
|
Mid-Ebb
|
Surface
|
1
|
15:44
|
8.8
|
8.07
|
31.15
|
27.68
|
1.46
|
3
|
<0.10
|
0.219
|
E
|
|
WSR36
|
20200530
|
Rainy
|
Moderate
|
Mid-Ebb
|
Surface
|
1
|
15:44
|
8.96
|
8.02
|
31.38
|
27.27
|
1.68
|
3
|
<0.10
|
0.211
|
E
|
|
WSR37
|
20200530
|
Rainy
|
Moderate
|
Mid-Ebb
|
Bottom
|
6.3
|
15:26
|
10.09
|
8.2
|
32.24
|
27.21
|
1.32
|
6
|
<0.10
|
0.141
|
E
|
|
WSR37
|
20200530
|
Rainy
|
Moderate
|
Mid-Ebb
|
Bottom
|
6.3
|
15:26
|
10.25
|
8.04
|
31.26
|
27.4
|
1.65
|
6
|
<0.10
|
0.164
|
SE
|
|
WSR37
|
20200530
|
Rainy
|
Moderate
|
Mid-Ebb
|
Middle
|
3.65
|
15:27
|
9.18
|
8.12
|
32.23
|
27.27
|
1.54
|
4
|
<0.10
|
0.214
|
E
|
|
WSR37
|
20200530
|
Rainy
|
Moderate
|
Mid-Ebb
|
Middle
|
3.65
|
15:27
|
8.95
|
8.26
|
32.35
|
27.17
|
1.2
|
5
|
<0.10
|
0.141
|
E
|
|
WSR37
|
20200530
|
Rainy
|
Moderate
|
Mid-Ebb
|
Surface
|
1
|
15:28
|
9
|
8.08
|
32.34
|
27.35
|
1.82
|
4
|
<0.10
|
0.15
|
SE
|
|
WSR37
|
20200530
|
Rainy
|
Moderate
|
Mid-Ebb
|
Surface
|
1
|
15:28
|
9.11
|
8.03
|
32.19
|
27.39
|
1.24
|
4
|
<0.10
|
0.139
|
SE
|
|
CE
|
20200602
|
Cloudy
|
Moderate
|
Mid-Ebb
|
Bottom
|
11.2
|
8:00
|
8.09
|
8.07
|
31.99
|
26.3
|
2.36
|
4
|
<0.10
|
0.386
|
E
|
|
CE
|
20200602
|
Cloudy
|
Moderate
|
Mid-Ebb
|
Bottom
|
11.2
|
8:00
|
9.6
|
8.03
|
31.51
|
26.61
|
2.19
|
4
|
<0.10
|
0.303
|
SE
|
|
CE
|
20200602
|
Cloudy
|
Moderate
|
Mid-Ebb
|
Middle
|
6.1
|
8:01
|
9.59
|
8.16
|
31.36
|
26.78
|
2.08
|
4
|
<0.10
|
0.437
|
E
|
|
CE
|
20200602
|
Cloudy
|
Moderate
|
Mid-Ebb
|
Middle
|
6.1
|
8:01
|
8.14
|
8.05
|
31.45
|
26.78
|
1.9
|
4
|
<0.10
|
0.409
|
E
|
|
CE
|
20200602
|
Cloudy
|
Moderate
|
Mid-Ebb
|
Surface
|
1
|
8:02
|
7.62
|
8.24
|
32.14
|
26.61
|
1.54
|
3
|
<0.10
|
0.352
|
E
|
|
CE
|
20200602
|
Cloudy
|
Moderate
|
Mid-Ebb
|
Surface
|
1
|
8:02
|
8.26
|
8.03
|
32.87
|
26.18
|
1.34
|
3
|
<0.10
|
0.443
|
SE
|
|
CF
|
20200602
|
Cloudy
|
Moderate
|
Mid-Ebb
|
Bottom
|
11
|
8:07
|
7.91
|
8.15
|
32.38
|
26.72
|
2.15
|
2
|
<0.10
|
0.13
|
E
|
|
CF
|
20200602
|
Cloudy
|
Moderate
|
Mid-Ebb
|
Bottom
|
11
|
8:07
|
9.53
|
8.17
|
31.81
|
26.6
|
1.83
|
2
|
<0.10
|
0.202
|
E
|
|
CF
|
20200602
|
Cloudy
|
Moderate
|
Mid-Ebb
|
Middle
|
6
|
8:08
|
9.16
|
8.23
|
31.41
|
26.31
|
1.97
|
3
|
<0.10
|
0.136
|
E
|
|
CF
|
20200602
|
Cloudy
|
Moderate
|
Mid-Ebb
|
Middle
|
6
|
8:08
|
8.93
|
8.16
|
31.48
|
26.77
|
1.12
|
3
|
<0.10
|
0.185
|
SE
|
|
CF
|
20200602
|
Cloudy
|
Moderate
|
Mid-Ebb
|
Surface
|
1
|
8:09
|
7.67
|
8.2
|
32.65
|
26.44
|
1.45
|
3
|
<0.10
|
0.13
|
E
|
|
CF
|
20200602
|
Cloudy
|
Moderate
|
Mid-Ebb
|
Surface
|
1
|
8:09
|
8.36
|
8.05
|
32.18
|
26.54
|
0.93
|
3
|
<0.10
|
0.141
|
E
|
|
NF1
|
20200602
|
Cloudy
|
Moderate
|
Mid-Ebb
|
Bottom
|
10.1
|
8:41
|
8.43
|
8.16
|
32.53
|
26.92
|
1.59
|
3
|
<0.10
|
0.16
|
E
|
|
NF1
|
20200602
|
Cloudy
|
Moderate
|
Mid-Ebb
|
Bottom
|
10.1
|
8:41
|
9.43
|
8.15
|
32.51
|
26.79
|
1.51
|
3
|
<0.10
|
0.132
|
E
|
|
NF1
|
20200602
|
Cloudy
|
Moderate
|
Mid-Ebb
|
Middle
|
5.55
|
8:42
|
9.19
|
8.13
|
32.43
|
27.11
|
1.59
|
4
|
<0.10
|
0.136
|
E
|
|
NF1
|
20200602
|
Cloudy
|
Moderate
|
Mid-Ebb
|
Middle
|
5.55
|
8:42
|
9.22
|
8.18
|
32.73
|
26.74
|
1.62
|
4
|
<0.10
|
0.14
|
SE
|
|
NF1
|
20200602
|
Cloudy
|
Moderate
|
Mid-Ebb
|
Surface
|
1
|
8:43
|
7.78
|
8.13
|
32.33
|
26.46
|
2.01
|
5
|
<0.10
|
0.188
|
SE
|
|
NF1
|
20200602
|
Cloudy
|
Moderate
|
Mid-Ebb
|
Surface
|
1
|
8:43
|
7.82
|
8.15
|
32.01
|
27.05
|
0.98
|
5
|
<0.10
|
0.191
|
E
|
|
NF2
|
20200602
|
Cloudy
|
Moderate
|
Mid-Ebb
|
Bottom
|
7.7
|
10:13
|
9.39
|
8.23
|
31.65
|
27.19
|
1.5
|
3
|
<0.10
|
0.169
|
SE
|
|
NF2
|
20200602
|
Cloudy
|
Moderate
|
Mid-Ebb
|
Bottom
|
7.7
|
10:13
|
8.26
|
8.22
|
31.67
|
27.34
|
2.55
|
3
|
<0.10
|
0.185
|
SE
|
|
NF2
|
20200602
|
Cloudy
|
Moderate
|
Mid-Ebb
|
Middle
|
4.35
|
10:14
|
9.55
|
8.18
|
31.33
|
26.67
|
1.7
|
4
|
<0.10
|
0.207
|
E
|
|
NF2
|
20200602
|
Cloudy
|
Moderate
|
Mid-Ebb
|
Middle
|
4.35
|
10:14
|
8.64
|
8.06
|
32.32
|
27.3
|
1.31
|
4
|
<0.10
|
0.148
|
E
|
|
NF2
|
20200602
|
Cloudy
|
Moderate
|
Mid-Ebb
|
Surface
|
1
|
10:15
|
7.94
|
8.19
|
32.83
|
27.67
|
2.17
|
5
|
<0.10
|
0.193
|
E
|
|
NF2
|
20200602
|
Cloudy
|
Moderate
|
Mid-Ebb
|
Surface
|
1
|
10:15
|
7.66
|
8.2
|
31.87
|
26.63
|
1.04
|
5
|
<0.10
|
0.189
|
E
|
|
NF3
|
20200602
|
Cloudy
|
Moderate
|
Mid-Ebb
|
Bottom
|
9.6
|
10:23
|
9.61
|
8.08
|
32.78
|
27.78
|
2.24
|
6
|
<0.10
|
0.188
|
SE
|
|
NF3
|
20200602
|
Cloudy
|
Moderate
|
Mid-Ebb
|
Bottom
|
9.6
|
10:23
|
9.68
|
8.12
|
31.96
|
26.95
|
2.47
|
6
|
<0.10
|
0.184
|
SE
|
|
NF3
|
20200602
|
Cloudy
|
Moderate
|
Mid-Ebb
|
Middle
|
5.3
|
10:24
|
7.73
|
8.13
|
32.28
|
27.47
|
1.25
|
4
|
<0.10
|
0.133
|
SE
|
|
NF3
|
20200602
|
Cloudy
|
Moderate
|
Mid-Ebb
|
Middle
|
5.3
|
10:24
|
8.05
|
8.05
|
32.75
|
26.81
|
1.73
|
4
|
<0.10
|
0.197
|
SE
|
|
NF3
|
20200602
|
Cloudy
|
Moderate
|
Mid-Ebb
|
Surface
|
1
|
10:25
|
9.63
|
8.16
|
32.55
|
27.18
|
1.35
|
3
|
<0.10
|
0.132
|
E
|
|
NF3
|
20200602
|
Cloudy
|
Moderate
|
Mid-Ebb
|
Surface
|
1
|
10:25
|
9.7
|
8.09
|
32.6
|
26.67
|
1.85
|
3
|
<0.10
|
0.171
|
E
|
|
WSR01
|
20200602
|
Cloudy
|
Moderate
|
Mid-Ebb
|
Bottom
|
7.9
|
10:56
|
8.59
|
8.12
|
31.45
|
27.79
|
2.36
|
5
|
<0.10
|
0.156
|
E
|
|
WSR01
|
20200602
|
Cloudy
|
Moderate
|
Mid-Ebb
|
Bottom
|
7.9
|
10:56
|
9.6
|
8.14
|
32.35
|
26.94
|
1.8
|
5
|
<0.10
|
0.144
|
E
|
|
WSR01
|
20200602
|
Cloudy
|
Moderate
|
Mid-Ebb
|
Middle
|
4.45
|
10:57
|
8.91
|
8.05
|
32.17
|
27.35
|
2.09
|
4
|
<0.10
|
0.141
|
SE
|
|
WSR01
|
20200602
|
Cloudy
|
Moderate
|
Mid-Ebb
|
Middle
|
4.45
|
10:57
|
9.5
|
8.1
|
31.44
|
27.09
|
1.53
|
4
|
<0.10
|
0.202
|
SE
|
|
WSR01
|
20200602
|
Cloudy
|
Moderate
|
Mid-Ebb
|
Surface
|
1
|
10:58
|
8.78
|
8.09
|
32.07
|
27.39
|
1.3
|
3
|
<0.10
|
0.159
|
E
|
|
WSR01
|
20200602
|
Cloudy
|
Moderate
|
Mid-Ebb
|
Surface
|
1
|
10:58
|
8.12
|
8.2
|
32.81
|
27.23
|
1.37
|
2
|
<0.10
|
0.13
|
SE
|
|
WSR02
|
20200602
|
Cloudy
|
Moderate
|
Mid-Ebb
|
Bottom
|
8.7
|
10:32
|
7.88
|
8.08
|
32.93
|
27.03
|
1.97
|
4
|
<0.10
|
0.186
|
E
|
|
WSR02
|
20200602
|
Cloudy
|
Moderate
|
Mid-Ebb
|
Bottom
|
8.7
|
10:32
|
8.06
|
8.22
|
32.51
|
27.77
|
2.36
|
3
|
<0.10
|
0.209
|
SE
|
|
WSR02
|
20200602
|
Cloudy
|
Moderate
|
Mid-Ebb
|
Middle
|
4.85
|
10:33
|
7.69
|
8.09
|
31.89
|
27.6
|
1.92
|
3
|
<0.10
|
0.22
|
SE
|
|
WSR02
|
20200602
|
Cloudy
|
Moderate
|
Mid-Ebb
|
Middle
|
4.85
|
10:33
|
8.87
|
8.08
|
32.74
|
27.6
|
1.58
|
3
|
<0.10
|
0.133
|
E
|
|
WSR02
|
20200602
|
Cloudy
|
Moderate
|
Mid-Ebb
|
Surface
|
1
|
10:34
|
7.5
|
8.2
|
31.91
|
27.81
|
2.09
|
2
|
<0.10
|
0.149
|
SE
|
|
WSR02
|
20200602
|
Cloudy
|
Moderate
|
Mid-Ebb
|
Surface
|
1
|
10:34
|
9.22
|
8.02
|
32.09
|
27.41
|
1.89
|
2
|
<0.10
|
0.166
|
E
|
|
WSR03
|
20200602
|
Cloudy
|
Moderate
|
Mid-Ebb
|
Bottom
|
7.2
|
9:57
|
9.18
|
8.13
|
31.56
|
26.49
|
2.59
|
3
|
<0.10
|
0.19
|
E
|
|
WSR03
|
20200602
|
Cloudy
|
Moderate
|
Mid-Ebb
|
Bottom
|
7.2
|
9:57
|
8
|
8.18
|
32.88
|
27.03
|
2.25
|
3
|
<0.10
|
0.186
|
E
|
|
WSR03
|
20200602
|
Cloudy
|
Moderate
|
Mid-Ebb
|
Middle
|
4.1
|
9:58
|
7.76
|
8.24
|
31.33
|
26.69
|
2.02
|
4
|
<0.10
|
0.196
|
SE
|
|
WSR03
|
20200602
|
Cloudy
|
Moderate
|
Mid-Ebb
|
Middle
|
4.1
|
9:58
|
7.73
|
8.03
|
31.79
|
26.43
|
1.53
|
4
|
<0.10
|
0.16
|
E
|
|
WSR03
|
20200602
|
Cloudy
|
Moderate
|
Mid-Ebb
|
Surface
|
1
|
9:59
|
8.11
|
8.04
|
32.01
|
27.28
|
0.94
|
4
|
<0.10
|
0.191
|
E
|
|
WSR03
|
20200602
|
Cloudy
|
Moderate
|
Mid-Ebb
|
Surface
|
1
|
9:59
|
8.73
|
8.12
|
31.95
|
27.07
|
2.17
|
4
|
<0.10
|
0.15
|
E
|
|
WSR04
|
20200602
|
Cloudy
|
Moderate
|
Mid-Ebb
|
Bottom
|
5.8
|
9:40
|
9.4
|
8.05
|
32.97
|
27.33
|
2.6
|
4
|
<0.10
|
0.153
|
E
|
|
WSR04
|
20200602
|
Cloudy
|
Moderate
|
Mid-Ebb
|
Bottom
|
5.8
|
9:40
|
8.99
|
8.02
|
31.93
|
27.09
|
1.92
|
4
|
<0.10
|
0.143
|
SE
|
|
WSR04
|
20200602
|
Cloudy
|
Moderate
|
Mid-Ebb
|
Middle
|
3.4
|
9:41
|
7.59
|
8.07
|
32.67
|
27.5
|
1.08
|
3
|
<0.10
|
0.181
|
SE
|
|
WSR04
|
20200602
|
Cloudy
|
Moderate
|
Mid-Ebb
|
Middle
|
3.4
|
9:41
|
9.54
|
8.07
|
32.06
|
27.13
|
1.18
|
3
|
<0.10
|
0.2
|
SE
|
|
WSR04
|
20200602
|
Cloudy
|
Moderate
|
Mid-Ebb
|
Surface
|
1
|
9:42
|
9.55
|
8.18
|
32.29
|
27.1
|
1.58
|
3
|
<0.10
|
0.151
|
E
|
|
WSR04
|
20200602
|
Cloudy
|
Moderate
|
Mid-Ebb
|
Surface
|
1
|
9:42
|
9.13
|
8.04
|
31.83
|
27.35
|
1.95
|
3
|
<0.10
|
0.156
|
E
|
|
WSR16
|
20200602
|
Cloudy
|
Moderate
|
Mid-Ebb
|
Bottom
|
11.6
|
8:19
|
9.14
|
8.06
|
32.96
|
26.99
|
1.7
|
2
|
<0.10
|
0.162
|
E
|
|
WSR16
|
20200602
|
Cloudy
|
Moderate
|
Mid-Ebb
|
Bottom
|
11.6
|
8:19
|
9.41
|
8.18
|
32.33
|
26.52
|
1.74
|
2
|
<0.10
|
0.154
|
E
|
|
WSR16
|
20200602
|
Cloudy
|
Moderate
|
Mid-Ebb
|
Middle
|
6.3
|
8:20
|
8.12
|
8.05
|
32.22
|
26.71
|
1.96
|
3
|
<0.10
|
0.212
|
SE
|
|
WSR16
|
20200602
|
Cloudy
|
Moderate
|
Mid-Ebb
|
Middle
|
6.3
|
8:20
|
8.26
|
8.09
|
31.58
|
26.06
|
1.05
|
3
|
<0.10
|
0.172
|
SE
|
|
WSR16
|
20200602
|
Cloudy
|
Moderate
|
Mid-Ebb
|
Surface
|
1
|
8:21
|
8.07
|
8.22
|
32.44
|
26.17
|
1.54
|
4
|
<0.10
|
0.163
|
SE
|
|
WSR16
|
20200602
|
Cloudy
|
Moderate
|
Mid-Ebb
|
Surface
|
1
|
8:21
|
9.44
|
8.03
|
32.71
|
26.67
|
1.43
|
4
|
<0.10
|
0.163
|
SE
|
|
WSR33
|
20200602
|
Cloudy
|
Moderate
|
Mid-Ebb
|
Bottom
|
6.5
|
9:22
|
9.44
|
8.19
|
32.04
|
26.71
|
1.57
|
4
|
<0.10
|
0.214
|
E
|
|
WSR33
|
20200602
|
Cloudy
|
Moderate
|
Mid-Ebb
|
Bottom
|
6.5
|
9:22
|
9.13
|
8.15
|
31.38
|
27.61
|
2.3
|
4
|
<0.10
|
0.154
|
SE
|
|
WSR33
|
20200602
|
Cloudy
|
Moderate
|
Mid-Ebb
|
Middle
|
3.75
|
9:23
|
9.14
|
8.03
|
32.57
|
27.56
|
1.52
|
3
|
<0.10
|
0.196
|
E
|
|
WSR33
|
20200602
|
Cloudy
|
Moderate
|
Mid-Ebb
|
Middle
|
3.75
|
9:23
|
8.95
|
8.07
|
31.95
|
26.59
|
1.15
|
3
|
<0.10
|
0.164
|
E
|
|
WSR33
|
20200602
|
Cloudy
|
Moderate
|
Mid-Ebb
|
Surface
|
1
|
9:24
|
9.62
|
8.16
|
31.64
|
26.9
|
2
|
2
|
<0.10
|
0.19
|
SE
|
|
WSR33
|
20200602
|
Cloudy
|
Moderate
|
Mid-Ebb
|
Surface
|
1
|
9:24
|
8.46
|
8.18
|
32.52
|
27.04
|
1.89
|
2
|
<0.10
|
0.169
|
SE
|
|
WSR36
|
20200602
|
Cloudy
|
Moderate
|
Mid-Ebb
|
Bottom
|
4.1
|
9:08
|
8.04
|
8.21
|
31.74
|
27.05
|
2.65
|
7
|
<0.10
|
0.159
|
SE
|
|
WSR36
|
20200602
|
Cloudy
|
Moderate
|
Mid-Ebb
|
Bottom
|
4.1
|
9:08
|
8.01
|
8.14
|
31.4
|
26.9
|
2.12
|
7
|
<0.10
|
0.157
|
SE
|
|
WSR36
|
20200602
|
Cloudy
|
Moderate
|
Mid-Ebb
|
Surface
|
1
|
9:09
|
9.53
|
8.21
|
32.16
|
26.95
|
1.14
|
4
|
<0.10
|
0.168
|
E
|
|
WSR36
|
20200602
|
Cloudy
|
Moderate
|
Mid-Ebb
|
Surface
|
1
|
9:09
|
8.51
|
8.1
|
31.65
|
27.6
|
1.39
|
4
|
<0.10
|
0.161
|
E
|
|
WSR37
|
20200602
|
Cloudy
|
Moderate
|
Mid-Ebb
|
Bottom
|
6.5
|
8:52
|
7.83
|
8.2
|
32.42
|
26.8
|
1.76
|
6
|
<0.10
|
0.176
|
E
|
|
WSR37
|
20200602
|
Cloudy
|
Moderate
|
Mid-Ebb
|
Bottom
|
6.5
|
8:52
|
9.33
|
8.14
|
32.79
|
26.4
|
1.81
|
6
|
<0.10
|
0.206
|
E
|
|
WSR37
|
20200602
|
Cloudy
|
Moderate
|
Mid-Ebb
|
Middle
|
3.75
|
8:53
|
9.13
|
8.03
|
31.36
|
26.44
|
1.99
|
4
|
<0.10
|
0.221
|
SE
|
|
WSR37
|
20200602
|
Cloudy
|
Moderate
|
Mid-Ebb
|
Middle
|
3.75
|
8:53
|
9.58
|
8.07
|
32.91
|
26.83
|
1.2
|
4
|
<0.10
|
0.178
|
SE
|
|
WSR37
|
20200602
|
Cloudy
|
Moderate
|
Mid-Ebb
|
Surface
|
1
|
8:54
|
7.67
|
8.02
|
32.03
|
26.48
|
1.38
|
3
|
<0.10
|
0.197
|
E
|
|
WSR37
|
20200602
|
Cloudy
|
Moderate
|
Mid-Ebb
|
Surface
|
1
|
8:54
|
9.03
|
8.06
|
31.86
|
26.92
|
1.85
|
3
|
<0.10
|
0.165
|
E
|
|
CE
|
20200602
|
Cloudy
|
Moderate
|
Mid-Flood
|
Bottom
|
11.2
|
14:02
|
8.79
|
8.25
|
31.99
|
27.68
|
1.71
|
3
|
<0.10
|
0.203
|
NW
|
|
CE
|
20200602
|
Cloudy
|
Moderate
|
Mid-Flood
|
Bottom
|
11.2
|
14:02
|
8.98
|
8.23
|
32.35
|
27.81
|
2.5
|
3
|
<0.10
|
0.159
|
NW
|
|
CE
|
20200602
|
Cloudy
|
Moderate
|
Mid-Flood
|
Middle
|
6.1
|
14:03
|
9.39
|
8.14
|
31.68
|
27.48
|
1.13
|
2
|
<0.10
|
0.163
|
NW
|
|
CE
|
20200602
|
Cloudy
|
Moderate
|
Mid-Flood
|
Middle
|
6.1
|
14:03
|
7.97
|
8.19
|
31.67
|
27.76
|
1.77
|
2
|
<0.10
|
0.162
|
NW
|
|
CE
|
20200602
|
Cloudy
|
Moderate
|
Mid-Flood
|
Surface
|
1
|
14:04
|
8.1
|
8.32
|
31.2
|
27.81
|
1.03
|
<2
|
<0.10
|
0.213
|
N
|
|
CE
|
20200602
|
Cloudy
|
Moderate
|
Mid-Flood
|
Surface
|
1
|
14:04
|
8.33
|
8.34
|
32.21
|
27.71
|
1.45
|
<2
|
<0.10
|
0.218
|
N
|
|
CF
|
20200602
|
Cloudy
|
Moderate
|
Mid-Flood
|
Bottom
|
11.3
|
14:01
|
9.38
|
8.01
|
32.03
|
27.93
|
2.06
|
5
|
<0.10
|
0.241
|
SW
|
|
CF
|
20200602
|
Cloudy
|
Moderate
|
Mid-Flood
|
Bottom
|
11.3
|
14:01
|
8.88
|
8.21
|
31.72
|
27.53
|
2.51
|
5
|
<0.10
|
0.158
|
NW
|
|
CF
|
20200602
|
Cloudy
|
Moderate
|
Mid-Flood
|
Middle
|
6.15
|
14:02
|
9.22
|
8.22
|
31.58
|
27.52
|
2.04
|
6
|
<0.10
|
0.222
|
SW
|
|
CF
|
20200602
|
Cloudy
|
Moderate
|
Mid-Flood
|
Middle
|
6.15
|
14:02
|
9.25
|
8.34
|
31.77
|
27.38
|
1.93
|
6
|
<0.10
|
0.221
|
W
|
|
CF
|
20200602
|
Cloudy
|
Moderate
|
Mid-Flood
|
Surface
|
1
|
14:03
|
8.11
|
8.09
|
32.45
|
27.58
|
1.05
|
6
|
<0.10
|
0.218
|
W
|
|
CF
|
20200602
|
Cloudy
|
Moderate
|
Mid-Flood
|
Surface
|
1
|
14:03
|
8.65
|
8.02
|
32.22
|
27.91
|
0.9
|
6
|
<0.10
|
0.223
|
W
|
|
NF1
|
20200602
|
Cloudy
|
Moderate
|
Mid-Flood
|
Bottom
|
10.8
|
14:44
|
8.72
|
8.13
|
32.41
|
27.92
|
1.82
|
3
|
<0.10
|
0.186
|
W
|
|
NF1
|
20200602
|
Cloudy
|
Moderate
|
Mid-Flood
|
Bottom
|
10.8
|
14:44
|
9.14
|
8.29
|
31.55
|
27.49
|
1.89
|
3
|
<0.10
|
0.152
|
W
|
|
NF1
|
20200602
|
Cloudy
|
Moderate
|
Mid-Flood
|
Middle
|
5.9
|
14:45
|
9.17
|
8.02
|
31.49
|
27.42
|
1.82
|
3
|
<0.10
|
0.173
|
SW
|
|
NF1
|
20200602
|
Cloudy
|
Moderate
|
Mid-Flood
|
Middle
|
5.9
|
14:45
|
8.08
|
8.08
|
32.04
|
27.62
|
1.27
|
3
|
<0.10
|
0.196
|
W
|
|
NF1
|
20200602
|
Cloudy
|
Moderate
|
Mid-Flood
|
Surface
|
1
|
14:46
|
8.58
|
8.2
|
31.35
|
27.43
|
1.45
|
4
|
<0.10
|
0.129
|
NW
|
|
NF1
|
20200602
|
Cloudy
|
Moderate
|
Mid-Flood
|
Surface
|
1
|
14:46
|
9.21
|
8.16
|
32.48
|
27.45
|
1.07
|
4
|
<0.10
|
0.13
|
NW
|
|
NF2
|
20200602
|
Cloudy
|
Moderate
|
Mid-Flood
|
Bottom
|
9.5
|
16:14
|
8.65
|
8.05
|
31.54
|
27.77
|
2.62
|
3
|
<0.10
|
0.193
|
W
|
|
NF2
|
20200602
|
Cloudy
|
Moderate
|
Mid-Flood
|
Bottom
|
9.5
|
16:14
|
8.78
|
8.29
|
31.49
|
27.57
|
2.31
|
3
|
<0.10
|
0.128
|
SW
|
|
NF2
|
20200602
|
Cloudy
|
Moderate
|
Mid-Flood
|
Middle
|
5.25
|
16:15
|
8.68
|
8.06
|
32
|
27.41
|
1.91
|
3
|
<0.10
|
0.193
|
W
|
|
NF2
|
20200602
|
Cloudy
|
Moderate
|
Mid-Flood
|
Middle
|
5.25
|
16:15
|
9.24
|
8.17
|
31.83
|
27.74
|
1.92
|
3
|
<0.10
|
0.135
|
W
|
|
NF2
|
20200602
|
Cloudy
|
Moderate
|
Mid-Flood
|
Surface
|
1
|
16:16
|
9.29
|
8.18
|
31.17
|
27.66
|
0.76
|
2
|
<0.10
|
0.183
|
W
|
|
NF2
|
20200602
|
Cloudy
|
Moderate
|
Mid-Flood
|
Surface
|
1
|
16:16
|
8.31
|
8.19
|
31.78
|
27.93
|
1.54
|
2
|
<0.10
|
0.149
|
W
|
|
NF3
|
20200602
|
Cloudy
|
Moderate
|
Mid-Flood
|
Bottom
|
10.1
|
16:22
|
9.02
|
8.11
|
31.16
|
27.34
|
1.57
|
5
|
<0.10
|
0.189
|
SW
|
|
NF3
|
20200602
|
Cloudy
|
Moderate
|
Mid-Flood
|
Bottom
|
10.1
|
16:22
|
8.15
|
8.28
|
31.1
|
27.88
|
2.09
|
5
|
<0.10
|
0.151
|
NW
|
|
NF3
|
20200602
|
Cloudy
|
Moderate
|
Mid-Flood
|
Middle
|
5.55
|
16:23
|
8.47
|
8.34
|
31.39
|
27.41
|
1.28
|
4
|
<0.10
|
0.162
|
SW
|
|
NF3
|
20200602
|
Cloudy
|
Moderate
|
Mid-Flood
|
Middle
|
5.55
|
16:23
|
9.11
|
8.3
|
32.19
|
27.63
|
1.31
|
4
|
<0.10
|
0.196
|
W
|
|
NF3
|
20200602
|
Cloudy
|
Moderate
|
Mid-Flood
|
Surface
|
1
|
16:24
|
8.34
|
8.16
|
32.33
|
27.49
|
0.8
|
4
|
<0.10
|
0.176
|
NW
|
|
NF3
|
20200602
|
Cloudy
|
Moderate
|
Mid-Flood
|
Surface
|
1
|
16:24
|
8.2
|
8.22
|
32.01
|
27.81
|
1.03
|
4
|
<0.10
|
0.178
|
SW
|
|
WSR01
|
20200602
|
Cloudy
|
Moderate
|
Mid-Flood
|
Bottom
|
7.3
|
16:47
|
8.14
|
8.31
|
31.59
|
27.45
|
1.91
|
2
|
<0.10
|
0.184
|
W
|
|
WSR01
|
20200602
|
Cloudy
|
Moderate
|
Mid-Flood
|
Bottom
|
7.3
|
16:47
|
8.98
|
8.07
|
31.76
|
27.42
|
2.21
|
2
|
<0.10
|
0.144
|
SW
|
|
WSR01
|
20200602
|
Cloudy
|
Moderate
|
Mid-Flood
|
Middle
|
4.15
|
16:48
|
9.47
|
8
|
31.98
|
27.76
|
1.59
|
4
|
<0.10
|
0.194
|
W
|
|
WSR01
|
20200602
|
Cloudy
|
Moderate
|
Mid-Flood
|
Middle
|
4.15
|
16:48
|
8.91
|
8.32
|
31.33
|
27.89
|
1.81
|
4
|
<0.10
|
0.162
|
W
|
|
WSR01
|
20200602
|
Cloudy
|
Moderate
|
Mid-Flood
|
Surface
|
1
|
16:49
|
9.16
|
8.28
|
31.89
|
27.74
|
1.44
|
5
|
<0.10
|
0.13
|
SW
|
|
WSR01
|
20200602
|
Cloudy
|
Moderate
|
Mid-Flood
|
Surface
|
1
|
16:49
|
9.3
|
8.06
|
32.53
|
27.88
|
1.06
|
5
|
<0.10
|
0.147
|
W
|
|
WSR02
|
20200602
|
Cloudy
|
Moderate
|
Mid-Flood
|
Bottom
|
8.1
|
16:23
|
8.37
|
8.08
|
32.27
|
27.64
|
1.62
|
3
|
<0.10
|
0.148
|
W
|
|
WSR02
|
20200602
|
Cloudy
|
Moderate
|
Mid-Flood
|
Bottom
|
8.1
|
16:23
|
8.06
|
8.29
|
32.52
|
27.42
|
1.67
|
3
|
<0.10
|
0.18
|
W
|
|
WSR02
|
20200602
|
Cloudy
|
Moderate
|
Mid-Flood
|
Middle
|
4.55
|
16:24
|
8.08
|
8.29
|
31.88
|
27.56
|
1.42
|
3
|
<0.10
|
0.171
|
W
|
|
WSR02
|
20200602
|
Cloudy
|
Moderate
|
Mid-Flood
|
Middle
|
4.55
|
16:24
|
8.42
|
8.15
|
32.21
|
27.84
|
1.55
|
2
|
<0.10
|
0.146
|
W
|
|
WSR02
|
20200602
|
Cloudy
|
Moderate
|
Mid-Flood
|
Surface
|
1
|
16:25
|
7.91
|
8.14
|
31.55
|
27.5
|
0.89
|
3
|
<0.10
|
0.173
|
NW
|
|
WSR02
|
20200602
|
Cloudy
|
Moderate
|
Mid-Flood
|
Surface
|
1
|
16:25
|
9.25
|
8.28
|
32.29
|
27.62
|
1.45
|
3
|
<0.10
|
0.137
|
W
|
|
WSR03
|
20200602
|
Cloudy
|
Moderate
|
Mid-Flood
|
Bottom
|
7.3
|
15:57
|
9.45
|
8.1
|
31.74
|
27.63
|
1.72
|
4
|
<0.10
|
0.195
|
SW
|
|
WSR03
|
20200602
|
Cloudy
|
Moderate
|
Mid-Flood
|
Bottom
|
7.3
|
15:57
|
8.13
|
8.22
|
32.31
|
27.59
|
2.04
|
4
|
<0.10
|
0.169
|
NW
|
|
WSR03
|
20200602
|
Cloudy
|
Moderate
|
Mid-Flood
|
Middle
|
4.15
|
15:58
|
8.38
|
8.3
|
32.5
|
27.96
|
1.11
|
4
|
<0.10
|
0.144
|
W
|
|
WSR03
|
20200602
|
Cloudy
|
Moderate
|
Mid-Flood
|
Middle
|
4.15
|
15:58
|
8.34
|
8.28
|
31.19
|
27.8
|
1.28
|
4
|
<0.10
|
0.191
|
W
|
|
WSR03
|
20200602
|
Cloudy
|
Moderate
|
Mid-Flood
|
Surface
|
1
|
15:59
|
7.88
|
8.32
|
31.57
|
27.74
|
1.31
|
4
|
<0.10
|
0.187
|
W
|
|
WSR03
|
20200602
|
Cloudy
|
Moderate
|
Mid-Flood
|
Surface
|
1
|
15:59
|
9.02
|
8.01
|
31.98
|
27.42
|
1.78
|
4
|
<0.10
|
0.174
|
W
|
|
WSR04
|
20200602
|
Cloudy
|
Moderate
|
Mid-Flood
|
Bottom
|
6.2
|
15:41
|
8.48
|
8.3
|
31.64
|
27.39
|
1.9
|
6
|
<0.10
|
0.144
|
SW
|
|
WSR04
|
20200602
|
Cloudy
|
Moderate
|
Mid-Flood
|
Bottom
|
6.2
|
15:41
|
8.32
|
8.28
|
31.49
|
27.74
|
2.54
|
5
|
<0.10
|
0.188
|
W
|
|
WSR04
|
20200602
|
Cloudy
|
Moderate
|
Mid-Flood
|
Middle
|
3.6
|
15:42
|
7.95
|
8.19
|
31.97
|
27.93
|
1.45
|
4
|
<0.10
|
0.183
|
W
|
|
WSR04
|
20200602
|
Cloudy
|
Moderate
|
Mid-Flood
|
Middle
|
3.6
|
15:42
|
8.88
|
8.12
|
31.35
|
27.78
|
1.7
|
4
|
<0.10
|
0.151
|
SW
|
|
WSR04
|
20200602
|
Cloudy
|
Moderate
|
Mid-Flood
|
Surface
|
1
|
15:43
|
7.88
|
8.06
|
32.08
|
27.52
|
0.87
|
4
|
<0.10
|
0.185
|
NW
|
|
WSR04
|
20200602
|
Cloudy
|
Moderate
|
Mid-Flood
|
Surface
|
1
|
15:43
|
8.5
|
8.31
|
31.6
|
27.85
|
1.19
|
4
|
<0.10
|
0.134
|
W
|
|
WSR16
|
20200602
|
Cloudy
|
Moderate
|
Mid-Flood
|
Bottom
|
11.8
|
14:24
|
9.24
|
8.12
|
32.1
|
27.8
|
2.62
|
3
|
<0.10
|
0.225
|
NW
|
|
WSR16
|
20200602
|
Cloudy
|
Moderate
|
Mid-Flood
|
Bottom
|
11.8
|
14:24
|
8.58
|
8.12
|
31.53
|
27.71
|
2.36
|
3
|
<0.10
|
0.178
|
NW
|
|
WSR16
|
20200602
|
Cloudy
|
Moderate
|
Mid-Flood
|
Middle
|
6.4
|
14:25
|
7.93
|
8.06
|
32.29
|
27.76
|
1.83
|
4
|
<0.10
|
0.182
|
NW
|
|
WSR16
|
20200602
|
Cloudy
|
Moderate
|
Mid-Flood
|
Middle
|
6.4
|
14:25
|
9.41
|
8.09
|
32.51
|
27.47
|
1.5
|
4
|
<0.10
|
0.188
|
N
|
|
WSR16
|
20200602
|
Cloudy
|
Moderate
|
Mid-Flood
|
Surface
|
1
|
14:26
|
8.26
|
8.18
|
31.27
|
27.51
|
1.65
|
4
|
<0.10
|
0.224
|
N
|
|
WSR16
|
20200602
|
Cloudy
|
Moderate
|
Mid-Flood
|
Surface
|
1
|
14:26
|
9.4
|
8.18
|
32.02
|
27.55
|
0.81
|
4
|
<0.10
|
0.207
|
NW
|
|
WSR33
|
20200602
|
Cloudy
|
Moderate
|
Mid-Flood
|
Bottom
|
6.7
|
15:25
|
8.51
|
8.17
|
31.96
|
27.85
|
1.83
|
5
|
<0.10
|
0.129
|
SW
|
|
WSR33
|
20200602
|
Cloudy
|
Moderate
|
Mid-Flood
|
Bottom
|
6.7
|
15:25
|
8.43
|
8.03
|
32.3
|
27.76
|
2.24
|
5
|
<0.10
|
0.132
|
W
|
|
WSR33
|
20200602
|
Cloudy
|
Moderate
|
Mid-Flood
|
Middle
|
3.85
|
15:26
|
7.93
|
8.31
|
31.59
|
27.43
|
1.81
|
4
|
<0.10
|
0.139
|
SW
|
|
WSR33
|
20200602
|
Cloudy
|
Moderate
|
Mid-Flood
|
Middle
|
3.85
|
15:26
|
7.89
|
8.06
|
32.29
|
27.92
|
1.53
|
4
|
<0.10
|
0.149
|
W
|
|
WSR33
|
20200602
|
Cloudy
|
Moderate
|
Mid-Flood
|
Surface
|
1
|
15:27
|
8.73
|
8.33
|
31.59
|
27.3
|
0.79
|
3
|
<0.10
|
0.192
|
SW
|
|
WSR33
|
20200602
|
Cloudy
|
Moderate
|
Mid-Flood
|
Surface
|
1
|
15:27
|
8.71
|
8
|
31.87
|
27.63
|
1.53
|
3
|
<0.10
|
0.166
|
W
|
|
WSR36
|
20200602
|
Cloudy
|
Moderate
|
Mid-Flood
|
Bottom
|
4.7
|
15:13
|
9.37
|
8.12
|
31.92
|
27.54
|
2.22
|
3
|
<0.10
|
0.186
|
SW
|
|
WSR36
|
20200602
|
Cloudy
|
Moderate
|
Mid-Flood
|
Bottom
|
4.7
|
15:13
|
9.13
|
8.14
|
32.11
|
27.83
|
2.43
|
3
|
<0.10
|
0.14
|
SW
|
|
WSR36
|
20200602
|
Cloudy
|
Moderate
|
Mid-Flood
|
Surface
|
1
|
15:14
|
9.34
|
8.02
|
31.93
|
27.89
|
0.8
|
5
|
<0.10
|
0.195
|
W
|
|
WSR36
|
20200602
|
Cloudy
|
Moderate
|
Mid-Flood
|
Surface
|
1
|
15:14
|
8.65
|
8.26
|
32.18
|
27.33
|
1.6
|
5
|
<0.10
|
0.129
|
W
|
|
WSR37
|
20200602
|
Cloudy
|
Moderate
|
Mid-Flood
|
Bottom
|
7.5
|
14:57
|
8.59
|
8.25
|
32.53
|
27.68
|
2.55
|
4
|
<0.10
|
0.152
|
W
|
|
WSR37
|
20200602
|
Cloudy
|
Moderate
|
Mid-Flood
|
Bottom
|
7.5
|
14:57
|
8.47
|
8.26
|
31.79
|
27.77
|
1.72
|
4
|
<0.10
|
0.164
|
W
|
|
WSR37
|
20200602
|
Cloudy
|
Moderate
|
Mid-Flood
|
Middle
|
4.25
|
14:58
|
8.5
|
8.04
|
31.86
|
27.69
|
1.79
|
4
|
<0.10
|
0.177
|
SW
|
|
WSR37
|
20200602
|
Cloudy
|
Moderate
|
Mid-Flood
|
Middle
|
4.25
|
14:58
|
8.54
|
8.26
|
31.62
|
27.81
|
1.53
|
4
|
<0.10
|
0.145
|
W
|
|
WSR37
|
20200602
|
Cloudy
|
Moderate
|
Mid-Flood
|
Surface
|
1
|
14:59
|
9.3
|
8.2
|
32.58
|
27.55
|
0.71
|
5
|
<0.10
|
0.163
|
W
|
|
WSR37
|
20200602
|
Cloudy
|
Moderate
|
Mid-Flood
|
Surface
|
1
|
14:59
|
9.11
|
8.22
|
32.08
|
27.57
|
1.56
|
5
|
<0.10
|
0.181
|
NW
|
|
CE
|
20200604
|
Sunny
|
Moderate
|
Mid-Ebb
|
Bottom
|
11.1
|
9:13
|
10.85
|
8.07
|
33.29
|
24.79
|
1.3
|
3
|
<0.10
|
0.404
|
SE
|
|
CE
|
20200604
|
Sunny
|
Moderate
|
Mid-Ebb
|
Bottom
|
11.1
|
9:13
|
10.52
|
8.06
|
33.28
|
24.8
|
1.64
|
4
|
<0.10
|
0.417
|
E
|
|
CE
|
20200604
|
Sunny
|
Moderate
|
Mid-Ebb
|
Middle
|
6.05
|
9:14
|
8.53
|
8.01
|
33.05
|
25.06
|
1.81
|
4
|
<0.10
|
0.342
|
SE
|
|
CE
|
20200604
|
Sunny
|
Moderate
|
Mid-Ebb
|
Middle
|
6.05
|
9:14
|
8.32
|
8.01
|
33.13
|
25
|
1.71
|
4
|
<0.10
|
0.422
|
E
|
|
CE
|
20200604
|
Sunny
|
Moderate
|
Mid-Ebb
|
Surface
|
1
|
9:15
|
8.71
|
8.03
|
31.26
|
26.71
|
3.44
|
3
|
<0.10
|
0.306
|
SE
|
|
CE
|
20200604
|
Sunny
|
Moderate
|
Mid-Ebb
|
Surface
|
1
|
9:15
|
8.41
|
8
|
31.19
|
26.75
|
4.71
|
2
|
<0.10
|
0.342
|
SE
|
|
CF
|
20200604
|
Sunny
|
Moderate
|
Mid-Ebb
|
Bottom
|
11.4
|
9:14
|
10.25
|
8.25
|
31.79
|
25.68
|
2.04
|
<2
|
<0.10
|
0.207
|
SE
|
|
CF
|
20200604
|
Sunny
|
Moderate
|
Mid-Ebb
|
Bottom
|
11.4
|
9:14
|
9.43
|
8.23
|
31.36
|
26.39
|
1.71
|
<2
|
<0.10
|
0.181
|
SE
|
|
CF
|
20200604
|
Sunny
|
Moderate
|
Mid-Ebb
|
Middle
|
6.2
|
9:15
|
9.25
|
8.25
|
31.18
|
26.31
|
1.02
|
<2
|
<0.10
|
0.166
|
SE
|
|
CF
|
20200604
|
Sunny
|
Moderate
|
Mid-Ebb
|
Middle
|
6.2
|
9:15
|
9.21
|
8.12
|
32.1
|
25.58
|
1.41
|
<2
|
<0.10
|
0.201
|
SE
|
|
CF
|
20200604
|
Sunny
|
Moderate
|
Mid-Ebb
|
Surface
|
1
|
9:16
|
9.09
|
8.02
|
32.48
|
25.71
|
1.82
|
2
|
<0.10
|
0.164
|
E
|
|
CF
|
20200604
|
Sunny
|
Moderate
|
Mid-Ebb
|
Surface
|
1
|
9:16
|
10.34
|
8.25
|
31.73
|
26.62
|
1.34
|
2
|
<0.10
|
0.148
|
E
|
|
NF1
|
20200604
|
Sunny
|
Moderate
|
Mid-Ebb
|
Bottom
|
15.5
|
9:42
|
11.3
|
8.08
|
33.78
|
24.44
|
4.27
|
2
|
<0.10
|
0.184
|
SE
|
|
NF1
|
20200604
|
Sunny
|
Moderate
|
Mid-Ebb
|
Bottom
|
15.5
|
9:42
|
10.59
|
8.07
|
33.77
|
24.45
|
4.18
|
2
|
<0.10
|
0.173
|
SE
|
|
NF1
|
20200604
|
Sunny
|
Moderate
|
Mid-Ebb
|
Middle
|
8.25
|
9:43
|
8.21
|
8.03
|
33.68
|
24.61
|
2.32
|
2
|
<0.10
|
0.202
|
SE
|
|
NF1
|
20200604
|
Sunny
|
Moderate
|
Mid-Ebb
|
Middle
|
8.25
|
9:43
|
7.89
|
8.05
|
33.64
|
24.63
|
2.5
|
2
|
<0.10
|
0.163
|
SE
|
|
NF1
|
20200604
|
Sunny
|
Moderate
|
Mid-Ebb
|
Surface
|
1
|
9:44
|
8.79
|
8.2
|
31.43
|
27.04
|
1.4
|
2
|
<0.10
|
0.17
|
E
|
|
NF1
|
20200604
|
Sunny
|
Moderate
|
Mid-Ebb
|
Surface
|
1
|
9:44
|
9.04
|
8.14
|
31.51
|
27.1
|
1.32
|
3
|
<0.10
|
0.179
|
SE
|
|
NF2
|
20200604
|
Sunny
|
Moderate
|
Mid-Ebb
|
Bottom
|
8.1
|
11:34
|
9.7
|
8.14
|
33.53
|
25.42
|
0.38
|
2
|
<0.10
|
0.171
|
SE
|
|
NF2
|
20200604
|
Sunny
|
Moderate
|
Mid-Ebb
|
Bottom
|
8.1
|
11:34
|
9.13
|
8.13
|
33.58
|
25.36
|
0.65
|
3
|
<0.10
|
0.215
|
SE
|
|
NF2
|
20200604
|
Sunny
|
Moderate
|
Mid-Ebb
|
Middle
|
4.55
|
11:35
|
9.53
|
8.21
|
32.82
|
25.98
|
0.89
|
2
|
<0.10
|
0.152
|
SE
|
|
NF2
|
20200604
|
Sunny
|
Moderate
|
Mid-Ebb
|
Middle
|
4.55
|
11:35
|
11.41
|
8.29
|
32.1
|
26.61
|
0.76
|
2
|
<0.10
|
0.155
|
E
|
|
NF2
|
20200604
|
Sunny
|
Moderate
|
Mid-Ebb
|
Surface
|
1
|
11:36
|
12.07
|
8.34
|
32.02
|
27.19
|
0.68
|
3
|
<0.10
|
0.167
|
E
|
|
NF2
|
20200604
|
Sunny
|
Moderate
|
Mid-Ebb
|
Surface
|
1
|
11:36
|
11.66
|
8.3
|
32
|
27.23
|
0.75
|
4
|
<0.10
|
0.131
|
SE
|
|
NF3
|
20200604
|
Sunny
|
Moderate
|
Mid-Ebb
|
Bottom
|
11.2
|
11:49
|
9.03
|
8.12
|
34.08
|
25.15
|
0.8
|
<2
|
<0.10
|
0.195
|
SE
|
|
NF3
|
20200604
|
Sunny
|
Moderate
|
Mid-Ebb
|
Bottom
|
11.2
|
11:49
|
8.56
|
8.12
|
34.1
|
25.11
|
0.65
|
<2
|
<0.10
|
0.193
|
E
|
|
NF3
|
20200604
|
Sunny
|
Moderate
|
Mid-Ebb
|
Middle
|
6.1
|
11:50
|
11.89
|
8.16
|
33.04
|
26.13
|
0.57
|
3
|
<0.10
|
0.205
|
SE
|
|
NF3
|
20200604
|
Sunny
|
Moderate
|
Mid-Ebb
|
Middle
|
6.1
|
11:50
|
9.78
|
8.12
|
33.6
|
25.55
|
0.72
|
3
|
<0.10
|
0.175
|
E
|
|
NF3
|
20200604
|
Sunny
|
Moderate
|
Mid-Ebb
|
Surface
|
1
|
11:51
|
11.45
|
8.33
|
32.22
|
27.34
|
0.95
|
3
|
<0.10
|
0.151
|
SE
|
|
NF3
|
20200604
|
Sunny
|
Moderate
|
Mid-Ebb
|
Surface
|
1
|
11:51
|
11.72
|
8.21
|
32.12
|
27.39
|
0.9
|
3
|
<0.10
|
0.151
|
E
|
|
WSR01
|
20200604
|
Sunny
|
Moderate
|
Mid-Ebb
|
Bottom
|
8
|
12:02
|
10.17
|
8.24
|
31.18
|
26.8
|
2.16
|
2
|
<0.10
|
0.219
|
SE
|
|
WSR01
|
20200604
|
Sunny
|
Moderate
|
Mid-Ebb
|
Bottom
|
8
|
12:02
|
9.65
|
8.32
|
31.42
|
25.44
|
1.98
|
2
|
<0.10
|
0.16
|
E
|
|
WSR01
|
20200604
|
Sunny
|
Moderate
|
Mid-Ebb
|
Middle
|
4.5
|
12:03
|
9.22
|
8.15
|
31.4
|
26.36
|
1.28
|
2
|
<0.10
|
0.13
|
E
|
|
WSR01
|
20200604
|
Sunny
|
Moderate
|
Mid-Ebb
|
Middle
|
4.5
|
12:03
|
9.09
|
8.3
|
31.38
|
26.76
|
1.62
|
3
|
<0.10
|
0.138
|
E
|
|
WSR01
|
20200604
|
Sunny
|
Moderate
|
Mid-Ebb
|
Surface
|
1
|
12:04
|
9.83
|
8.16
|
31.19
|
26.93
|
1.49
|
2
|
<0.10
|
0.19
|
SE
|
|
WSR01
|
20200604
|
Sunny
|
Moderate
|
Mid-Ebb
|
Surface
|
1
|
12:04
|
9.31
|
8.3
|
32.3
|
25.05
|
1.29
|
2
|
<0.10
|
0.18
|
SE
|
|
WSR02
|
20200604
|
Sunny
|
Moderate
|
Mid-Ebb
|
Bottom
|
8.3
|
11:39
|
9.8
|
8.02
|
31.7
|
26.18
|
1.72
|
5
|
<0.10
|
0.15
|
SE
|
|
WSR02
|
20200604
|
Sunny
|
Moderate
|
Mid-Ebb
|
Bottom
|
8.3
|
11:39
|
10.19
|
8.01
|
32.53
|
25.65
|
2.11
|
5
|
<0.10
|
0.168
|
E
|
|
WSR02
|
20200604
|
Sunny
|
Moderate
|
Mid-Ebb
|
Middle
|
4.65
|
11:40
|
9.5
|
8.25
|
31.36
|
26.58
|
1.39
|
5
|
<0.10
|
0.18
|
E
|
|
WSR02
|
20200604
|
Sunny
|
Moderate
|
Mid-Ebb
|
Middle
|
4.65
|
11:40
|
8.38
|
8.34
|
31.4
|
26.65
|
1.6
|
4
|
<0.10
|
0.205
|
SE
|
|
WSR02
|
20200604
|
Sunny
|
Moderate
|
Mid-Ebb
|
Surface
|
1
|
11:41
|
9.13
|
8.19
|
32.58
|
25.21
|
1.46
|
4
|
<0.10
|
0.189
|
E
|
|
WSR02
|
20200604
|
Sunny
|
Moderate
|
Mid-Ebb
|
Surface
|
1
|
11:41
|
10.31
|
8.11
|
32.56
|
26.48
|
1.53
|
4
|
<0.10
|
0.134
|
SE
|
|
WSR03
|
20200604
|
Sunny
|
Moderate
|
Mid-Ebb
|
Bottom
|
8.7
|
11:06
|
8.36
|
8.1
|
34
|
25.06
|
3.24
|
4
|
<0.10
|
0.162
|
SE
|
|
WSR03
|
20200604
|
Sunny
|
Moderate
|
Mid-Ebb
|
Bottom
|
8.7
|
11:06
|
8.08
|
8.1
|
33.94
|
25.11
|
0.8
|
3
|
<0.10
|
0.175
|
SE
|
|
WSR03
|
20200604
|
Sunny
|
Moderate
|
Mid-Ebb
|
Middle
|
4.85
|
11:07
|
9.19
|
8.19
|
33.23
|
25.82
|
0.91
|
3
|
<0.10
|
0.213
|
SE
|
|
WSR03
|
20200604
|
Sunny
|
Moderate
|
Mid-Ebb
|
Middle
|
4.85
|
11:07
|
9.66
|
8.22
|
33.13
|
25.92
|
0.63
|
2
|
<0.10
|
0.167
|
SE
|
|
WSR03
|
20200604
|
Sunny
|
Moderate
|
Mid-Ebb
|
Surface
|
1
|
11:08
|
9.24
|
8.27
|
32.06
|
27.03
|
1.37
|
3
|
<0.10
|
0.136
|
E
|
|
WSR03
|
20200604
|
Sunny
|
Moderate
|
Mid-Ebb
|
Surface
|
1
|
11:08
|
9.68
|
8.22
|
31.84
|
27.03
|
0.98
|
2
|
<0.10
|
0.176
|
SE
|
|
WSR04
|
20200604
|
Sunny
|
Moderate
|
Mid-Ebb
|
Bottom
|
7.5
|
10:50
|
8.67
|
8.1
|
34.18
|
25.16
|
2.62
|
3
|
<0.10
|
0.148
|
E
|
|
WSR04
|
20200604
|
Sunny
|
Moderate
|
Mid-Ebb
|
Bottom
|
7.5
|
10:50
|
8.28
|
8.1
|
34.22
|
25.01
|
2.19
|
3
|
<0.10
|
0.14
|
SE
|
|
WSR04
|
20200604
|
Sunny
|
Moderate
|
Mid-Ebb
|
Middle
|
4.25
|
10:51
|
9.52
|
8.2
|
32.87
|
26.41
|
1.53
|
3
|
<0.10
|
0.133
|
E
|
|
WSR04
|
20200604
|
Sunny
|
Moderate
|
Mid-Ebb
|
Middle
|
4.25
|
10:51
|
11.34
|
8.17
|
31.75
|
27.17
|
1.46
|
2
|
<0.10
|
0.148
|
E
|
|
WSR04
|
20200604
|
Sunny
|
Moderate
|
Mid-Ebb
|
Surface
|
1
|
10:52
|
10.8
|
8.28
|
31.9
|
27.28
|
1.32
|
3
|
<0.10
|
0.181
|
SE
|
|
WSR04
|
20200604
|
Sunny
|
Moderate
|
Mid-Ebb
|
Surface
|
1
|
10:52
|
10.21
|
8.19
|
31.85
|
27.38
|
2.06
|
3
|
<0.10
|
0.183
|
E
|
|
WSR16
|
20200604
|
Sunny
|
Moderate
|
Mid-Ebb
|
Bottom
|
10.9
|
12:27
|
9.2
|
8.32
|
32.29
|
25.37
|
2.04
|
2
|
<0.10
|
0.202
|
SE
|
|
WSR16
|
20200604
|
Sunny
|
Moderate
|
Mid-Ebb
|
Bottom
|
10.9
|
12:27
|
8.52
|
8.3
|
31.34
|
26.78
|
1.84
|
3
|
<0.10
|
0.206
|
SE
|
|
WSR16
|
20200604
|
Sunny
|
Moderate
|
Mid-Ebb
|
Middle
|
5.95
|
12:28
|
10.38
|
8.23
|
32.34
|
26.89
|
1.42
|
2
|
<0.10
|
0.218
|
SE
|
|
WSR16
|
20200604
|
Sunny
|
Moderate
|
Mid-Ebb
|
Middle
|
5.95
|
12:28
|
10.09
|
8.25
|
32.51
|
25.06
|
1.26
|
3
|
<0.10
|
0.228
|
E
|
|
WSR16
|
20200604
|
Sunny
|
Moderate
|
Mid-Ebb
|
Surface
|
1
|
12:29
|
10.32
|
8.02
|
32.19
|
26.85
|
1.6
|
<2
|
<0.10
|
0.149
|
E
|
|
WSR16
|
20200604
|
Sunny
|
Moderate
|
Mid-Ebb
|
Surface
|
1
|
12:29
|
8.67
|
8.23
|
31.24
|
25.35
|
1.4
|
<2
|
<0.10
|
0.175
|
SE
|
|
WSR33
|
20200604
|
Sunny
|
Moderate
|
Mid-Ebb
|
Bottom
|
8.6
|
10:29
|
8.99
|
8.12
|
33.33
|
25.52
|
4.46
|
4
|
<0.10
|
0.165
|
E
|
|
WSR33
|
20200604
|
Sunny
|
Moderate
|
Mid-Ebb
|
Bottom
|
8.6
|
10:29
|
8.18
|
8.12
|
33.52
|
25.27
|
1.56
|
4
|
<0.10
|
0.203
|
SE
|
|
WSR33
|
20200604
|
Sunny
|
Moderate
|
Mid-Ebb
|
Middle
|
4.8
|
10:30
|
10.97
|
8.16
|
32.06
|
26.59
|
0.84
|
4
|
<0.10
|
0.206
|
E
|
|
WSR33
|
20200604
|
Sunny
|
Moderate
|
Mid-Ebb
|
Middle
|
4.8
|
10:30
|
10.91
|
8.18
|
31.87
|
26.75
|
0.89
|
4
|
<0.10
|
0.152
|
SE
|
|
WSR33
|
20200604
|
Sunny
|
Moderate
|
Mid-Ebb
|
Surface
|
1
|
10:31
|
11.38
|
8.29
|
31.33
|
27.7
|
0.73
|
4
|
<0.10
|
0.215
|
E
|
|
WSR33
|
20200604
|
Sunny
|
Moderate
|
Mid-Ebb
|
Surface
|
1
|
10:31
|
11.44
|
8.22
|
31.25
|
28.01
|
0.69
|
4
|
<0.10
|
0.191
|
SE
|
|
WSR36
|
20200604
|
Sunny
|
Moderate
|
Mid-Ebb
|
Bottom
|
8
|
10:13
|
10.55
|
8.12
|
33.57
|
25.54
|
0.87
|
2
|
<0.10
|
0.157
|
E
|
|
WSR36
|
20200604
|
Sunny
|
Moderate
|
Mid-Ebb
|
Bottom
|
8
|
10:13
|
9.84
|
8.11
|
33.57
|
25.51
|
0.71
|
3
|
<0.10
|
0.211
|
E
|
|
WSR36
|
20200604
|
Sunny
|
Moderate
|
Mid-Ebb
|
Middle
|
4.5
|
10:14
|
9.94
|
8.13
|
32.44
|
25.73
|
0.89
|
3
|
<0.10
|
0.177
|
E
|
|
WSR36
|
20200604
|
Sunny
|
Moderate
|
Mid-Ebb
|
Middle
|
4.5
|
10:14
|
10.05
|
8.18
|
32.74
|
25.92
|
0.89
|
2
|
<0.10
|
0.183
|
SE
|
|
WSR36
|
20200604
|
Sunny
|
Moderate
|
Mid-Ebb
|
Surface
|
1
|
10:15
|
10.42
|
8.27
|
32.16
|
27.27
|
0.87
|
4
|
<0.10
|
0.201
|
E
|
|
WSR36
|
20200604
|
Sunny
|
Moderate
|
Mid-Ebb
|
Surface
|
1
|
10:15
|
10.08
|
8.23
|
32.08
|
27.32
|
0.84
|
3
|
<0.10
|
0.168
|
E
|
|
WSR37
|
20200604
|
Sunny
|
Moderate
|
Mid-Ebb
|
Bottom
|
3.6
|
9:59
|
8.89
|
8.11
|
32.57
|
26.09
|
1.28
|
2
|
<0.10
|
0.141
|
SE
|
|
WSR37
|
20200604
|
Sunny
|
Moderate
|
Mid-Ebb
|
Bottom
|
3.6
|
9:59
|
8.75
|
8.11
|
32.6
|
26.09
|
1.11
|
3
|
<0.10
|
0.175
|
E
|
|
WSR37
|
20200604
|
Sunny
|
Moderate
|
Mid-Ebb
|
Surface
|
1
|
10:01
|
9.8
|
8.23
|
31.5
|
27.22
|
0.98
|
2
|
<0.10
|
0.184
|
E
|
|
WSR37
|
20200604
|
Sunny
|
Moderate
|
Mid-Ebb
|
Surface
|
1
|
10:01
|
9.84
|
8.21
|
31.38
|
27.31
|
0.97
|
3
|
<0.10
|
0.202
|
SE
|
|
CE
|
20200604
|
Sunny
|
Moderate
|
Mid-Flood
|
Bottom
|
11.9
|
14:24
|
8.36
|
8.31
|
31.58
|
25.53
|
1.56
|
2
|
<0.10
|
0.184
|
NW
|
|
CE
|
20200604
|
Sunny
|
Moderate
|
Mid-Flood
|
Bottom
|
11.9
|
14:24
|
9.23
|
8.31
|
31.29
|
25.22
|
2.09
|
2
|
<0.10
|
0.163
|
NW
|
|
CE
|
20200604
|
Sunny
|
Moderate
|
Mid-Flood
|
Middle
|
6.45
|
14:25
|
9.24
|
8.2
|
31.69
|
25.74
|
1.28
|
2
|
<0.10
|
0.195
|
NW
|
|
CE
|
20200604
|
Sunny
|
Moderate
|
Mid-Flood
|
Middle
|
6.45
|
14:25
|
9.53
|
8.33
|
32.55
|
26.79
|
1.07
|
2
|
<0.10
|
0.196
|
NW
|
|
CE
|
20200604
|
Sunny
|
Moderate
|
Mid-Flood
|
Surface
|
1
|
14:26
|
9.18
|
8.12
|
31.85
|
25.82
|
1.14
|
2
|
<0.10
|
0.218
|
NW
|
|
CE
|
20200604
|
Sunny
|
Moderate
|
Mid-Flood
|
Surface
|
1
|
14:26
|
8.78
|
8.01
|
32.69
|
25.72
|
1.4
|
3
|
<0.10
|
0.18
|
N
|
|
CF
|
20200604
|
Sunny
|
Moderate
|
Mid-Flood
|
Bottom
|
11.8
|
14:21
|
8.44
|
8.05
|
31.78
|
25.67
|
1.96
|
<2
|
<0.10
|
0.178
|
W
|
|
CF
|
20200604
|
Sunny
|
Moderate
|
Mid-Flood
|
Bottom
|
11.8
|
14:21
|
8.64
|
8.12
|
31.82
|
25.42
|
1.5
|
<2
|
<0.10
|
0.163
|
W
|
|
CF
|
20200604
|
Sunny
|
Moderate
|
Mid-Flood
|
Middle
|
6.4
|
14:22
|
9.37
|
8.26
|
32.74
|
25.3
|
1.49
|
<2
|
<0.10
|
0.246
|
NW
|
|
CF
|
20200604
|
Sunny
|
Moderate
|
Mid-Flood
|
Middle
|
6.4
|
14:22
|
9.16
|
8.26
|
31.76
|
26.33
|
1.63
|
<2
|
<0.10
|
0.168
|
NW
|
|
CF
|
20200604
|
Sunny
|
Moderate
|
Mid-Flood
|
Surface
|
1
|
14:23
|
8.75
|
8.12
|
32.75
|
25.76
|
1.03
|
<2
|
<0.10
|
0.192
|
SW
|
|
CF
|
20200604
|
Sunny
|
Moderate
|
Mid-Flood
|
Surface
|
1
|
14:23
|
8.12
|
8.09
|
32.1
|
25.8
|
1.54
|
<2
|
<0.10
|
0.224
|
W
|
|
NF1
|
20200604
|
Sunny
|
Moderate
|
Mid-Flood
|
Bottom
|
9.5
|
15:03
|
8.82
|
8.16
|
31.68
|
25.68
|
2.09
|
2
|
<0.10
|
0.185
|
W
|
|
NF1
|
20200604
|
Sunny
|
Moderate
|
Mid-Flood
|
Bottom
|
9.5
|
15:03
|
9.26
|
8.01
|
32.21
|
25.77
|
1.48
|
2
|
<0.10
|
0.155
|
W
|
|
NF1
|
20200604
|
Sunny
|
Moderate
|
Mid-Flood
|
Middle
|
5.25
|
15:04
|
8.8
|
8.12
|
32.82
|
26.55
|
1.42
|
<2
|
<0.10
|
0.152
|
W
|
|
NF1
|
20200604
|
Sunny
|
Moderate
|
Mid-Flood
|
Middle
|
5.25
|
15:04
|
8.42
|
8.11
|
32.45
|
26.64
|
1.42
|
<2
|
<0.10
|
0.159
|
NW
|
|
NF1
|
20200604
|
Sunny
|
Moderate
|
Mid-Flood
|
Surface
|
1
|
15:05
|
8.35
|
8.34
|
32.13
|
25.89
|
0.95
|
<2
|
<0.10
|
0.176
|
W
|
|
NF1
|
20200604
|
Sunny
|
Moderate
|
Mid-Flood
|
Surface
|
1
|
15:05
|
8.75
|
8.25
|
31.73
|
25.29
|
1.18
|
<2
|
<0.10
|
0.155
|
NW
|
|
NF2
|
20200604
|
Sunny
|
Moderate
|
Mid-Flood
|
Bottom
|
8.1
|
16:36
|
8.75
|
8.11
|
31.22
|
25.52
|
1.49
|
<2
|
<0.10
|
0.196
|
W
|
|
NF2
|
20200604
|
Sunny
|
Moderate
|
Mid-Flood
|
Bottom
|
8.1
|
16:36
|
8.18
|
8.22
|
32.43
|
26.71
|
1.44
|
<2
|
<0.10
|
0.133
|
NW
|
|
NF2
|
20200604
|
Sunny
|
Moderate
|
Mid-Flood
|
Middle
|
4.55
|
16:37
|
8.37
|
8.16
|
32.51
|
26.35
|
1.6
|
<2
|
<0.10
|
0.138
|
SW
|
|
NF2
|
20200604
|
Sunny
|
Moderate
|
Mid-Flood
|
Middle
|
4.55
|
16:37
|
9.47
|
8.25
|
31.31
|
26.84
|
1.4
|
<2
|
<0.10
|
0.183
|
SW
|
|
NF2
|
20200604
|
Sunny
|
Moderate
|
Mid-Flood
|
Surface
|
1
|
16:38
|
8.33
|
8.14
|
31.49
|
25.85
|
1.09
|
<2
|
<0.10
|
0.183
|
SW
|
|
NF2
|
20200604
|
Sunny
|
Moderate
|
Mid-Flood
|
Surface
|
1
|
16:38
|
8.22
|
8.05
|
32.59
|
25.52
|
1.51
|
<2
|
<0.10
|
0.141
|
W
|
|
NF3
|
20200604
|
Sunny
|
Moderate
|
Mid-Flood
|
Bottom
|
9.8
|
16:45
|
8.42
|
8.12
|
31.28
|
26.07
|
1.43
|
<2
|
<0.10
|
0.155
|
W
|
|
NF3
|
20200604
|
Sunny
|
Moderate
|
Mid-Flood
|
Bottom
|
9.8
|
16:45
|
8.99
|
8.05
|
32.01
|
26.2
|
1.97
|
<2
|
<0.10
|
0.172
|
NW
|
|
NF3
|
20200604
|
Sunny
|
Moderate
|
Mid-Flood
|
Middle
|
5.4
|
16:46
|
8.58
|
8.11
|
31.48
|
25.65
|
1.09
|
3
|
<0.10
|
0.138
|
NW
|
|
NF3
|
20200604
|
Sunny
|
Moderate
|
Mid-Flood
|
Middle
|
5.4
|
16:46
|
8.64
|
8.27
|
31.81
|
26.82
|
1.49
|
2
|
<0.10
|
0.171
|
SW
|
|
NF3
|
20200604
|
Sunny
|
Moderate
|
Mid-Flood
|
Surface
|
1
|
16:47
|
8.2
|
8.19
|
31.89
|
26.07
|
1.58
|
2
|
<0.10
|
0.171
|
W
|
|
NF3
|
20200604
|
Sunny
|
Moderate
|
Mid-Flood
|
Surface
|
1
|
16:47
|
9.21
|
8.13
|
31.63
|
25.9
|
0.83
|
3
|
<0.10
|
0.168
|
SW
|
|
WSR01
|
20200604
|
Sunny
|
Moderate
|
Mid-Flood
|
Bottom
|
8.2
|
17:04
|
8.52
|
8.33
|
31.65
|
25.88
|
1.41
|
2
|
<0.10
|
0.194
|
W
|
|
WSR01
|
20200604
|
Sunny
|
Moderate
|
Mid-Flood
|
Bottom
|
8.2
|
17:04
|
8.19
|
8.09
|
31.67
|
26
|
1.59
|
2
|
<0.10
|
0.174
|
SW
|
|
WSR01
|
20200604
|
Sunny
|
Moderate
|
Mid-Flood
|
Middle
|
4.6
|
17:05
|
8.37
|
8.3
|
31.19
|
25.99
|
1.46
|
2
|
<0.10
|
0.155
|
NW
|
|
WSR01
|
20200604
|
Sunny
|
Moderate
|
Mid-Flood
|
Middle
|
4.6
|
17:05
|
9.4
|
8.26
|
31.72
|
26.33
|
1.34
|
2
|
<0.10
|
0.144
|
W
|
|
WSR01
|
20200604
|
Sunny
|
Moderate
|
Mid-Flood
|
Surface
|
1
|
17:06
|
8.5
|
8.02
|
32.05
|
25.95
|
1.66
|
<2
|
<0.10
|
0.142
|
SW
|
|
WSR01
|
20200604
|
Sunny
|
Moderate
|
Mid-Flood
|
Surface
|
1
|
17:06
|
8.9
|
8.11
|
32
|
26.64
|
0.84
|
<2
|
<0.10
|
0.155
|
W
|
|
WSR02
|
20200604
|
Sunny
|
Moderate
|
Mid-Flood
|
Bottom
|
8.4
|
16:40
|
9.06
|
8.24
|
32.44
|
25.55
|
1.68
|
<2
|
<0.10
|
0.162
|
W
|
|
WSR02
|
20200604
|
Sunny
|
Moderate
|
Mid-Flood
|
Bottom
|
8.4
|
16:40
|
8.55
|
8.26
|
31.32
|
25.76
|
1.82
|
<2
|
<0.10
|
0.148
|
W
|
|
WSR02
|
20200604
|
Sunny
|
Moderate
|
Mid-Flood
|
Middle
|
4.7
|
16:41
|
9.38
|
8.08
|
32.25
|
26.31
|
1.64
|
<2
|
<0.10
|
0.162
|
NW
|
|
WSR02
|
20200604
|
Sunny
|
Moderate
|
Mid-Flood
|
Middle
|
4.7
|
16:41
|
8.15
|
8.29
|
31.7
|
26.2
|
1.04
|
<2
|
<0.10
|
0.149
|
SW
|
|
WSR02
|
20200604
|
Sunny
|
Moderate
|
Mid-Flood
|
Surface
|
1
|
16:42
|
9.05
|
8.04
|
32.64
|
26.4
|
1.32
|
<2
|
<0.10
|
0.183
|
W
|
|
WSR02
|
20200604
|
Sunny
|
Moderate
|
Mid-Flood
|
Surface
|
1
|
16:42
|
9.19
|
8.06
|
31.44
|
25.17
|
1.33
|
<2
|
<0.10
|
0.156
|
SW
|
|
WSR03
|
20200604
|
Sunny
|
Moderate
|
Mid-Flood
|
Bottom
|
7.4
|
16:19
|
9.05
|
8.18
|
32.44
|
25.92
|
1.89
|
<2
|
<0.10
|
0.15
|
NW
|
|
WSR03
|
20200604
|
Sunny
|
Moderate
|
Mid-Flood
|
Bottom
|
7.4
|
16:19
|
8.45
|
8.23
|
31.59
|
26.7
|
1.97
|
<2
|
<0.10
|
0.159
|
W
|
|
WSR03
|
20200604
|
Sunny
|
Moderate
|
Mid-Flood
|
Middle
|
4.2
|
16:20
|
8.3
|
8.33
|
32.68
|
25.93
|
1.29
|
<2
|
<0.10
|
0.159
|
SW
|
|
WSR03
|
20200604
|
Sunny
|
Moderate
|
Mid-Flood
|
Middle
|
4.2
|
16:20
|
8.74
|
8.13
|
31.48
|
25.93
|
1.15
|
<2
|
<0.10
|
0.128
|
W
|
|
WSR03
|
20200604
|
Sunny
|
Moderate
|
Mid-Flood
|
Surface
|
1
|
16:21
|
9.03
|
8.05
|
31.45
|
25.73
|
1.51
|
2
|
<0.10
|
0.169
|
NW
|
|
WSR03
|
20200604
|
Sunny
|
Moderate
|
Mid-Flood
|
Surface
|
1
|
16:21
|
8.28
|
8.07
|
32.1
|
25.25
|
0.97
|
3
|
<0.10
|
0.162
|
W
|
|
WSR04
|
20200604
|
Sunny
|
Moderate
|
Mid-Flood
|
Bottom
|
6.2
|
16:02
|
8.91
|
8.19
|
31.53
|
25.93
|
1.5
|
<2
|
<0.10
|
0.164
|
W
|
|
WSR04
|
20200604
|
Sunny
|
Moderate
|
Mid-Flood
|
Bottom
|
6.2
|
16:02
|
8.63
|
8.02
|
32.28
|
25.16
|
1.9
|
<2
|
<0.10
|
0.189
|
W
|
|
WSR04
|
20200604
|
Sunny
|
Moderate
|
Mid-Flood
|
Middle
|
3.6
|
16:03
|
8.38
|
8.14
|
32.21
|
25.07
|
1.02
|
2
|
<0.10
|
0.19
|
SW
|
|
WSR04
|
20200604
|
Sunny
|
Moderate
|
Mid-Flood
|
Middle
|
3.6
|
16:03
|
8.36
|
8.34
|
31.86
|
26.77
|
1.68
|
2
|
<0.10
|
0.163
|
SW
|
|
WSR04
|
20200604
|
Sunny
|
Moderate
|
Mid-Flood
|
Surface
|
1
|
16:04
|
8.82
|
8.16
|
32.73
|
26.14
|
1.07
|
2
|
<0.10
|
0.162
|
W
|
|
WSR04
|
20200604
|
Sunny
|
Moderate
|
Mid-Flood
|
Surface
|
1
|
16:04
|
9.18
|
8.33
|
31.84
|
26.67
|
0.84
|
2
|
<0.10
|
0.171
|
W
|
|
WSR16
|
20200604
|
Sunny
|
Moderate
|
Mid-Flood
|
Bottom
|
11.2
|
14:43
|
8.55
|
8.17
|
32.71
|
25.53
|
1.95
|
2
|
<0.10
|
0.165
|
N
|
|
WSR16
|
20200604
|
Sunny
|
Moderate
|
Mid-Flood
|
Bottom
|
11.2
|
14:43
|
9.06
|
8.15
|
31.78
|
25.09
|
2.13
|
2
|
<0.10
|
0.183
|
N
|
|
WSR16
|
20200604
|
Sunny
|
Moderate
|
Mid-Flood
|
Middle
|
6.1
|
14:44
|
9.54
|
8.24
|
31.47
|
25.97
|
1.56
|
2
|
<0.10
|
0.182
|
NW
|
|
WSR16
|
20200604
|
Sunny
|
Moderate
|
Mid-Flood
|
Middle
|
6.1
|
14:44
|
9.22
|
8.31
|
32.72
|
26.38
|
0.88
|
2
|
<0.10
|
0.222
|
NW
|
|
WSR16
|
20200604
|
Sunny
|
Moderate
|
Mid-Flood
|
Surface
|
1
|
14:45
|
9.54
|
8.18
|
32.47
|
26.91
|
1.48
|
<2
|
<0.10
|
0.213
|
N
|
|
WSR16
|
20200604
|
Sunny
|
Moderate
|
Mid-Flood
|
Surface
|
1
|
14:45
|
8.11
|
8.18
|
31.88
|
25.42
|
0.89
|
<2
|
<0.10
|
0.207
|
NW
|
|
WSR33
|
20200604
|
Sunny
|
Moderate
|
Mid-Flood
|
Bottom
|
6.7
|
15:45
|
8.43
|
8.13
|
31.7
|
25.39
|
1.57
|
<2
|
<0.10
|
0.158
|
W
|
|
WSR33
|
20200604
|
Sunny
|
Moderate
|
Mid-Flood
|
Bottom
|
6.7
|
15:45
|
9.12
|
8.03
|
32.17
|
25.46
|
1.41
|
<2
|
<0.10
|
0.15
|
W
|
|
WSR33
|
20200604
|
Sunny
|
Moderate
|
Mid-Flood
|
Middle
|
3.85
|
15:46
|
8.39
|
8.33
|
31.4
|
25.94
|
1.68
|
<2
|
<0.10
|
0.167
|
W
|
|
WSR33
|
20200604
|
Sunny
|
Moderate
|
Mid-Flood
|
Middle
|
3.85
|
15:46
|
9.43
|
8.14
|
32.69
|
26.3
|
1.2
|
<2
|
<0.10
|
0.19
|
W
|
|
WSR33
|
20200604
|
Sunny
|
Moderate
|
Mid-Flood
|
Surface
|
1
|
15:47
|
9.18
|
8.12
|
31.58
|
26.03
|
0.82
|
<2
|
<0.10
|
0.177
|
SW
|
|
WSR33
|
20200604
|
Sunny
|
Moderate
|
Mid-Flood
|
Surface
|
1
|
15:47
|
9.22
|
8.14
|
31.98
|
25.3
|
0.97
|
<2
|
<0.10
|
0.194
|
SW
|
|
WSR36
|
20200604
|
Sunny
|
Moderate
|
Mid-Flood
|
Bottom
|
4.3
|
15:32
|
8.75
|
8.31
|
31.95
|
25.28
|
1.72
|
<2
|
<0.10
|
0.18
|
W
|
|
WSR36
|
20200604
|
Sunny
|
Moderate
|
Mid-Flood
|
Bottom
|
4.3
|
15:32
|
8.77
|
8.24
|
32.63
|
25.28
|
1.85
|
<2
|
<0.10
|
0.142
|
W
|
|
WSR36
|
20200604
|
Sunny
|
Moderate
|
Mid-Flood
|
Surface
|
1
|
15:33
|
8.16
|
8.33
|
31.32
|
25.64
|
1.05
|
<2
|
<0.10
|
0.19
|
W
|
|
WSR36
|
20200604
|
Sunny
|
Moderate
|
Mid-Flood
|
Surface
|
1
|
15:33
|
9.04
|
8.16
|
31.99
|
26.93
|
1.59
|
<2
|
<0.10
|
0.16
|
W
|
|
WSR37
|
20200604
|
Sunny
|
Moderate
|
Mid-Flood
|
Bottom
|
6.7
|
15:15
|
8.82
|
8.33
|
32.76
|
25.34
|
1.72
|
<2
|
<0.10
|
0.196
|
W
|
|
WSR37
|
20200604
|
Sunny
|
Moderate
|
Mid-Flood
|
Bottom
|
6.7
|
15:15
|
8.49
|
8.31
|
31.34
|
26.12
|
1.6
|
<2
|
<0.10
|
0.196
|
W
|
|
WSR37
|
20200604
|
Sunny
|
Moderate
|
Mid-Flood
|
Middle
|
3.85
|
15:16
|
8.53
|
8.19
|
32.36
|
25.83
|
1.08
|
<2
|
<0.10
|
0.17
|
W
|
|
WSR37
|
20200604
|
Sunny
|
Moderate
|
Mid-Flood
|
Middle
|
3.85
|
15:16
|
8.97
|
8.15
|
31.74
|
26.38
|
1.06
|
<2
|
<0.10
|
0.16
|
W
|
|
WSR37
|
20200604
|
Sunny
|
Moderate
|
Mid-Flood
|
Surface
|
1
|
15:17
|
8.15
|
8.14
|
31.25
|
26.55
|
0.99
|
<2
|
<0.10
|
0.182
|
W
|
|
WSR37
|
20200604
|
Sunny
|
Moderate
|
Mid-Flood
|
Surface
|
1
|
15:17
|
9.01
|
8.01
|
31.92
|
25.93
|
1
|
<2
|
<0.10
|
0.16
|
W
|
|
CE
|
20200606
|
Rainy
|
Moderate
|
Mid-Ebb
|
Bottom
|
10.8
|
10:45
|
8.79
|
8.16
|
31
|
26.38
|
1.74
|
9
|
<0.10
|
0.381
|
SE
|
|
CE
|
20200606
|
Rainy
|
Moderate
|
Mid-Ebb
|
Bottom
|
10.8
|
10:45
|
8.99
|
8.04
|
30.66
|
26.43
|
1.38
|
8
|
<0.10
|
0.278
|
SE
|
|
CE
|
20200606
|
Rainy
|
Moderate
|
Mid-Ebb
|
Middle
|
5.9
|
10:46
|
9.59
|
8.08
|
31.16
|
25.99
|
1.24
|
9
|
<0.10
|
0.403
|
SE
|
|
CE
|
20200606
|
Rainy
|
Moderate
|
Mid-Ebb
|
Middle
|
5.9
|
10:46
|
9.61
|
8.24
|
31.53
|
25.45
|
0.91
|
8
|
<0.10
|
0.372
|
SE
|
|
CE
|
20200606
|
Rainy
|
Moderate
|
Mid-Ebb
|
Surface
|
1
|
10:47
|
9.12
|
8.13
|
31.18
|
25.72
|
1.14
|
9
|
<0.10
|
0.335
|
E
|
|
CE
|
20200606
|
Rainy
|
Moderate
|
Mid-Ebb
|
Surface
|
1
|
10:47
|
9.6
|
8.25
|
31.07
|
25.74
|
1
|
9
|
<0.10
|
0.341
|
SE
|
|
CF
|
20200606
|
Rainy
|
Moderate
|
Mid-Ebb
|
Bottom
|
11.1
|
10:50
|
9.78
|
8.1
|
31.78
|
26.34
|
1.67
|
11
|
<0.10
|
0.16
|
E
|
|
CF
|
20200606
|
Rainy
|
Moderate
|
Mid-Ebb
|
Bottom
|
11.1
|
10:50
|
9.26
|
8.12
|
31.62
|
26.22
|
1.9
|
10
|
<0.10
|
0.187
|
SE
|
|
CF
|
20200606
|
Rainy
|
Moderate
|
Mid-Ebb
|
Middle
|
6.05
|
10:51
|
8.46
|
8.12
|
31.22
|
25.56
|
1.28
|
10
|
<0.10
|
0.211
|
E
|
|
CF
|
20200606
|
Rainy
|
Moderate
|
Mid-Ebb
|
Middle
|
6.05
|
10:51
|
9.28
|
8.08
|
30.69
|
25.87
|
1.26
|
10
|
<0.10
|
0.192
|
E
|
|
CF
|
20200606
|
Rainy
|
Moderate
|
Mid-Ebb
|
Surface
|
1
|
10:52
|
9.33
|
8.1
|
31.12
|
26.15
|
1.03
|
10
|
<0.10
|
0.201
|
E
|
|
CF
|
20200606
|
Rainy
|
Moderate
|
Mid-Ebb
|
Surface
|
1
|
10:52
|
8.74
|
8.17
|
31
|
26.16
|
1.17
|
9
|
<0.10
|
0.161
|
E
|
|
NF1
|
20200606
|
Rainy
|
Moderate
|
Mid-Ebb
|
Bottom
|
9.5
|
11:28
|
9.57
|
8.15
|
31.63
|
25.61
|
1.85
|
6
|
<0.10
|
0.17
|
SE
|
|
NF1
|
20200606
|
Rainy
|
Moderate
|
Mid-Ebb
|
Bottom
|
9.5
|
11:28
|
9.02
|
8.06
|
31.83
|
25.62
|
1.44
|
7
|
<0.10
|
0.138
|
SE
|
|
NF1
|
20200606
|
Rainy
|
Moderate
|
Mid-Ebb
|
Middle
|
5.25
|
11:29
|
8.7
|
8.19
|
31.25
|
26.11
|
1.52
|
5
|
<0.10
|
0.159
|
SE
|
|
NF1
|
20200606
|
Rainy
|
Moderate
|
Mid-Ebb
|
Middle
|
5.25
|
11:29
|
9.54
|
8.06
|
31.05
|
25.49
|
1.25
|
5
|
<0.10
|
0.153
|
E
|
|
NF1
|
20200606
|
Rainy
|
Moderate
|
Mid-Ebb
|
Surface
|
1
|
11:30
|
9.16
|
8.13
|
30.4
|
26.32
|
1.05
|
5
|
<0.10
|
0.207
|
SE
|
|
NF1
|
20200606
|
Rainy
|
Moderate
|
Mid-Ebb
|
Surface
|
1
|
11:30
|
8.57
|
8.03
|
31.87
|
25.46
|
1.48
|
5
|
<0.10
|
0.216
|
E
|
|
NF2
|
20200606
|
Rainy
|
Moderate
|
Mid-Ebb
|
Bottom
|
7.9
|
13:02
|
9.12
|
8.13
|
30.56
|
26.09
|
1.59
|
6
|
<0.10
|
0.145
|
SE
|
|
NF2
|
20200606
|
Rainy
|
Moderate
|
Mid-Ebb
|
Bottom
|
7.9
|
13:02
|
9.34
|
8.12
|
30.54
|
26.21
|
1.53
|
4
|
<0.10
|
0.147
|
SE
|
|
NF2
|
20200606
|
Rainy
|
Moderate
|
Mid-Ebb
|
Middle
|
4.45
|
13:03
|
9.2
|
8.14
|
31.24
|
25.99
|
0.89
|
5
|
<0.10
|
0.211
|
SE
|
|
NF2
|
20200606
|
Rainy
|
Moderate
|
Mid-Ebb
|
Middle
|
4.45
|
13:03
|
9.07
|
8.06
|
31.81
|
25.69
|
1.27
|
6
|
<0.10
|
0.186
|
SE
|
|
NF2
|
20200606
|
Rainy
|
Moderate
|
Mid-Ebb
|
Surface
|
1
|
13:04
|
8.88
|
8.17
|
30.64
|
25.46
|
1.3
|
6
|
<0.10
|
0.195
|
SE
|
|
NF2
|
20200606
|
Rainy
|
Moderate
|
Mid-Ebb
|
Surface
|
1
|
13:04
|
9.75
|
8.08
|
31.16
|
25.92
|
1.06
|
5
|
<0.10
|
0.144
|
SE
|
|
NF3
|
20200606
|
Rainy
|
Moderate
|
Mid-Ebb
|
Bottom
|
9.5
|
13:13
|
8.79
|
8.16
|
31.42
|
26.16
|
1.84
|
7
|
<0.10
|
0.137
|
SE
|
|
NF3
|
20200606
|
Rainy
|
Moderate
|
Mid-Ebb
|
Bottom
|
9.5
|
13:13
|
8.91
|
8.24
|
31.62
|
25.89
|
1.62
|
6
|
<0.10
|
0.205
|
SE
|
|
NF3
|
20200606
|
Rainy
|
Moderate
|
Mid-Ebb
|
Middle
|
5.25
|
13:14
|
9.43
|
8.13
|
30.65
|
25.52
|
1.57
|
5
|
<0.10
|
0.221
|
E
|
|
NF3
|
20200606
|
Rainy
|
Moderate
|
Mid-Ebb
|
Middle
|
5.25
|
13:14
|
9.44
|
8.24
|
30.55
|
25.7
|
0.97
|
5
|
<0.10
|
0.188
|
E
|
|
NF3
|
20200606
|
Rainy
|
Moderate
|
Mid-Ebb
|
Surface
|
1
|
13:15
|
9.21
|
8.08
|
31.49
|
26.3
|
0.97
|
3
|
<0.10
|
0.182
|
SE
|
|
NF3
|
20200606
|
Rainy
|
Moderate
|
Mid-Ebb
|
Surface
|
1
|
13:15
|
9.24
|
8.25
|
31.27
|
26.24
|
1.39
|
4
|
<0.10
|
0.13
|
SE
|
|
WSR01
|
20200606
|
Rainy
|
Moderate
|
Mid-Ebb
|
Bottom
|
7.5
|
13:37
|
9.44
|
8.2
|
31.6
|
25.78
|
1.32
|
10
|
<0.10
|
0.168
|
SE
|
|
WSR01
|
20200606
|
Rainy
|
Moderate
|
Mid-Ebb
|
Bottom
|
7.5
|
13:37
|
8.51
|
8.07
|
30.99
|
25.95
|
1.3
|
11
|
<0.10
|
0.168
|
SE
|
|
WSR01
|
20200606
|
Rainy
|
Moderate
|
Mid-Ebb
|
Middle
|
4.25
|
13:38
|
9.08
|
8.19
|
31.18
|
25.88
|
1.39
|
10
|
<0.10
|
0.202
|
SE
|
|
WSR01
|
20200606
|
Rainy
|
Moderate
|
Mid-Ebb
|
Middle
|
4.25
|
13:38
|
8.65
|
8.05
|
30.95
|
25.71
|
1.27
|
10
|
<0.10
|
0.192
|
E
|
|
WSR01
|
20200606
|
Rainy
|
Moderate
|
Mid-Ebb
|
Surface
|
1
|
13:39
|
9.21
|
8.18
|
30.41
|
26.43
|
1.42
|
9
|
<0.10
|
0.154
|
E
|
|
WSR01
|
20200606
|
Rainy
|
Moderate
|
Mid-Ebb
|
Surface
|
1
|
13:39
|
9.64
|
8.18
|
30.66
|
25.56
|
1.56
|
9
|
<0.10
|
0.13
|
E
|
|
WSR02
|
20200606
|
Rainy
|
Moderate
|
Mid-Ebb
|
Bottom
|
8.1
|
13:14
|
9.58
|
8.2
|
31.59
|
26.41
|
1.54
|
9
|
<0.10
|
0.207
|
SE
|
|
WSR02
|
20200606
|
Rainy
|
Moderate
|
Mid-Ebb
|
Bottom
|
8.1
|
13:14
|
9.02
|
8.21
|
31.42
|
25.64
|
1.3
|
9
|
<0.10
|
0.133
|
SE
|
|
WSR02
|
20200606
|
Rainy
|
Moderate
|
Mid-Ebb
|
Middle
|
4.55
|
13:15
|
9.51
|
8.1
|
30.78
|
25.45
|
1.5
|
10
|
<0.10
|
0.144
|
SE
|
|
WSR02
|
20200606
|
Rainy
|
Moderate
|
Mid-Ebb
|
Middle
|
4.55
|
13:15
|
8.86
|
8.25
|
30.68
|
25.49
|
1.54
|
9
|
<0.10
|
0.13
|
E
|
|
WSR02
|
20200606
|
Rainy
|
Moderate
|
Mid-Ebb
|
Surface
|
1
|
13:16
|
8.48
|
8.2
|
31.63
|
25.9
|
1.36
|
11
|
<0.10
|
0.218
|
SE
|
|
WSR02
|
20200606
|
Rainy
|
Moderate
|
Mid-Ebb
|
Surface
|
1
|
13:16
|
9.75
|
8.16
|
31.52
|
25.92
|
0.96
|
11
|
<0.10
|
0.203
|
SE
|
|
WSR03
|
20200606
|
Rainy
|
Moderate
|
Mid-Ebb
|
Bottom
|
6.2
|
12:44
|
8.56
|
8.19
|
31.45
|
25.69
|
1.54
|
8
|
<0.10
|
0.22
|
SE
|
|
WSR03
|
20200606
|
Rainy
|
Moderate
|
Mid-Ebb
|
Bottom
|
6.2
|
12:44
|
9.1
|
8.16
|
31.53
|
26.43
|
1.54
|
9
|
<0.10
|
0.185
|
SE
|
|
WSR03
|
20200606
|
Rainy
|
Moderate
|
Mid-Ebb
|
Middle
|
3.6
|
12:45
|
9.68
|
8.18
|
31.05
|
25.71
|
1.44
|
8
|
<0.10
|
0.206
|
SE
|
|
WSR03
|
20200606
|
Rainy
|
Moderate
|
Mid-Ebb
|
Middle
|
3.6
|
12:45
|
8.77
|
8.18
|
31.45
|
25.53
|
1.59
|
9
|
<0.10
|
0.213
|
E
|
|
WSR03
|
20200606
|
Rainy
|
Moderate
|
Mid-Ebb
|
Surface
|
1
|
12:46
|
9.18
|
8.03
|
30.64
|
25.46
|
0.85
|
8
|
<0.10
|
0.212
|
E
|
|
WSR03
|
20200606
|
Rainy
|
Moderate
|
Mid-Ebb
|
Surface
|
1
|
12:46
|
9
|
8.14
|
30.79
|
25.51
|
1.6
|
9
|
<0.10
|
0.198
|
SE
|
|
WSR04
|
20200606
|
Rainy
|
Moderate
|
Mid-Ebb
|
Bottom
|
5.5
|
12:26
|
9.52
|
8.14
|
31.36
|
26.33
|
1.82
|
8
|
<0.10
|
0.149
|
SE
|
|
WSR04
|
20200606
|
Rainy
|
Moderate
|
Mid-Ebb
|
Bottom
|
5.5
|
12:26
|
8.68
|
8.19
|
31.8
|
25.77
|
1.51
|
8
|
<0.10
|
0.138
|
SE
|
|
WSR04
|
20200606
|
Rainy
|
Moderate
|
Mid-Ebb
|
Middle
|
3.25
|
12:27
|
9.17
|
8.07
|
30.97
|
25.54
|
1.5
|
8
|
<0.10
|
0.169
|
E
|
|
WSR04
|
20200606
|
Rainy
|
Moderate
|
Mid-Ebb
|
Middle
|
3.25
|
12:27
|
8.83
|
8.14
|
31.72
|
26.35
|
1.64
|
8
|
<0.10
|
0.163
|
E
|
|
WSR04
|
20200606
|
Rainy
|
Moderate
|
Mid-Ebb
|
Surface
|
1
|
12:28
|
9.35
|
8.16
|
30.58
|
25.77
|
1.48
|
9
|
<0.10
|
0.139
|
E
|
|
WSR04
|
20200606
|
Rainy
|
Moderate
|
Mid-Ebb
|
Surface
|
1
|
12:28
|
8.99
|
8.19
|
31.88
|
26.26
|
1.54
|
9
|
<0.10
|
0.163
|
SE
|
|
WSR16
|
20200606
|
Rainy
|
Moderate
|
Mid-Ebb
|
Bottom
|
11
|
11:07
|
8.71
|
8.09
|
31.05
|
26.11
|
1.62
|
7
|
<0.10
|
0.231
|
SE
|
|
WSR16
|
20200606
|
Rainy
|
Moderate
|
Mid-Ebb
|
Bottom
|
11
|
11:07
|
8.6
|
8.13
|
31.27
|
25.84
|
1.36
|
7
|
<0.10
|
0.193
|
SE
|
|
WSR16
|
20200606
|
Rainy
|
Moderate
|
Mid-Ebb
|
Middle
|
6
|
11:08
|
9.19
|
8.17
|
31.19
|
26.27
|
1.56
|
9
|
<0.10
|
0.224
|
SE
|
|
WSR16
|
20200606
|
Rainy
|
Moderate
|
Mid-Ebb
|
Middle
|
6
|
11:08
|
9.68
|
8.08
|
30.6
|
25.79
|
1
|
8
|
<0.10
|
0.226
|
E
|
|
WSR16
|
20200606
|
Rainy
|
Moderate
|
Mid-Ebb
|
Surface
|
1
|
11:09
|
9.06
|
8.12
|
31.69
|
25.55
|
1.19
|
8
|
<0.10
|
0.205
|
E
|
|
WSR16
|
20200606
|
Rainy
|
Moderate
|
Mid-Ebb
|
Surface
|
1
|
11:09
|
8.7
|
8.04
|
30.56
|
25.81
|
1.12
|
9
|
<0.10
|
0.217
|
E
|
|
WSR33
|
20200606
|
Rainy
|
Moderate
|
Mid-Ebb
|
Bottom
|
6.3
|
12:08
|
8.69
|
8.09
|
30.4
|
26.37
|
1.94
|
8
|
<0.10
|
0.193
|
E
|
|
WSR33
|
20200606
|
Rainy
|
Moderate
|
Mid-Ebb
|
Bottom
|
6.3
|
12:08
|
9.17
|
8.15
|
30.75
|
25.85
|
1.89
|
7
|
<0.10
|
0.197
|
E
|
|
WSR33
|
20200606
|
Rainy
|
Moderate
|
Mid-Ebb
|
Middle
|
3.65
|
12:09
|
9.58
|
8.04
|
31.58
|
25.53
|
1.19
|
9
|
<0.10
|
0.132
|
E
|
|
WSR33
|
20200606
|
Rainy
|
Moderate
|
Mid-Ebb
|
Middle
|
3.65
|
12:09
|
9.26
|
8.14
|
31.16
|
25.73
|
1.28
|
8
|
<0.10
|
0.15
|
SE
|
|
WSR33
|
20200606
|
Rainy
|
Moderate
|
Mid-Ebb
|
Surface
|
1
|
12:10
|
9.73
|
8.12
|
30.54
|
25.65
|
0.94
|
9
|
<0.10
|
0.209
|
E
|
|
WSR33
|
20200606
|
Rainy
|
Moderate
|
Mid-Ebb
|
Surface
|
1
|
12:10
|
8.86
|
8.09
|
30.98
|
25.76
|
1.03
|
8
|
<0.10
|
0.144
|
SE
|
|
WSR36
|
20200606
|
Rainy
|
Moderate
|
Mid-Ebb
|
Bottom
|
4.6
|
11:56
|
9.07
|
8.08
|
31.18
|
25.78
|
1.94
|
7
|
<0.10
|
0.149
|
E
|
|
WSR36
|
20200606
|
Rainy
|
Moderate
|
Mid-Ebb
|
Bottom
|
4.6
|
11:56
|
8.59
|
8.25
|
30.79
|
26.33
|
1.52
|
7
|
<0.10
|
0.199
|
E
|
|
WSR36
|
20200606
|
Rainy
|
Moderate
|
Mid-Ebb
|
Surface
|
1
|
11:57
|
9.25
|
8.24
|
31.62
|
25.96
|
0.95
|
6
|
<0.10
|
0.165
|
SE
|
|
WSR36
|
20200606
|
Rainy
|
Moderate
|
Mid-Ebb
|
Surface
|
1
|
11:57
|
8.44
|
8.25
|
30.64
|
25.81
|
1.14
|
6
|
<0.10
|
0.183
|
SE
|
|
WSR37
|
20200606
|
Rainy
|
Moderate
|
Mid-Ebb
|
Bottom
|
6.6
|
11:39
|
9.59
|
8.16
|
31.36
|
25.67
|
1.39
|
7
|
<0.10
|
0.177
|
SE
|
|
WSR37
|
20200606
|
Rainy
|
Moderate
|
Mid-Ebb
|
Bottom
|
6.6
|
11:39
|
9.05
|
8.13
|
30.59
|
25.86
|
1.48
|
7
|
<0.10
|
0.167
|
E
|
|
WSR37
|
20200606
|
Rainy
|
Moderate
|
Mid-Ebb
|
Middle
|
3.8
|
11:40
|
9.73
|
8.21
|
30.77
|
25.87
|
1.47
|
5
|
<0.10
|
0.171
|
SE
|
|
WSR37
|
20200606
|
Rainy
|
Moderate
|
Mid-Ebb
|
Middle
|
3.8
|
11:40
|
8.57
|
8.08
|
31.58
|
25.6
|
1.55
|
6
|
<0.10
|
0.21
|
SE
|
|
WSR37
|
20200606
|
Rainy
|
Moderate
|
Mid-Ebb
|
Surface
|
1
|
11:41
|
8.93
|
8.05
|
30.75
|
25.95
|
1.14
|
5
|
<0.10
|
0.173
|
E
|
|
WSR37
|
20200606
|
Rainy
|
Moderate
|
Mid-Ebb
|
Surface
|
1
|
11:41
|
9.38
|
8.06
|
31.28
|
26.44
|
1.03
|
5
|
<0.10
|
0.138
|
SE
|
|
CE
|
20200606
|
Rainy
|
Moderate
|
Mid-Flood
|
Bottom
|
11.2
|
16:01
|
9.29
|
8.21
|
30.91
|
27.83
|
1.39
|
12
|
<0.10
|
0.16
|
NW
|
|
CE
|
20200606
|
Rainy
|
Moderate
|
Mid-Flood
|
Bottom
|
11.2
|
16:01
|
8.91
|
8.29
|
31.67
|
27.54
|
1.41
|
13
|
<0.10
|
0.189
|
NW
|
|
CE
|
20200606
|
Rainy
|
Moderate
|
Mid-Flood
|
Middle
|
6.1
|
16:02
|
9.61
|
8.2
|
30.55
|
27.15
|
1.49
|
12
|
<0.10
|
0.159
|
NW
|
|
CE
|
20200606
|
Rainy
|
Moderate
|
Mid-Flood
|
Middle
|
6.1
|
16:02
|
9.45
|
8.17
|
31.53
|
27.67
|
1.22
|
13
|
<0.10
|
0.213
|
N
|
|
CE
|
20200606
|
Rainy
|
Moderate
|
Mid-Flood
|
Surface
|
1
|
16:03
|
9.36
|
8.27
|
31.29
|
27.7
|
1.47
|
11
|
<0.10
|
0.216
|
NW
|
|
CE
|
20200606
|
Rainy
|
Moderate
|
Mid-Flood
|
Surface
|
1
|
16:03
|
9.02
|
8.21
|
31.09
|
27.19
|
1.38
|
10
|
<0.10
|
0.166
|
NW
|
|
CF
|
20200606
|
Rainy
|
Moderate
|
Mid-Flood
|
Bottom
|
11.4
|
16:00
|
9.07
|
8.24
|
31.2
|
27.58
|
1.49
|
11
|
<0.10
|
0.231
|
W
|
|
CF
|
20200606
|
Rainy
|
Moderate
|
Mid-Flood
|
Bottom
|
11.4
|
16:00
|
9.41
|
8.17
|
30.69
|
27.87
|
1.87
|
12
|
<0.10
|
0.181
|
NW
|
|
CF
|
20200606
|
Rainy
|
Moderate
|
Mid-Flood
|
Middle
|
6.2
|
16:01
|
9.44
|
8.08
|
30.65
|
27.84
|
1.52
|
12
|
<0.10
|
0.181
|
W
|
|
CF
|
20200606
|
Rainy
|
Moderate
|
Mid-Flood
|
Middle
|
6.2
|
16:01
|
8.65
|
8.31
|
31.74
|
27.4
|
1.32
|
11
|
<0.10
|
0.185
|
SW
|
|
CF
|
20200606
|
Rainy
|
Moderate
|
Mid-Flood
|
Surface
|
1
|
16:02
|
8.98
|
8.32
|
30.96
|
27.21
|
1.06
|
10
|
<0.10
|
0.222
|
W
|
|
CF
|
20200606
|
Rainy
|
Moderate
|
Mid-Flood
|
Surface
|
1
|
16:02
|
9.06
|
8.21
|
30.51
|
27.47
|
0.91
|
10
|
<0.10
|
0.167
|
W
|
|
NF1
|
20200606
|
Rainy
|
Moderate
|
Mid-Flood
|
Bottom
|
10.4
|
16:44
|
8.74
|
8.11
|
31.31
|
27.24
|
1.37
|
9
|
<0.10
|
0.18
|
W
|
|
NF1
|
20200606
|
Rainy
|
Moderate
|
Mid-Flood
|
Bottom
|
10.4
|
16:44
|
9.24
|
8.15
|
31.27
|
27.57
|
1.35
|
8
|
<0.10
|
0.167
|
W
|
|
NF1
|
20200606
|
Rainy
|
Moderate
|
Mid-Flood
|
Middle
|
5.7
|
16:45
|
8.53
|
8.08
|
31.12
|
27.23
|
1.08
|
11
|
<0.10
|
0.166
|
W
|
|
NF1
|
20200606
|
Rainy
|
Moderate
|
Mid-Flood
|
Middle
|
5.7
|
16:45
|
9.36
|
8.07
|
31.8
|
27.26
|
1.19
|
10
|
<0.10
|
0.186
|
W
|
|
NF1
|
20200606
|
Rainy
|
Moderate
|
Mid-Flood
|
Surface
|
1
|
16:46
|
8.74
|
8.14
|
31.63
|
27.49
|
1.38
|
10
|
<0.10
|
0.131
|
W
|
|
NF1
|
20200606
|
Rainy
|
Moderate
|
Mid-Flood
|
Surface
|
1
|
16:46
|
9.39
|
8.09
|
30.97
|
27.21
|
1.03
|
11
|
<0.10
|
0.188
|
W
|
|
NF2
|
20200606
|
Rainy
|
Moderate
|
Mid-Flood
|
Bottom
|
9.6
|
18:18
|
8.8
|
8.29
|
30.55
|
27.36
|
1.99
|
10
|
<0.10
|
0.171
|
SW
|
|
NF2
|
20200606
|
Rainy
|
Moderate
|
Mid-Flood
|
Bottom
|
9.6
|
18:18
|
9.86
|
8.3
|
31.44
|
27.62
|
1.35
|
9
|
<0.10
|
0.166
|
NW
|
|
NF2
|
20200606
|
Rainy
|
Moderate
|
Mid-Flood
|
Middle
|
5.3
|
18:19
|
9.91
|
8.24
|
31.82
|
27.59
|
1.49
|
9
|
<0.10
|
0.18
|
SW
|
|
NF2
|
20200606
|
Rainy
|
Moderate
|
Mid-Flood
|
Middle
|
5.3
|
18:19
|
10.08
|
8.15
|
31.67
|
27.67
|
1.39
|
9
|
<0.10
|
0.157
|
W
|
|
NF2
|
20200606
|
Rainy
|
Moderate
|
Mid-Flood
|
Surface
|
1
|
18:20
|
10.11
|
8.32
|
31.5
|
27.52
|
0.82
|
8
|
<0.10
|
0.192
|
SW
|
|
NF2
|
20200606
|
Rainy
|
Moderate
|
Mid-Flood
|
Surface
|
1
|
18:20
|
9.68
|
8.23
|
31.25
|
27.17
|
1.43
|
9
|
<0.10
|
0.183
|
NW
|
|
NF3
|
20200606
|
Rainy
|
Moderate
|
Mid-Flood
|
Bottom
|
10.1
|
18:27
|
8.93
|
8.17
|
31.57
|
27.73
|
1.74
|
10
|
<0.10
|
0.161
|
W
|
|
NF3
|
20200606
|
Rainy
|
Moderate
|
Mid-Flood
|
Bottom
|
10.1
|
18:27
|
8.52
|
8.29
|
31.34
|
27.5
|
1.54
|
10
|
<0.10
|
0.193
|
W
|
|
NF3
|
20200606
|
Rainy
|
Moderate
|
Mid-Flood
|
Middle
|
5.55
|
18:28
|
9.27
|
8.07
|
31.03
|
27.26
|
1.08
|
8
|
<0.10
|
0.154
|
W
|
|
NF3
|
20200606
|
Rainy
|
Moderate
|
Mid-Flood
|
Middle
|
5.55
|
18:28
|
8.8
|
8.2
|
31.2
|
27.63
|
0.96
|
9
|
<0.10
|
0.158
|
W
|
|
NF3
|
20200606
|
Rainy
|
Moderate
|
Mid-Flood
|
Surface
|
1
|
18:29
|
10.11
|
8.32
|
31.29
|
27.87
|
1.2
|
8
|
<0.10
|
0.168
|
W
|
|
NF3
|
20200606
|
Rainy
|
Moderate
|
Mid-Flood
|
Surface
|
1
|
18:29
|
9.4
|
8.3
|
30.5
|
27.14
|
1
|
8
|
<0.10
|
0.131
|
W
|
|
WSR01
|
20200606
|
Rainy
|
Moderate
|
Mid-Flood
|
Bottom
|
7.9
|
18:51
|
9.15
|
8.2
|
30.87
|
27.35
|
2.06
|
12
|
<0.10
|
0.185
|
NW
|
|
WSR01
|
20200606
|
Rainy
|
Moderate
|
Mid-Flood
|
Bottom
|
7.9
|
18:51
|
8.78
|
8.24
|
31.75
|
27.82
|
1.78
|
13
|
<0.10
|
0.149
|
SW
|
|
WSR01
|
20200606
|
Rainy
|
Moderate
|
Mid-Flood
|
Middle
|
4.45
|
18:52
|
9.55
|
8.1
|
31.36
|
27.23
|
1.1
|
12
|
<0.10
|
0.178
|
W
|
|
WSR01
|
20200606
|
Rainy
|
Moderate
|
Mid-Flood
|
Middle
|
4.45
|
18:52
|
9.84
|
8.21
|
31.62
|
27.33
|
1.27
|
11
|
<0.10
|
0.182
|
W
|
|
WSR01
|
20200606
|
Rainy
|
Moderate
|
Mid-Flood
|
Surface
|
1
|
18:53
|
9.5
|
8.25
|
30.79
|
27.7
|
1.32
|
10
|
<0.10
|
0.144
|
NW
|
|
WSR01
|
20200606
|
Rainy
|
Moderate
|
Mid-Flood
|
Surface
|
1
|
18:53
|
8.65
|
8.27
|
31.31
|
27.26
|
1.22
|
11
|
<0.10
|
0.139
|
W
|
|
WSR02
|
20200606
|
Rainy
|
Moderate
|
Mid-Flood
|
Bottom
|
8.7
|
18:28
|
9.33
|
8.21
|
31.82
|
27.56
|
1.41
|
11
|
<0.10
|
0.161
|
W
|
|
WSR02
|
20200606
|
Rainy
|
Moderate
|
Mid-Flood
|
Bottom
|
8.7
|
18:28
|
8.58
|
8.28
|
31.72
|
27.78
|
1.4
|
10
|
<0.10
|
0.177
|
W
|
|
WSR02
|
20200606
|
Rainy
|
Moderate
|
Mid-Flood
|
Middle
|
4.85
|
18:29
|
9.2
|
8.27
|
31.38
|
27.8
|
1.03
|
12
|
<0.10
|
0.193
|
W
|
|
WSR02
|
20200606
|
Rainy
|
Moderate
|
Mid-Flood
|
Middle
|
4.85
|
18:29
|
9.16
|
8.27
|
30.56
|
27.28
|
0.97
|
11
|
<0.10
|
0.152
|
W
|
|
WSR02
|
20200606
|
Rainy
|
Moderate
|
Mid-Flood
|
Surface
|
1
|
18:30
|
9.51
|
8.08
|
31.31
|
27.16
|
0.94
|
12
|
<0.10
|
0.162
|
W
|
|
WSR02
|
20200606
|
Rainy
|
Moderate
|
Mid-Flood
|
Surface
|
1
|
18:30
|
9.16
|
8.07
|
31.53
|
27.75
|
1.45
|
12
|
<0.10
|
0.162
|
W
|
|
WSR03
|
20200606
|
Rainy
|
Moderate
|
Mid-Flood
|
Bottom
|
7.5
|
18:02
|
9.9
|
8.25
|
31.12
|
27.66
|
1.69
|
14
|
<0.10
|
0.166
|
SW
|
|
WSR03
|
20200606
|
Rainy
|
Moderate
|
Mid-Flood
|
Bottom
|
7.5
|
18:02
|
8.58
|
8.19
|
31.24
|
27.58
|
1.6
|
14
|
<0.10
|
0.185
|
W
|
|
WSR03
|
20200606
|
Rainy
|
Moderate
|
Mid-Flood
|
Middle
|
4.25
|
18:03
|
9.62
|
8.2
|
31.76
|
27.7
|
1.16
|
13
|
<0.10
|
0.159
|
NW
|
|
WSR03
|
20200606
|
Rainy
|
Moderate
|
Mid-Flood
|
Middle
|
4.25
|
18:03
|
8.53
|
8.16
|
30.52
|
27.14
|
0.99
|
12
|
<0.10
|
0.134
|
W
|
|
WSR03
|
20200606
|
Rainy
|
Moderate
|
Mid-Flood
|
Surface
|
1
|
18:04
|
9.86
|
8.27
|
31.77
|
27.38
|
0.76
|
11
|
<0.10
|
0.135
|
W
|
|
WSR03
|
20200606
|
Rainy
|
Moderate
|
Mid-Flood
|
Surface
|
1
|
18:04
|
8.71
|
8.27
|
30.5
|
27.7
|
0.97
|
11
|
<0.10
|
0.191
|
W
|
|
WSR04
|
20200606
|
Rainy
|
Moderate
|
Mid-Flood
|
Bottom
|
6.7
|
17:44
|
9.95
|
8.19
|
30.97
|
27.66
|
1.43
|
14
|
<0.10
|
0.14
|
NW
|
|
WSR04
|
20200606
|
Rainy
|
Moderate
|
Mid-Flood
|
Bottom
|
6.7
|
17:44
|
9.08
|
8.14
|
31.54
|
27.62
|
1.96
|
13
|
<0.10
|
0.157
|
W
|
|
WSR04
|
20200606
|
Rainy
|
Moderate
|
Mid-Flood
|
Middle
|
3.85
|
17:45
|
10.06
|
8.07
|
30.49
|
27.29
|
1.33
|
13
|
<0.10
|
0.158
|
SW
|
|
WSR04
|
20200606
|
Rainy
|
Moderate
|
Mid-Flood
|
Middle
|
3.85
|
17:45
|
9.13
|
8.18
|
30.72
|
27.63
|
1.46
|
14
|
<0.10
|
0.189
|
W
|
|
WSR04
|
20200606
|
Rainy
|
Moderate
|
Mid-Flood
|
Surface
|
1
|
17:46
|
9.41
|
8.31
|
30.75
|
27.29
|
1.3
|
12
|
<0.10
|
0.182
|
NW
|
|
WSR04
|
20200606
|
Rainy
|
Moderate
|
Mid-Flood
|
Surface
|
1
|
17:46
|
9.36
|
8.28
|
30.83
|
27.15
|
0.76
|
11
|
<0.10
|
0.145
|
W
|
|
WSR16
|
20200606
|
Rainy
|
Moderate
|
Mid-Flood
|
Bottom
|
10.8
|
16:23
|
8.74
|
8.17
|
31.31
|
27.64
|
1.61
|
10
|
<0.10
|
0.162
|
NW
|
|
WSR16
|
20200606
|
Rainy
|
Moderate
|
Mid-Flood
|
Bottom
|
10.8
|
16:23
|
9.76
|
8.11
|
30.83
|
27.22
|
1.73
|
9
|
<0.10
|
0.177
|
NW
|
|
WSR16
|
20200606
|
Rainy
|
Moderate
|
Mid-Flood
|
Middle
|
5.9
|
16:24
|
9
|
8.31
|
30.72
|
27.21
|
1
|
10
|
<0.10
|
0.192
|
NW
|
|
WSR16
|
20200606
|
Rainy
|
Moderate
|
Mid-Flood
|
Middle
|
5.9
|
16:24
|
9.6
|
8.19
|
31.62
|
27.24
|
1.21
|
11
|
<0.10
|
0.192
|
NW
|
|
WSR16
|
20200606
|
Rainy
|
Moderate
|
Mid-Flood
|
Surface
|
1
|
16:25
|
9.15
|
8.08
|
31.41
|
27.59
|
1.12
|
12
|
<0.10
|
0.197
|
NW
|
|
WSR16
|
20200606
|
Rainy
|
Moderate
|
Mid-Flood
|
Surface
|
1
|
16:25
|
9.27
|
8.26
|
30.85
|
27.16
|
0.8
|
12
|
<0.10
|
0.224
|
NW
|
|
WSR33
|
20200606
|
Rainy
|
Moderate
|
Mid-Flood
|
Bottom
|
6.1
|
17:28
|
9.42
|
8.21
|
31.33
|
27.34
|
1.75
|
11
|
<0.10
|
0.166
|
W
|
|
WSR33
|
20200606
|
Rainy
|
Moderate
|
Mid-Flood
|
Bottom
|
6.1
|
17:28
|
9.24
|
8.14
|
30.56
|
27.34
|
1.82
|
10
|
<0.10
|
0.186
|
W
|
|
WSR33
|
20200606
|
Rainy
|
Moderate
|
Mid-Flood
|
Middle
|
3.55
|
17:29
|
10.06
|
8.19
|
30.91
|
27.81
|
1.08
|
9
|
<0.10
|
0.176
|
W
|
|
WSR33
|
20200606
|
Rainy
|
Moderate
|
Mid-Flood
|
Middle
|
3.55
|
17:29
|
9.72
|
8.22
|
30.49
|
27.24
|
1.14
|
10
|
<0.10
|
0.174
|
NW
|
|
WSR33
|
20200606
|
Rainy
|
Moderate
|
Mid-Flood
|
Surface
|
1
|
17:30
|
9.73
|
8.31
|
31.88
|
27.3
|
1.2
|
10
|
<0.10
|
0.192
|
W
|
|
WSR33
|
20200606
|
Rainy
|
Moderate
|
Mid-Flood
|
Surface
|
1
|
17:30
|
8.87
|
8.24
|
30.83
|
27.27
|
0.84
|
9
|
<0.10
|
0.164
|
NW
|
|
WSR36
|
20200606
|
Rainy
|
Moderate
|
Mid-Flood
|
Bottom
|
3.8
|
17:14
|
10.11
|
8.3
|
31.56
|
27.47
|
1.58
|
11
|
<0.10
|
0.175
|
W
|
|
WSR36
|
20200606
|
Rainy
|
Moderate
|
Mid-Flood
|
Bottom
|
3.8
|
17:14
|
9.5
|
8.31
|
31.17
|
27.61
|
1.96
|
10
|
<0.10
|
0.153
|
W
|
|
WSR36
|
20200606
|
Rainy
|
Moderate
|
Mid-Flood
|
Surface
|
1
|
17:15
|
10.03
|
8.17
|
31.15
|
27.78
|
0.93
|
13
|
<0.10
|
0.168
|
W
|
|
WSR36
|
20200606
|
Rainy
|
Moderate
|
Mid-Flood
|
Surface
|
1
|
17:15
|
8.52
|
8.07
|
31.73
|
27.72
|
1.32
|
14
|
<0.10
|
0.135
|
NW
|
|
WSR37
|
20200606
|
Rainy
|
Moderate
|
Mid-Flood
|
Bottom
|
6.7
|
16:57
|
9.04
|
8.19
|
32
|
27.76
|
1.76
|
8
|
<0.10
|
0.186
|
SW
|
|
WSR37
|
20200606
|
Rainy
|
Moderate
|
Mid-Flood
|
Bottom
|
6.7
|
16:57
|
9.86
|
8.22
|
31.47
|
27.44
|
2.11
|
8
|
<0.10
|
0.181
|
SW
|
|
WSR37
|
20200606
|
Rainy
|
Moderate
|
Mid-Flood
|
Middle
|
3.85
|
16:58
|
8.97
|
8.16
|
30.81
|
27.8
|
0.98
|
9
|
<0.10
|
0.132
|
W
|
|
WSR37
|
20200606
|
Rainy
|
Moderate
|
Mid-Flood
|
Middle
|
3.85
|
16:58
|
9.73
|
8.08
|
31.5
|
27.84
|
1
|
9
|
<0.10
|
0.151
|
NW
|
|
WSR37
|
20200606
|
Rainy
|
Moderate
|
Mid-Flood
|
Surface
|
1
|
16:59
|
9.54
|
8.13
|
31.96
|
27.28
|
0.94
|
10
|
<0.10
|
0.148
|
W
|
|
WSR37
|
20200606
|
Rainy
|
Moderate
|
Mid-Flood
|
Surface
|
1
|
16:59
|
10.06
|
8.21
|
30.51
|
27.79
|
0.75
|
10
|
<0.10
|
0.137
|
SW
|
Legend
The data shaped in grey area were collected under heavy
rain. The data measured and sampled on 6 June 2020 were not used as baseline
reference.