Revision History
|
Rev.
|
Description of Modification
|
Date
|
|
1.
|
First Issue
for Comments
|
06/05/2024
|
|
2.
|
Second Issue
for Comments
|
10/05/2024
|
|
2.1.
|
Minor
Revision
|
10/05/2024
|
|
3
|
Third Issue
for Comments
|
13/05/2024
|
|
3.1
|
Minor
Revision
|
13/05/2024
|
Executive Summary
Introduction
A1. The Project, Design, Build and Operate First
Stage of Tseung Kwan O Desalination
Plant (TKODP), is a Designated Project under the Environmental Impact
Assessment Ordinance (Cap. 499) (EIAO) and is currently governed by a Further
Environmental Permit (EP No. FEP - 01/503/2015/B) for the construction and
operation of the Contract.
A2. In accordance with the Environmental
Monitoring and Audit (EM&A) Manual for the Contract, EM&A works for marine water quality,
noise, waste management and ecology should be carried out by Environmental Team (ET),
Acuity Sustainability Consulting Limited (ASCL), during the construction phase
of the Contract.
A3. This is the 50th Monthly EM&A
Report, prepared by ASCL, for the Contract
summarizing the monitoring results
and audit findings
of the EM&A programme at and around Tseung
Kwan O Area 137 (TKO 137) during the reporting period from 1
April to 30 April 2024.
A4. The EM&A programme for this contract
has covered environmental monitoring on construction noise level at selected NSRs and Contractor��s environmental performance
auditing in the aspects of construction dust, construction noise, water
quality, waste management, Landscape and Visual and Ecology.
Summary of Main Works Undertaken & Key Mitigation Measures Implemented
A5. Key activities carried out in this
reporting period for the Contract included the followings:
|
Administration Building
-
Installation of signage
-
Installation of ceiling
-
Painting works
-
Installation of sanitary fitting
-
Installation of vinyl flooring
-
Installation of Aluminium Fins
-
Installation of Internal partition wall and ceiling
-
External wall
finishing works
-
Installation of AP doors
and cat ladders
-
Installation of wood decking
-
Minor Installation of building services, cable laying
and termination, Photovoltaic Panel Installation, Testing
& Commissioning
|
|
Chemical building
-
Roof planting works
-
Defect rectification
|
|
Main Electrical &
Central Chiller Plant
Building
-
Minor Installation of building services, electrical switchboard, cable laying,
pressure test
-
Ladder and Cover installation at Roof
|
|
ActiDAFF
-
Rectification works
for roof tiles
-
Installation of signage
-
Minor Installation of mechanical equipment, building services, minor cable laying and termination, Installation of
Fibre Reinforced Polymer Cover, Testing & Commissioning
|
|
Product Water Storage Tank Building
-
Installation of signage
-
Installation of cladding
works
-
Tiling work at Roof Slab on Tank
A
-
Ladder and Cover installation
at Roof
-
Roof Tiles installation
-
Minor Installation of
building services, cable laying and termination, Testing & Commissioning
|
|
OSCG Building
-
Installation of Promat Board in
Skid Room
-
Installation of cladding
works
-
Installation of Railing on Brine
Maker Tank
-
Installation of building services,
mechanical equipment and cable laying and termination, testing and
commissioning
|
|
Reverse Osmosis Building
-
Installation of AP doors
-
Installation of sanitary
fitting
-
Sanitary Ware Installation in
Toilet
-
Tiling Work in Toilet
-
Installation of Water Meter
Cabinets
-
Installation of building
services, electrical switchboard of cable laying and termination, Minor Installation
of mechanical equipment and raised floor, testing and commissioning,
Photovoltaic Panel Installation
|
|
Post Treatment Building
-
Installation of Cat Ladders in
Irrigation Tanks
-
Green Roof
-
Minor Installation of building
services, Minor Installation of mechanical equipment, Cable laying and
termination, Pressure Test
|
|
Inspection corridor
-
Installation of cat ladder
-
Internal decoration and finishing
works
|
|
Combined Shaft and
Pump room
-
Minor cable laying and termination, testing and commissioning
-
Defect rectification Guard House
-
Installation
of Building Services, testing and commissioning
Slope Work
-
Rock Dowel Installation
-
Buttress Construction
-
Wire Mesh Laying
-
Drilling; Rock anchors installation, Rock break, Concreting Other
-
Watermain installation works at CLP
132 Kv Substation
-
Underground utility
rectification work for Manhole and
Draw pit
-
Underground utility
Construction Work for Watermain water
-
Underground utility
repair Work for Sewerage, Watermains work)
-
Security Fence
footing construction work
-
Light Pole installation work
-
Road Construction
-
Footpath Construction
-
Landscape Construction
-
Irrigation System
installation
-
Water Pressure Test for
Fire Services and Plumbing System
-
Landscape planting work
-
Traffic signage work
-
Workshop construction
-
Cladding installation for Elevated Walkway
-
Wave deflector Wall
|
A6. The major environmental impacts
brought by the above construction works include:
-
Construction dust and noise generation from construction works, excavation
works and slope works;
-
Waste generation from the construction activities
A7. The key environmental mitigation measures implemented for the Contract
in this reporting period
associated with the above construction works include:
-
Dust suppression by regular
wetting and water spraying for construction works;
-
Reduction of noise from equipment and machinery on-site and regular inspection to machinery and plants/vehicles
on-site to ensure proper functioning;
-
Deployment of silt curtain
at the inshore water outflow;
-
Sorting and storage of general refuse
and construction waste;
and
-
Deployment protective fencing
for trees
Summary of exceedance & investigation &
follow-up
A8. No noise monitoring was conducted during
the reporting period since there are no Contract -related construction
activities undertaken within a radius of 300m from the monitoring locations. No
exceedance of the action Level was recorded during the reporting period.
A9. The construction phase marine water quality programme
was ceased from 1 September 2023 due to the completion of
marine-related construction works.
A10. The EM&A
works for Pre-operation phase marine water quality were conducted
during the reporting period in accordance with the EM&A
Manual. Thirty-eight (38) of the pre- operation
phase water quality monitoring results of SS obtained had exceeded the Action
Level. Twenty-two (22) of the pre-operation
phase water quality monitoring results of SS obtained during the reporting
period had exceeded the Limit Level.
A11. Water quality monitoring of the discharge
of dechlorinated effluent in disinfection procedure is completed in December
2023. The hourly dechlorinated effluent monitoring during the discharge is
finished.
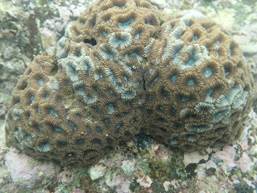
A12. Pre-operation phase coral monitoring works
was conducted on 17 April 2024. No sediment,
bleaching or increased mortality in the general condition of all tagged coral
colonies were observed during the monthly pre-operation phase monitoring period.
No deterioration of the coral community was observed in the ecological monitoring results
when compared with the baseline ecological monitoring results. There is no
AL/LL exceedance during the monitoring period. The detail of the monitoring is
presented in Appendix I
A13. Pre-operation phase fishery monitoring for
dry season 2024 was carried
out on 17 and 24 February 2024. The survey findings
showed that the abundance and diversity of fish
eggs and larvae are on the low
side for the Study Area, and
the abundance and diversity of
juveniles are very low for
the Study Area. Survey findings
also showed that there was a very week relationship in recorded
families between ichthyoplankton assemblages, adult fish and juvenile
fish in the Study Area, which implies
that the Study Area does not
appear to be an important spawning or nursery grounds for commercial fishes.
The detail of the monitoring is presented in Appendix I.
A14. In
this reporting period, 156 times of landfill
gas monitoring were periodically conducted at
TKO Area 137 (Ch1+120 - Ch1+800) until 20 April
2024. No exceedances of action level and limit
level was observed.
A15. Joint site inspections of the construction
work by ET and IEC were carried out on 29 April 2024 to
audit the mitigation measures implementation status. Reminders
were recorded in the site inspection checklists and provided to the contractors together with the
appropriate follow-up actions where necessary.
Complaint Handling and Prosecution
A16. No environmental complaint, notification of summons
and prosecution was received in the
reporting period.
Reporting Change
A17. There was no change to be reported that may affect the on-going
EM&A programme.
Summary of Upcoming
Key Issues and Key Mitigation Measures
A18. Key
activities anticipated in the next reporting period for the Contract will
include the followings:
|
Administration Building
-
Installation of ceiling
-
Painting works
-
Installation of sanitary fitting
-
Installation of vinyl flooring
-
Installation of Aluminium Fins
-
Installation of Internal partition wall and ceiling
-
External wall
finishing works
-
Installation of AP doors
and cat ladders
-
Installation of wood decking
-
Minor Installation of building services, cable laying
and termination, Photovoltaic Panel Installation, Testing
& Commissioning
|
|
Chemical building
-
External wall painting works
-
Defect rectification
|
|
Main Electrical &
Central Chiller Plant
Building
-
Minor Installation of building
services, electrical switchboard, cable laying, pressure test
-
Ladder and Cover installation
at Roof
|
|
ActiDAFF
-
Sealing gap and wall openings
-
Installation of signage
-
Minor Installation of
mechanical equipment, building services, minor cable laying
-
and termination, Installation
of Fibre Reinforced Polymer Cover, Testing & Commissioning
|
|
Product Water Storage Tank Building
-
Installation of signage
-
Installation of cladding
works
-
Tiling work at Roof Slab on Tank
A
-
Ladder and Cover installation
at Roof
|
|
-
Roof Tiles installation
-
Minor Installation of
building services, cable laying and termination, Testing & Commissioning
|
|
OSCG Building
-
Core Opening at Cladding
-
Installation of cladding
works
-
Installation of Railing on Brine
Maker Tank
-
Installation of building services,
mechanical equipment and cable laying and termination, testing and
commissioning and pressure test
|
|
Reverse Osmosis Building
-
Installation of AP doors
-
Installation of sanitary
fitting
-
Sanitary Ware Installation in
Toilet
-
Tiling Work in Toilet
-
Installation of Water Meter
Cabinets
-
Installation of building services,
electrical switchboard of cable laying and
-
termination, Minor Installation
of mechanical equipment and raised floor, testing and commissioning,
Photovoltaic Panel Installation
|
|
Post Treatment Building
-
DFMA Gap Seal Up
-
Minor Installation of building
services, Minor Installation of mechanical equipment, Cable laying and
termination, Pressure Test
|
|
Inspection corridor
-
Interior painting works
-
Interior fitting out works
|
|
Combined Shaft and
Pump room
-
Installation of outfall grating and defect rectification .
-
Minor cable laying and
termination, testing and
commissioning Guard House
-
Guard house A defect
rectification
-
Guard house B defect
rectification
-
Minor Cable laying and Termination
Slope Work
-
Drilling; Rock anchors installation, Rock break, Concreting Other
-
Watermain installation works at CLP
132 Kv Substation
-
Underground utility rectification work for Manhole and Draw pit
-
Underground utility
Construction Work for Watermain water
-
Underground utility
repair Work for Sewerage, Watermains work)
-
Security Fence
footing construction work
-
Light Pole installation work
|
|
-
Road Construction
-
Footpath Construction
-
Landscape Construction
-
Irrigation System
installation
-
Landscape planting work
-
Traffic signage
work
-
Workshop construction work, Tiling work,
green roof and irrigation pipe
-
Workshop Building Services Installation, cable
laying and termination
-
Tiling work and cladding installation for Elevated Walkway
-
Master meter defect rectification
-
Wave deflector Wall
|
A19. The major environmental impacts brought by the above construction works will include:
-
Construction dust and noise generation from excavation, construction works and slope works;
and
-
Waste generation from construction activities.
A20. The key
environmental mitigation measures for the Contract in the coming reporting
period associated with the above construction works will include:
-
Reduction of noise from equipment and machinery on-site;
-
Dust suppression by regular
wetting and water spraying for construction works and at main haul road;
-
Sorting and storage of general refuse
and construction waste;
-
Deployment of silt curtain
at the inshore water outflow;
and
-
Deployment protective fencing
for trees.
1.
Basic Contract Information
Background
1.1.
The Acciona Agua, S.A. Trading, Jardine
Engineering Corporation, Limited and China State
Construction Engineering (Hong
Kong) Limited as AJC Joint Venture (AJCJV)
is contracted to carry out the Design, Build and Operate
First Stage of Tseung Kwan O Desalination Plant (DPTKO) under Contract No. 13/WSD/17 (the Contract).
1.2.
Acuity Sustainability
Consulting Limited (ASCL) is commissioned by AJCJV to undertake the
Environmental Team (ET) services as required and/or implied, both explicitly
and implicitly, in the Environmental Permit (EP), Environmental Impact
Assessment Report (EIA Report) (Register No. AEIAR-192/2015) and Environmental
Monitoring and Audit Manual (EM&A Manual)
for the Contract; and to carry out the Environmental Monitoring and Audit (EM&A) programme in fulfillment of the EIA Report��s EM&A
requirements and Contract No.
13/WSD/17 Specification requirements.
1.3.
Pursuant to the Environmental
Impact Assessment Ordinance (EIAO), the Director of Environmental Protection
granted the Environmental Permit (No. EP-503/2015/B) to Water Supplies
Department (WSD); and granted the Further Environmental Permit (No.
FEP-01/503/2015/B) to AJCJV for the Contract.
The Reporting Scope
1.4.
This is the 50th Monthly EM&A
Report for the Contract which summarizes the key findings of the EM&A programme during
the reporting period from 1 April to 30 April 2024.
Contract Organization
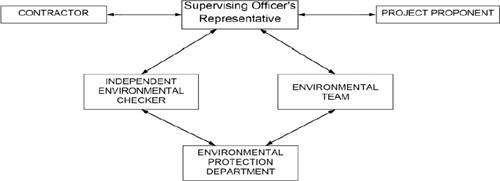
1.5.
The Contract Organization structure
for Construction Phase is presented in Figure 1.1.
Figure 1.1 Contract Organization Chart
1.6.
Contact details of the key personnel are presented in Table 1.1 below:
Table 1.1 Contact Details
of Key Personnel
|
Party
|
Position
|
Name
|
Telephone no.
|
|
Contract Proponent (Water Supplies Department)
|
SE/CM2
|
Milton Law
|
2634-3573
|
|
Supervising Officer (Binnies Hong Kong Limited)
|
Project Manager
|
Christina Ko
|
2608-7302
|
|
Chief Resident
Engineer
|
Roger Wu
|
6343-1002
|
|
The Jardine
Engineering Corporation, Limited, China
State Construction Engineering (Hong Kong) Limited and Acciona Agua,
S.A. Trading
|
Project Manager
|
Stephen Yeung
|
2807-4665
|
|
Environmental
Monitoring Manager
|
Brian Kam
|
9456-9541
|
|
Environmental
Monitoring Manager
|
Tommy Law
|
6468-1782
|
|
Acuity Sustainability Consulting Limited
|
Environmental Team Leader
|
Jacky Leung
|
2698-6833
|
|
Lam Environmental Services Limited
|
Independent Environmental Checker
(IEC)
|
Serena Shek
|
6149-6683
|
Summary of Construction Works
1.7.
Details of the major
construction activities undertaken in this reporting
period are shown below. The master programme is
presented in Appendix A.
1.8.
Key activities carried out in this reporting period for the Contract included
the followings:
|
Administration Building
-
Installation of signage
-
Installation of ceiling
-
Painting works
-
Installation of sanitary fitting
-
Installation of vinyl flooring
-
Installation of Aluminium Fins
-
Installation of Internal partition wall and ceiling
-
External wall
finishing works
-
Installation of AP doors
and cat ladders
-
Installation of wood decking
-
Minor Installation of building services, cable laying
and termination, Photovoltaic Panel Installation, Testing
& Commissioning
|
|
Chemical building
-
Roof planting works
-
Defect rectification
|
|
Main Electrical &
Central Chiller Plant
Building
-
Minor Installation of building
services, electrical switchboard, cable laying, pressure test
-
Ladder and Cover installation
at Roof
|
|
ActiDAFF
-
Rectification works for roof
tiles
-
Installation of signage
-
Minor Installation of mechanical
equipment, building services, minor cable laying and termination,
Installation of Fibre Reinforced Polymer Cover, Testing & Commissioning
|
|
Product Water Storage Tank Building
-
Installation of signage
-
Installation of cladding
works
-
Tiling work at Roof Slab on Tank
A
-
Ladder and Cover installation
at Roof
-
Roof Tiles installation
-
Minor Installation of
building services, cable laying and termination, Testing & Commissioning
|
|
OSCG Building
-
Installation of Promat Board in
Skid Room
-
Installation of cladding
works
-
Installation of Railing on Brine
Maker Tank
-
Installation of building services,
mechanical equipment and cable laying and termination, testing and
commissioning
|
|
Reverse Osmosis Building
-
Installation of AP doors
-
Installation of sanitary
fitting
-
Sanitary Ware Installation in
Toilet
-
Tiling Work in Toilet
-
Installation of Water Meter
Cabinets
-
Installation of building services,
electrical switchboard of cable laying and
-
termination, Minor Installation
of mechanical equipment and raised floor, testing and commissioning,
Photovoltaic Panel Installation
|
|
Post Treatment Building
-
Installation of Cat Ladders in
Irrigation Tanks
-
Green Roof
-
Minor Installation of building
services, Minor Installation of mechanical equipment, Cable laying and
termination, Pressure Test
|
|
Inspection corridor
-
Installation of cat ladder
-
Internal decoration and finishing
works
|
|
Combined Shaft and
Pump room
-
Minor cable laying and termination, testing and commissioning
-
Defect rectification Guard House
-
Installation
of Building Services, testing and commissioning
Slope Work
-
Rock Dowel Installation
-
Buttress Construction
-
Wire Mesh Laying
-
Drilling; Rock anchors installation, Rock break, Concreting Other
-
Watermain installation works at CLP
132 Kv Substation
-
Underground utility
rectification work for Manhole and
Draw pit
-
Underground utility
Construction Work for Watermain water
-
Underground utility
repair Work for Sewerage, Watermains work)
-
Security Fence
footing construction work
-
Light Pole installation work
-
Road Construction
-
Footpath Construction
-
Landscape Construction
-
Irrigation System
installation
-
Water Pressure Test for
Fire Services and Plumbing System
-
Landscape planting work
-
Traffic signage work
-
Workshop construction
-
Cladding installation for Elevated Walkway
-
Wave deflector Wall
|
1.9.
A summary of the valid permits,
licences, and/or notifications on environmental
protection for this Contract is presented in Table 1.2.
Table 1.2 Summary
of the Status of Valid Environmental Licence, Notification, Permit and
Documentations
|
Permit/ Licences
|
Valid Period
|
Status
|
Remark
|
|
From
|
To
|
|
Environmental Permit
|
|
EP-503/2015/A
|
Throughout the Contract
|
Valid
|
-
|
|
FEP - 01/503/2015/A
|
Throughout the Contract
|
Valid
|
-
|
|
EP-503/2015/B
|
Throughout the Contract
|
Valid
|
-Issued
on 3 April 2024
|
|
FEP - 01/503/2015/B
|
Throughout the Contract
|
Valid
|
-Issued on 3 April
2024
|
|
Notification of Construction Works
under the Air Pollution Control
(Construction Dust) Regulation (Form NA)
|
|
451539
|
Throughout the Contract
|
Valid
|
-
|
|
Billing Account
for Disposal of Construction Waste
|
|
7036276
|
Throughout the Contract
|
Valid
|
-
|
|
Sludge (Special Waste) Disposal (Admission Ticket)
|
|
17674
|
04/01/2024
|
30/06/2024
|
Valid
|
-
|
|
Chemical Waste
Producer Registration
|
|
5213-839-A2987-01
|
Throughout the Contract
|
Valid
|
-
|
|
Wastewater Discharge Licence (Land and Marine works)
|
|
WT00035775-2020
|
23/08/2021
|
31/07/2025
|
Valid
|
-
|
|
WT00044188-2023
|
16/06/2023
|
30/06/2028
|
Valid
|
- For Plant T&C and operation.
- Variation of sampling point
for the Discharge
Licence Part 1 is in
process.
|
|
Construction Noise
Permit
|
|
GW-RE1514-23
|
22/12/2023
|
21/06/2024
|
Valid
|
-
|
1.10.
The status for all environmental aspects
is presented in Table 1.3.
Table 1.3 Summary
of Status for Key Environmental Aspects under the EM&A Manual
|
Parameters
|
Status
|
|
Water Quality
|
|
Baseline Monitoring under EM&A Manual
|
The baseline water quality
monitoring was conducted between
12 May 2020
to 6 Jun
2020.
|
|
Construction Phase Impact
Monitoring
|
Ceased from 1 September 2023
|
|
Pre-operation phase Marine Impact Monitoring
|
On-going
|
|
Impact Monitoring of Effluent Discharge from Main Disinfection
|
Completed
|
|
Noise
|
|
Baseline Monitoring
|
The baseline noise
monitoring result has been reported in Baseline Monitoring Report and submitted to EPD under EP Condition 3.4
|
|
Impact Monitoring
|
Completed
|
|
Waste Management
|
|
Mitigation Measures in Waste Management Plan
|
On-going
|
|
Landfill Gas
|
|
Regular Monitoring when
construction works are within the 250 m Consultation Zone
|
On-going
|
|
Ecology (Coral)
|
|
Pre-operation phase Regular Coral Monitoring (Monthly)
|
On-going
|
|
Ecology (Fishery)
|
|
Pre-operation phase Regular Fishery Monitoring (Seasonally)
|
On-going
|
|
Ecology (Landscape)
|
|
Pre-operation phase Landscape and Visual Site Inspection
|
On-going
|
|
Environmental Audit
|
|
Site Inspection covering Measures of Air Quality,
Noise Impact, Water Quality, Waste, Ecological Quality, Fisheries,
Landscape and Visual
|
On-going
|
1.11. Other than the EM&A work by ET, environmental briefings,
trainings, and regular environmental management meetings were conducted, in
order to enhance environmental awareness and closely monitor the environmental
performance of the contractors.
1.12. The EM&A programme has been implemented in accordance with the
recommendations presented in the approved EIA Report and the EM&A
Manual. A summary of implementation status of the environmental mitigation
measures for the construction phase and the Pre-operation phase of the Contract during the reporting period is provided in Appendix C.
2.
Noise
Monitoring Requirements
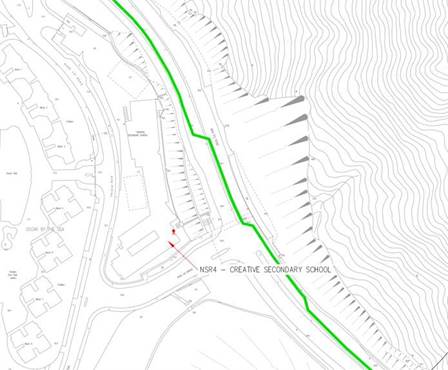
2.1.
To ensure no adverse noise
impact, noise monitoring is recommended to be carried out within 300m radius from the nearby noise sensitive
receivers (NSRs), during
construction phase. The NSRs selected as monitoring station
are (i) NSR4 -
Creative Secondary School, (ii) NSR24 - PLK Laws Foundation
College, and (iii) NSR31 - School of Continuing and Professional Studies - CUHK
respectively.
2.2.
Construction noise level were
measured in terms of the A-weighted equivalent continuous sound pressure level
(LAeq). Leq 30min was used as the monitoring parameter for the time period between
0700 and 1900 on normal
weekdays. Construction works
would follow stipulations of the valid Construction Noise Permits if works had
to be conducted during restricted hours or public holidays. Table 2.1 summarizes the monitoring
parameters, frequency, and duration of the impact noise monitoring.
Table 2.1 Noise Monitoring Parameters, Time, Frequency and Duration
|
Time
|
Duration
|
Interval
|
Parameters
|
|
Daytime: 0700-1900
|
Day time: 0700-1900
(during normal weekdays)
|
Continuously in
Leq 5min/Leq 30min (average
of 6 consecutive Leq 5min)
|
Leq 30min
L10 30min & L90 30min
|
Monitoring Locations
2.3.
The monitoring locations were normally made at a point 1m from the exterior of the NSRs building façade and be at a position
1.2m above the ground. A correction of +3dB(A) should be made to the free-field
measurements.
2.4.
According to the environmental
findings detailed in the EIA report and Baseline Monitoring Report, the
designated locations for the construction noise monitoring are listed in Table 2.2 below.
Table 2.2 Noise Sensitive Receivers
|
NSR ID
|
Noise Sensitive Receivers
|
Monitoring Location
|
Position
|
|
NSR 4
|
Creative Secondary School
|
Roof Floor
|
1
m from facade
|
|
NSR 24
|
PLK Laws
Foundation College
|
Pedestrian Road
on Ground Floor
|
Free-field
|
|
NSR 31
|
School of Continuing and
Professional Studies - CUHK
|
Roof Floor
|
1
m from facade
|
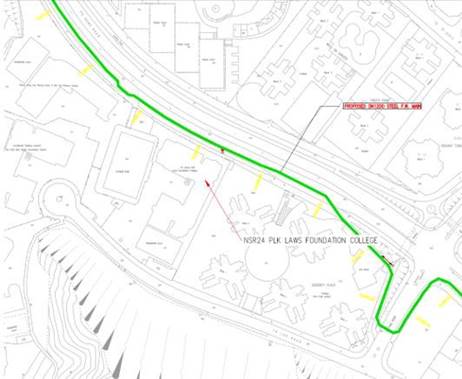
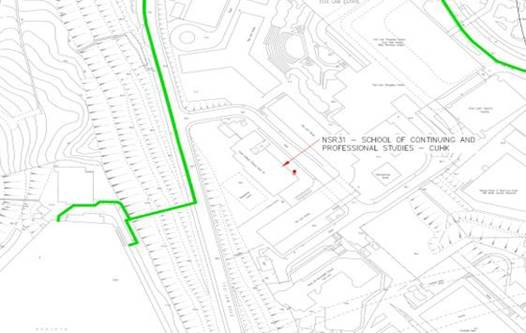
2.5.
Three noise monitoring locations
for impact monitoring at the nearby sensitive receivers are shown in Figure 2.1-2.3.
|
|
|
Figure 2.1 NSR4
Creative Secondary School
|
|
|
|
Figure 2.2 NSR24
PLK Laws Foundation College
|
|
|
|
Figure 2.3
NSR31 School of Continuing and Professional Studies - CUHK
|
Impact Monitoring Methodology
2.6.
Integrated sound level meter
will be used for the noise monitoring. The meter will be in compliance with the
International Electrotechnical Commission Publications 651: 1979 (Type 1) and
804: 1985 (Type 1) specifications.
Immediately prior to and following
each noise measurement the accuracy of the sound level meter will be checked
using an acoustic calibrator generating a known sound pressure level at a known
frequency. Measurements will be accepted
as valid only if the calibration
levels before and after the noise
measurements agree to within 1.0 dB(A).
2.7.
Noise measurements were not made in the presence
of fog, rain, wind with a steady
speed exceeding 5 m/s or wind with gusts exceeding 10 m/s. The wind
speed shall be checked with a portable wind speed meter capable of measuring
the wind speed in m/s.
Action and Limit Levels
2.8.
The Action/Limit Levels are in line with the criteria of Practice Note for Professional Persons (ProPECC
PN 2/93) ��Noise from Construction Activities - Non-statutory Controls�� and Technical Memorandum on Environmental Impact Assessment Process
issued by HKSAR Environmental
Protection Department [��EPD��] under the Environmental Impact Assessment
Ordinance, Cap 499, S.16 are presented in Table
2.3.
Table 2.3 Action and Limit Levels
for Noise per EM&A Manual
|
Time Period
|
Action
|
Limit (dB(A))
|
|
0700-1900
on normal weekdays
|
When one documented
complaint is received from any one of the noise sensitive receivers
|
-
70 dB(A) for school and
-
65 dB(A) during examination period
|
Note: Limits specified in the GW-TM and IND-TM for construction and operation noise,
respectively.
2.9.
If exceedances were found
during noise monitoring, the actions in accordance with the Event and Action
Plan shall be carried out according to Appendix
E.
Monitoring Results
and Observations
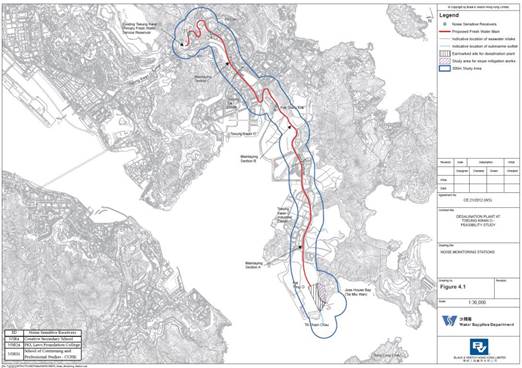
2.10. Referring to EM&A Manual Section 4.1.2, the impact noise
monitoring should be carried out when there
are Contract-related construction activities undertaken within
a radius of 300m from the monitoring stations. As
no Contract-related construction activities were undertaken in the reporting
month within a radius of 300m from the monitoring stations as shown in Figure
2.4, no impact noise monitoring was conducted in the reporting period.
Figure 2.4 Site Layout Plan with Noise Sensitive
Receivers and Desalination Plant
3.
Water Quality
3.1.
In accordance with the recommendations of the EIA, water quality
monitoring is required during dredging for the
submarine pipelines and, during operation phase. The following Section provides
details of the water quality monitoring to be undertaken by the Environmental
Team (ET) to verify the distance of
sediment and brine plume dispersion and to identify whether
the potential exists
for any indirect impacts to occur to ecological
sensitive receivers.
3.2.
The water quality monitoring
programme was be carried out to allow any deteriorating water quality to be
readily detected and timely action taken to rectify the situation.
3.3.
Water quality monitoring for the Contract
can be divided into the following stages:
-
Dredging activities during construction phase;
-
Discharge of effluent from main disinfection during construction phase;
and
-
Operation activities during Pre-operation phase.
Water Quality
Parameters
3.4.
The parameters that have been selected
for measurement in situ and in the laboratory are those that were either determined in
the EIA to be those with the most potential to be affected by the construction
works or are a standard check on water quality conditions. Parameters to be
measured in the impact monitoring are listed in Table 3.1.
Table 3.1 Parameters measured
in the Impact Marine Water Quality Monitoring
|
Parameters
|
Unit
|
Abbreviation
|
|
In-situ measurements
|
|
Dissolved oxygen
|
mg/L
|
DO
|
|
Temperature
|
oC
|
-
|
|
pH
|
-
|
-
|
|
Turbidity
|
NTU
|
-
|
|
Salinity
|
0/00
|
-
|
|
Total Residual Chlorine NOTE1
|
mg/L
|
TRC
|
|
Laboratory measurements
|
|
Suspended Solids
|
mg/L
|
SS
|
|
Iron-Soluble
|
mg/L
|
Fe
|
|
Anti-scalant as Reactive Phosphorus
|
mg/L
|
PO4 as P-
|
NOTE 1: Monitoring of Total Residual
Chlorine will be conducted when cleaning and sterilization of the new freshwater main is carried out.
3.5.
In addition to the water quality
parameters, other relevant
data were also being measured and recorded in Water Quality
Monitoring Logs, including the location of the sampling stations, water depth,
time, weather conditions, sea conditions, tidal stage, current direction and
velocity, special phenomena and work activities undertaken around the
monitoring and works area that may influence the monitoring results.
Monitoring Equipment
3.6.
For water quality monitoring, the following equipment
were used:
Dissolved Oxygen and Temperature Measuring Equipment - The instrument was a portable, weatherproof dissolved oxygen measuring
instrument complete with cable, sensor, comprehensive operation manuals, and
was operable from a DC power source.
It was capable of measuring: dissolved oxygen levels in the range of 0 - 20
mg/L and 0 - 200% saturation; and a temperature of 0 - 45 degrees Celsius. It
has a membrane electrode with automatic temperature compensation complete with
a cable of not less than 35 m in length. Sufficient stocks of spare electrodes
and cables were available for replacement where necessary (e.g. YSI model 59 DO
meter, YSI 5739 probe, YSI 5795A submersible stirrer with reel and cable or an
approved similar instrument).
Turbidity Measurement Equipment - The
instrument was a portable, weatherproof turbidity-measuring unit complete with
cable, sensor and comprehensive operation manuals. The equipment was operated
from a DC power source, it has a photoelectric sensor capable of measuring
turbidity between 0 - 1000 NTU and complete
with a cable with at least
35 m in length (for example Hach 2100P or an approved
similar instrument).
Salinity Measurement Instrument - A
portable salinometer capable of measuring salinity in the range of 0 - 40 ppt was provided
for measuring salinity
of the water at each monitoring location.
Water Depth Gauge - A portable,
battery-operated echo sounder (for example Seafarer 700 or a similar approved instrument) was used for
the determination of water depth at
each designated monitoring station. This unit will preferably be affixed to the
bottom of the work boat if the same vessel
is to be used throughout the monitoring programme. The echo sounder was suitably calibrated.
Positioning Device - A Global
Positioning System (GPS) was used during monitoring to allow accurate recording
of the position of the monitoring vessel before taking measurements. The Differential GPS, or equivalent instrument, was suitably calibrated at appropriate checkpoint (e.g. Quarry Bay Survey Nail) to verify
that the monitoring station is at the correct position before the water quality
monitoring commence.
Water Sampling Equipment - A water
sampler, consisting of a PVC or glass cylinder of not less than two litres,
which can be effectively sealed with cups at
both ends, was used. The water sampler has a positive latching system to keep it open and prevent premature closure
until released by a messenger when the sampler is at the selected water depth.
Total Residual Chlorine -Total residual
chlorine (TRC) shall be measured in-situ using approved test kit.
Sampling / Testing Protocols
3.7.
All in situ monitoring instruments were checked,
calibrated, and certified by a laboratory accredited under HOKLAS or any
other international accreditation scheme before use, and subsequently
re-calibrated at monthly intervals throughout the stages of the water quality
monitoring. Responses of sensors and electrodes were checked with certified
standard solutions before each use.
3.8.
On-site calibration of field equipment was following the ��Guide to On-Site
Test Methods for the Analysis of Waters��, BS 1427:
2009. Sufficient stocks of spare parts were maintained for replacements when
necessary. Backup monitoring equipment was made available so that monitoring can proceed uninterrupted even when equipment is under maintenance, calibration etc.
Laboratory Measurement and Analysis
3.9.
Sufficient volume of each water
sample was collected for carrying out the laboratory analyses. Using chain of
custody forms, collected water samples were transferred to a HOKLAS accredited laboratory (Acumen Laboratory and Testing Limit - HOKLAS 241) for immediate processing. The
determination work was start within the next working day after collection of the water samples. Analytical methodology and sample
preservation of other
parameters were based on the latest edition of Standard Methods for the
Examination of Waste and Wastewater published by APHA, AWWA and WPCF and
methods by USEPA, or suitable method in accordance with requirements of HOKLAS
or another internationally accredited scheme. The QA/QC details were in
accordance with the requirements of HOKLAS or another internationally
accredited scheme.
3.10. Parameters for laboratory measurements, standard methods and
detection limits are presented in Table
3.2.
Table 3.2 Laboratory measurements, standard methods, and corresponding
detection limits of marine water quality monitoring
|
Parameters
|
Standard Methods
|
Detection Limit
|
Reporting Limit
|
Precision
|
|
Dissolved oxygen
|
Instrumental, CTD
|
0.1
|
-
|
+-25%
|
|
Temperature
|
Instrumental, CTD
|
0.1
|
-
|
+-25%
|
|
pH
|
Instrumental, CTD
|
0.1
|
-
|
+-25%
|
|
Turbidity
|
Instrumental, CTD
|
0.1
|
-
|
+-25%
|
|
Salinity
|
Instrumental, CTD
|
0.1
|
-
|
+-25%
|
|
Suspended
Solids
|
APHA
23rd Ed 2540D
|
1.0
|
2.5
|
+-17%
|
|
Iron
|
APHA 3111
B
|
0.2
|
-
|
+-25%
|
|
Total residual chlorine
|
Test Kit (Lovibond MD200)
|
Lowest limit
= 0.01mg/L;
Upper limit
= 6 mg/L
|
-
|
+-25%
|
Monitoring Location
Construction Phase
3.11. The Impact water quality monitoring was ceased from 1 September 2023
due to the completion of marine-related construction works.
Pre-operation phase
3.12. The pre-operation phase impact water quality monitoring locations
are in accordance with the EM&A Manual and detailed in Table 3.3 below. A schedule for water quality monitoring was
prepared by the ET and submitted to IEC and EPD prior to the commencement of
the monitoring.
Table 3.3 Location
of Impact Water Quality Monitoring Stations
|
Station
|
Easting
|
Northing
|
Description
|
|
CE
|
843550
|
815243
|
Upstream control station at ebb tide
|
|
CF
|
846843
|
810193
|
Upstream control station at flood tide
|
|
WSR1
|
846864
|
812014
|
Ecological sensitive receiver at Tung Lung Chau
|
|
WSR2
|
847645
|
812993
|
Fisheries sensitive receiver at Tung Lung Chau
|
|
WSR3
|
848023
|
813262
|
Ecological sensitive receiver at Tung Lung Chau
|
|
WSR4
|
847886
|
814154
|
Ecological sensitive receiver at Tai Miu Wan
|
|
WSR16
|
845039
|
815287
|
Ecological sensitive receiver at Fat Tong Chau
|
|
WSR33
|
847159
|
814488
|
Ecological sensitive receiver at Tai Miu Wan
|
|
WSR36
|
846878
|
814081
|
Ecological sensitive receiver
at Kwun Tsai
|
|
WSR37
|
846655
|
813810
|
Ecological sensitive receiver at Tit Cham Chau
|
|
NF1
|
846542
|
813614
|
Edge of Mixing zone, ~ 200m west of outfall diffuser
|
|
NF2
|
846942
|
813614
|
Edge of Mixing zone, ~ 200m east of outfall diffuser
|
|
NF3
|
846742
|
813414
|
Edge of Mixing zone, ~ 200m south of outfall diffuser
|
3.13. WSR1 to WSR37 were identified in accordance with Annex 14 of the EIAO-TM as well as Clause 3.4.4.2
of the Environmental Impact Assessment Study Brief for Desalination Plant at
Tseung Kwan O (No. ESB-266/2013). WSR1 to WSR3 are sited
near the Tung Lung Chau Fish Culture Zone; WSR16 and WSR36
are sited near the coral assemblages along the coastlines of Fat Tong Chau and Kwun Tsai respectively; WSR 4 and WSR33 are sited near the Coastal Protection Area and coral
assemblages in waters of Tai Miu Wan; WSR37 is sited near the fisheries
resource including spawning and nursery grounds at the coastal water of Tit
Cham Chau. NF1 to NF3 are the Edge of Mixing zone.
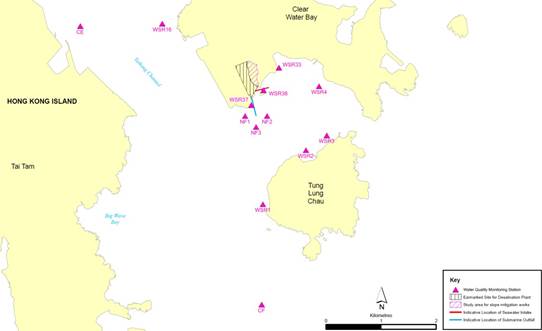
Figure 3.1 Impact water quality monitoring locations under EM&A Manual
Sampling Frequency
Pre-operation phase
3.14. Impact water quality monitoring were carried out three days per week
during the commission phase. Monitoring at each station
was undertaken once per day. The interval between two sets of monitoring
was not less than 36 hours. The monitoring frequency would be increased in the
case of exceedances of Action/Limit Levels if considered necessary by ET.
Monitoring frequency would be maintained as far as practicable.
Sampling Depths & Replication
3.15. During impact water quality monitoring, each station was sampled,
and measurements/ water samples were taken at three depths,
1 m below the sea surface, mid-depth, and 1 m above
the seabed. For in situ measurements, duplicate readings were made at each water depth at each station.
Duplicate water samples
were collected at each water
depth at each station.
Action and Limit Levels
Pre-operation phase
3.16. The Action and Limit Levels
have been set based on the derivation criteria specified in the
EM&A Manual. The Action/Limit Levels have been derived and are presented in
Table 3.4.
Table 3.4 Derived Action
and Limit Levels
for Water Quality
|
Parameters
|
Action
|
Limit
|
|
Pre-operation phase
Impact Monitoring
|
|
DO in mg/L
|
Surface and Middle
7.30 mg L-1
Bottom
7.31 mg L-1
Tung Lung
Chau Fish Culture Zone
5.1 mgL-1 or level at control station
(Whichever the lower)
|
Surface and Middle 4 mg L-1
Bottom 2 mg L-1
Tung Lung
Chau Fish Culture Zone
5.0 mgL-1 or level at control station (Whichever the lower)
|
|
SS in mg/L (Depth-
averaged)
|
5.00 mg L-1 or 20% exceedance of value at any impact station
compared with corresponding data from control station
|
6.00 mg L-1 or 30% exceedance of value at any
impact station compared with corresponding data from control station
|
|
Turbidity in NTU (Depth- averaged)
|
2.41 NTU
or 20% exceedance of value at any impact station compared with corresponding data from control station
|
2.84 NTU
or 30% exceedance of value at any impact station compared with corresponding
data from control station
|
|
Salinity
in PSU (Depth- averaged)
|
34.25 PSU
or 9% exceedance of value at any impact station compared with corresponding data from control station
|
34.56 PSU or 10% exceedance of value at any impact station compared with
corresponding data from control station
|
|
Iron in mg/L (Depth-
averaged)
|
0.3 mg/L
|
0.3 mg/L
|
|
Total residual chlorine in mg/L
|
0.01 mg/L
|
0.01 mg/L
|
Notes:
i. "Depth-averaged" is calculated by taking the arithmetic
means of reading of all three depths.
ii. For DO, non-compliance of the water
quality limits occurs
when monitoring result
is lower than the limits.
iii. For Turbidity, SS, iron and Salinity, non-compliance of the water quality limits occurs
when monitoring result is higher than
the limits.
iv.
Monitoring of Total Residual
Chlorine (Disinfection) will be conducted
when cleaning and sterilization of the new freshwater
main is carried out.
Monitoring Results and Observations
Construction Phase
3.17. Referring to EM&A Manual, the general water quality monitoring
should be carried out when there are
marine-related construction activities undertaken. General
water quality monitoring at
the ten monitoring stations (CE, CF, WSR1, WSR2, WSR3, WSR4, WSR16, WSR33,
WSR36 and WSR37) was ceased from 1 September 2023 due to the completion of marine-related
construction works.
Pre-operation phase
3.18. Considering the first testing and commissioning(T&C) phase of
Tseung Kwan O Desalination Plant was started in the reporting period,
additional marine water quality monitoring was conducted at the thirteen
monitoring stations (CE, CF, WSR1, WSR2, WSR3,
WSR4, WSR16, WSR33, WSR36, WSR37, NF1, NF2 and NF3) from 12 December
2023. The Action
and Limit Level
would be referred
to the approved EM&A Manual Table
5.4 First-year Operation Phase Marine
Water Monitoring
3.19. The additional marine water quality
monitoring was conducted
at the thirteen monitoring
stations on 2, 4, 6, 9, 11, 13, 16, 18, 20, 23, 25, 27
and 30 April 2024.
3.20. Thirty-eight (38) of the
pre-operation phase water quality monitoring results of SS obtained had
exceeded the Action Level. Twenty-two (22) of
the pre-operation phase water quality monitoring results of SS obtained during
the reporting period
had exceeded the Limit Level.
3.21. Investigation on the reason of exceedance has been carried
out, where the exceedances of SS on 2, 4,
6, 9, 11, 13, 16, 18, 23, 25, and 27 April 2024 were concluded to be
unrelated to the Contract as detailed in the Incident Reports on Action Level
or Limit Level Non- compliance along with supporting materials in Appendix L.
3.22. Monitoring results of 8 key parameters: Salinity,
DO, turbidity, SS, pH, temperature, Total Residual Chlorine and Iron in this reporting, are
summarized in Table 3.5, and
detailed results are presented in Appendix
G.
Table 3.5 Summary of Impact Water
Quality Monitoring Results
|
Locations
|
Parameters
|
|
Salinity
(ppt)
|
Dissolved Oxygen (mg/L)
|
pH
|
Turbidity
(NTU)
|
Suspended Solids (mg/L)
|
Temp. (oC)
|
TRC
(mg/L)
|
Iron (mg/L)
|
|
Surface & Middle
|
Bottom
|
|
CE
|
Avg.
|
33.10
|
8.49
|
8.50
|
8.27
|
2.36
|
3.80
|
24.57
|
<0.01
|
<0.1
|
|
Min.
|
32.28
|
8.02
|
7.98
|
8.14
|
1.70
|
2.50
|
23.19
|
<0.01
|
<0.1
|
|
Max.
|
34.17
|
9.42
|
9.55
|
8.45
|
2.80
|
9.00
|
25.98
|
<0.01
|
<0.1
|
|
CF
|
Avg.
|
33.19
|
8.59
|
8.59
|
8.26
|
2.46
|
3.92
|
24.66
|
<0.01
|
<0.1
|
|
Min.
|
32.47
|
8.01
|
7.94
|
8.13
|
2.10
|
2.50
|
23.22
|
<0.01
|
<0.1
|
|
Max.
|
33.95
|
9.11
|
9.06
|
8.43
|
3.33
|
9.00
|
26.02
|
<0.01
|
<0.1
|
|
WSR1
|
Avg.
|
33.03
|
8.72
|
8.74
|
8.25
|
1.85
|
3.56
|
24.64
|
<0.01
|
<0.1
|
|
Min.
|
31.86
|
7.78
|
7.79
|
8.13
|
1.24
|
2.50
|
23.37
|
<0.01
|
<0.1
|
|
Max.
|
34.18
|
9.50
|
9.62
|
8.45
|
2.39
|
9.00
|
25.87
|
<0.01
|
<0.1
|
|
WSR2
|
Avg.
|
33.31
|
8.60
|
8.61
|
8.29
|
1.89
|
3.65
|
24.64
|
<0.01
|
<0.1
|
|
Min.
|
32.42
|
7.69
|
7.66
|
8.05
|
1.51
|
2.50
|
23.25
|
<0.01
|
<0.1
|
|
Max.
|
33.83
|
9.18
|
9.18
|
8.42
|
2.34
|
8.00
|
26.00
|
<0.01
|
<0.1
|
|
WSR3
|
Avg.
|
32.96
|
8.50
|
8.49
|
8.24
|
1.93
|
4.13
|
24.64
|
<0.01
|
<0.1
|
|
Min.
|
32.02
|
7.93
|
7.88
|
8.07
|
1.57
|
2.50
|
23.38
|
<0.01
|
<0.1
|
|
Max.
|
33.95
|
9.07
|
9.02
|
8.43
|
2.24
|
8.00
|
25.77
|
<0.01
|
<0.1
|
|
WSR4
|
Avg.
|
33.03
|
8.66
|
8.63
|
8.21
|
1.96
|
4.23
|
24.62
|
<0.01
|
<0.1
|
|
Min.
|
32.47
|
7.87
|
7.88
|
8.06
|
1.49
|
2.50
|
23.53
|
<0.01
|
<0.1
|
|
Max.
|
33.71
|
9.19
|
9.14
|
8.34
|
2.25
|
10.00
|
26.10
|
<0.01
|
<0.1
|
|
WSR16
|
Avg.
|
33.01
|
8.68
|
8.69
|
8.21
|
2.02
|
3.96
|
24.60
|
<0.01
|
<0.1
|
|
Min.
|
32.25
|
7.92
|
7.96
|
8.09
|
1.56
|
2.50
|
23.33
|
<0.01
|
<0.1
|
|
Max.
|
33.85
|
9.21
|
9.16
|
8.36
|
2.26
|
10.00
|
25.98
|
<0.01
|
<0.1
|
|
Locations
|
Parameters
|
|
Salinity
(ppt)
|
Dissolved Oxygen (mg/L)
|
pH
|
Turbidity
(NTU)
|
Suspended Solids (mg/L)
|
Temp. (oC)
|
TRC
(mg/L)
|
Iron (mg/L)
|
|
Surface & Middle
|
Bottom
|
|
WSR33
|
Avg.
|
33.06
|
8.80
|
8.81
|
8.26
|
1.82
|
3.92
|
24.62
|
<0.01
|
<0.1
|
|
Min.
|
32.29
|
7.73
|
7.75
|
8.12
|
1.43
|
2.50
|
23.28
|
<0.01
|
<0.1
|
|
Max.
|
33.92
|
9.40
|
9.48
|
8.42
|
2.27
|
17.00
|
25.87
|
<0.01
|
<0.1
|
|
WSR36
|
Avg.
|
33.04
|
8.58
|
8.57
|
8.24
|
1.89
|
3.50
|
24.58
|
<0.01
|
<0.1
|
|
Min.
|
32.37
|
7.77
|
7.78
|
8.14
|
1.36
|
2.50
|
23.18
|
<0.01
|
<0.1
|
|
Max.
|
34.19
|
9.58
|
9.59
|
8.40
|
2.29
|
8.00
|
26.02
|
<0.01
|
<0.1
|
|
WSR37
|
Avg.
|
33.14
|
8.47
|
8.49
|
8.29
|
1.97
|
3.86
|
24.57
|
<0.01
|
<0.1
|
|
Min.
|
32.36
|
7.85
|
7.90
|
8.14
|
1.52
|
2.50
|
23.31
|
<0.01
|
<0.1
|
|
Max.
|
33.93
|
9.67
|
9.62
|
8.43
|
2.28
|
11.00
|
25.84
|
<0.01
|
<0.1
|
|
NF1
|
Avg.
|
33.00
|
8.63
|
8.62
|
8.22
|
1.96
|
3.94
|
24.60
|
<0.01
|
<0.1
|
|
Min.
|
32.27
|
7.96
|
7.90
|
8.06
|
1.55
|
2.50
|
23.63
|
<0.01
|
<0.1
|
|
Max.
|
33.81
|
9.37
|
9.39
|
8.39
|
2.42
|
9.00
|
25.92
|
<0.01
|
<0.1
|
|
NF2
|
Avg.
|
33.14
|
8.47
|
8.47
|
8.22
|
1.90
|
4.27
|
24.61
|
<0.01
|
<0.1
|
|
Min.
|
32.43
|
7.96
|
7.90
|
8.07
|
1.50
|
2.50
|
23.41
|
<0.01
|
<0.1
|
|
Max.
|
33.79
|
9.25
|
9.16
|
8.35
|
2.24
|
13.00
|
25.91
|
<0.01
|
<0.1
|
|
NF3
|
Avg.
|
33.09
|
8.56
|
8.54
|
8.27
|
1.95
|
4.37
|
24.64
|
<0.01
|
<0.1
|
|
Min.
|
32.13
|
7.99
|
8.09
|
8.14
|
1.46
|
2.50
|
23.52
|
<0.01
|
<0.1
|
|
Max.
|
33.81
|
9.54
|
9.55
|
8.42
|
2.44
|
15.00
|
26.00
|
<0.01
|
<0.1
|
Notes:
i.
"Avg",
��Min�� and ��Max�� is the average,
minimum and maximum respectively of the data from measurements conducted under
mid-flood and mid-ebb tides at three water depths, except that of
DO where the data for ��Surface
& Middle�� and ��Bottom�� are calculated separately.
ii.
Measurement data of Suspending Solids
would be rounding
to 2.5mg/L if the value was less than 2.5mg/L
to facilitate data analysing.
4.
Waste
4.1.
The waste generated from this
Contract includes inert construction and demolition (C&D) materials, and
non-inert C&D materials. Non-inert C&D
materials are made up
of general refuse, vegetative wastes and recyclable wastes such as plastics and paper/cardboard packaging
waste. Steel materials generated from the Contract are also grouped into
non-inert C&D materials as the materials were not disposed of with other
inert C&D materials. With reference to relevant handling records and trip
tickets of this Contract, the quantities of different types of waste generated
in the reporting month are summarized in Table
4.1. Details of cumulative waste management data are presented as a waste
flow table in Appendix H.
Table 4.1 Quantities of Waste Generated
from the Contract
during the reporting period
|
Reporting
Month
|
Actual Quantities of Inert C&D Materials Generated Monthly
|
Actual Quantities of C&D Wastes
Generated Monthly
|
|
Total Quantity Generated
|
Hard Rock and Large Broken Concrete
|
Reused in the
Contract
|
Reused in other Projects
|
Disposed as Public Fill
|
Imported Fill
|
Metals
|
Paper / cardboard packaging
|
Plastics (1)
|
Chemical Waste
|
Others, e.g., general refuse
|
|
(in ��000kg)
|
(in ��000kg)
|
(in ��000kg)
|
(in ��000kg)
|
(in ��000kg)
|
(in ��000kg)
|
(in ��000kg)
|
(in ��000kg)
|
(in ��000kg)
|
(in ��000kg)
|
(in ��000kg)
|
|
Apr 2024
|
57.130
|
0.000
|
0.000
|
0.000
|
57.130
|
0.000
|
0.000
|
0.000
|
0.000
|
0.000
|
47.390
|
Notes: (1) Plastics refer to plastic
bottles / containers, plastic sheets / foam from packaging material
(*)The record in EPD
Transaction Records system was up to 19/04/2024, the data
from 20/4 to 30/4 will be updated
in next reporting period
5.
Landfill Gas Monitoring
Monitoring Requirement
5.1.
In accordance with Section
11 of the EM&A
Manual, monitoring of landfill
gas is required for construction works
within the 250m Consultation Zone.
Part of the desalination plant and the indicative area of natural
slope mitigation works fall within the SENT Landfill Extension Consultation Zone; and part of the 1,200 mm diameter fresh water mains along
Wan Po Road falls within the SENT Landfill and SENT Landfill Extension
Consultation Zones, TKO Stage II/III
Restored Landfill and TKO Stage I
Restored Landfill Consultation Zones.
Monitoring Programme
5.2.
Since part of the desalination plant (Wan Po Road
and MIC compound/Basketball Court) and the indicative area of natural slope
mitigation works fall within the SENT Landfill Extension Consultation Zone in
this contract (Figure 5.1), landfill
gas monitoring would be required for Wan Po Road and MIC compound/Basketball
Court (Figure 5.2) if excavations
were conducted at more than 300mm deep. Although SENT Landfill Extension has
commenced operation since November 2021, no excavation works were conducted at MIC compound/Basketball Court.
Hence no landfill
gas monitoring would be
scheduled for MIC compound/Basketball Court at the current stage.
Monitoring Location
5.3.
Monitoring of oxygen, methane,
carbon dioxide and barometric pressure would be performed for excavations at 1m
depth or more within the consultation Zone.
5.4.
During construction of works
within the consultation zones, excavations of 1m depth or more was monitored:
- At the ground
surface before excavation commences;
- Immediately before any worker enters
the excavation;
- At the beginning of each working
day for the entire period
the excavation remains
open; and
- Periodically through the working day whilst workers
are in the excavation.
5.5.
For excavations between 300mm and 1m deep, measurements were carried out:
- Directly after the excavation has been completed; and
- Periodically whilst the excavation remains
open.
5.6.
The area required to be monitored
for landfill gas in the reporting period
is shown in Figure
5.1.
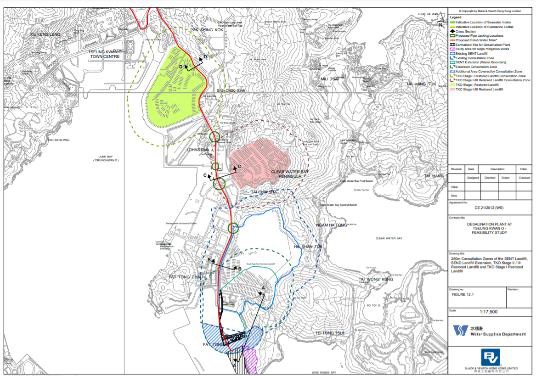
Figure 5.1 Overview
of the SENT Extension Consultation Zone and the Contract Site Area
Monitoring Parameters
5.7.
The landfill gas monitoring
parameters and the action and limit level are summarized in
Table 5.1.
Table 5.1 Action and Limit Level
for Landfill Gas Monitoring Equipment
|
Parameters
|
Action Level
|
Limit Level
|
|
Oxygen (O2)
|
<19% O2
|
<19% O2
|
|
Methane (CH4)
|
>10% LEL
|
>20% LEL
|
|
Carbon Dioxide (CO2)
|
>0.5% CO2
|
>1.5% CO2
|
MONITORING EQUIPMENT
5.8.
Landfill Gas monitoring was carried out using intrinsically-safe, portable multi-gas
monitoring instruments. The gas monitoring equipment is:
-
Complying with the Landfill Gas
Hazard Assessment Guidance Note as intrinsically safe;
-
Capable of continuous barometric pressure and gas pressure measurements;
-
Normally operated in diffusion
mode unless required
for spot sampling, when it should be
capable of operating by means of an aspirator or pump;
-
Having low battery, fault and over range indication incorporated;
-
Capable of storing monitoring data, and shall be capable of being downloaded directly;
-
Measure in the following ranges:
|
methane
|
0-100% Lower Explosion Limit
(LEL) and 0-100%
v/v;
|
|
oxygen
|
0-25% V/V;
|
|
carbon dioxide
|
0-5% v/v;
and
|
|
barometric pressure
|
mBar (absolute)
|
•
alarm (both audibly and visually) in the event that the concentrations of the following
are exceeded:
|
methane
|
>10% LEL;
|
|
oxygen
|
<19%
|
|
carbon dioxide
|
>0.5% by
volume
|
|
barometric pressure
|
mBar (absolute)
|
5.9.
Monitoring equipment used in
the reporting period are summarized in Table 5.2. The Landfill Gas monitoring
equipment calibration certificate is presented in Appendix F.
Table 5.2 Landfill Gas Monitoring Equipment
|
Equipment
|
Brand and Model
|
Calibration Expiry
Date
|
|
Portable Gas Detector
|
GMI PS500 - 25492809/21
|
21 August 2024
|
Figure 5.2 Location Map for Landfill
Gas Monitoring at TKO Area 137 (-0+440
- -0+760)
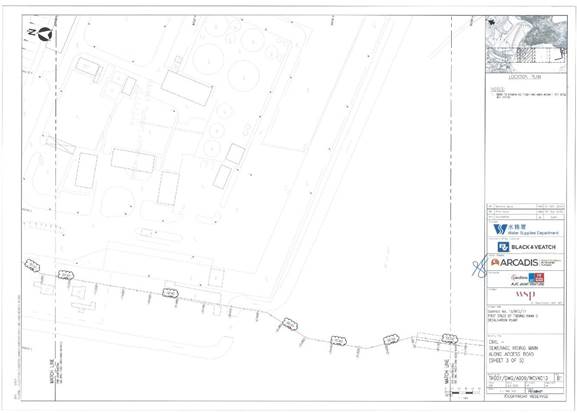 Figure 5.3 Location Map for Landfill
Gas Monitoring at TKO Area 137 (-0+740 - -1+060)
Figure 5.3 Location Map for Landfill
Gas Monitoring at TKO Area 137 (-0+740 - -1+060)
MONITORING
RESULTS AND OBSERVATIONS
5.10. In this reporting
period, 156 times of
landfill gas monitoring were periodically conducted during excavations at 300mm to
1m depth within the consultation zone and whenever workers entered the
excavation on the day at TKO Area 137 (Ch1+120 - Ch1+800) until 20 April 2024.
No exceedances of action level and limit level was observed.
6.
Ecology(Landscape)
Monitoring Requirements
6.1.
In accordance with Section
8.1 of the EM&A Manual,
weekly site audit shall be carried out by the ET include checking whether
good site practices are being properly implemented by the Contractor and the
extent of the works area within the Clear Water Bay Country Park should be
checked by the ET during the weekly site audit.
Site Inspection
6.2.
Weekly site audit was carried
out by the ET in the reporting month, no trespass by the Contractor outside the
works area of the Project and Clear Water Bay Country Park, and no damage
to the vegetation and rocky shore outside
the Project area was observed
in the reporting month. Retained trees was properly protected
during the construction works,
no unacceptable construction works was observed.
6.3.
If non-compliance were found
during the construction works, the actions in accordance with the Event and
Action Plan will be carried out according to Appendix E.
7.
Ecology (Coral Monitoring)
7.1.
Under the approval
conditions of the EIA Report
for the Project, an EM&A
programme on coral for the
pre-operation phase of the Project is recommended. Pursuant to these EIA
approval conditions and Condition 3.1 of the EP and FEP, details of the regular
coral monitoring programme have been proposed based on the baseline coral
monitoring results in the Report on Pre-Operation Baseline Coral Monitoring and
Regular Coral Monitoring Methodology.
Monitoring Location
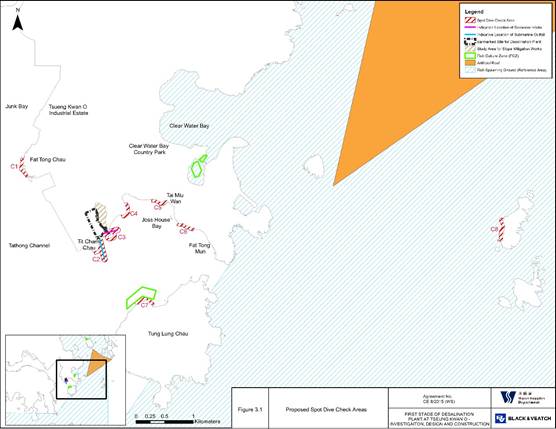
7.2.
In accordance with Appendix
B Section 5.1 of the approved supplementary EM&A Manual, two
indirect impact sites (C2 and C3) and one control site (C8) as shown in Figure 7.1 should be monitored during the pre-operation
Phase. Pre- operation coral survey should be conducted at the indirect
impact and control sites. Ten selected hard coral colonies with similar species
should be tagged at each of the control and indirect impact sites before
commencement of the operation phase. Tagged hard coral colonies should be
monitored in open waters during the pre- operation phase and operation phase.
Figure 7.1 Spot Dive Check Areas
Two Proposed Indirect Impact Sites (C2 and
C3) and one control site (C8) during pre-operation Phase
Action and Limit Levels
7.3.
The Action and Limit
Levels have been set based
on the derivation criteria specified in the EM&A
Manual. The Action/Limit Levels have been derived and are presented in Table 7.1.
Table 7.1 Action and Limit Level
for Coral Monitoring Equipment
|
Parameter
|
Action Level
Definition
|
Limit Level Definition
|
|
Mortality
|
If during Impact
Monitoring a 15% increase in the percentage of partial mortality on the corals occurs at more than 20% of the
tagged indirect impact
site coral colonies that is not recorded on the tagged corals at the
control site, then the Action Level is exceeded
|
If during Impact
Monitoring a 25% increase in the percentage of partial mortality on the corals occurs at more than 20% of the
tagged indirect impact
site coral colonies that is not recorded on
the tagged corals at the control site, then the Limit Level is exceeded
|
Note: If the defined
Action Level or Limit Level for coral monitoring is exceeded, the actions as set out in
Table
E3 of Appendix E will be implemented.
7.4.
If non-compliance were found
during the construction works, the actions in accordance with the Event and
Action Plan will be carried out according to Appendix E.
Monitoring Frequency
7.5.
Pre-operation phase coral
monitoring shall be monitored once per month as the requirement of the first
year of operational phase.
Monitoring Result
and Observation
7.6.
Pre-operation phase coral
monitoring works was conducted on 17 April 2024. No
sediment, bleaching or increased mortality in the general condition of all
tagged coral colonies were observed during the monthly pre-operation phase
monitoring period. No deterioration
of the coral community was observed in the ecological monitoring results when
compared with the baseline ecological monitoring results. There is no AL/LL
exceedance during the monitoring period.
7.7.
The details of the monitoring carried
out on 17 April 2024 is presented in Appendix I.
8.
Ecology (Fishery Monitoring)
8.1.
The purpose of the
pre-operation phase regular fisheries monitoring programme is to monitor the
potential impacts on fisheries resources in the vicinity of the project site.
Apart from the regular fisheries monitoring programme, a water quality
monitoring programme in addition to the water quality monitoring programme in the
approved EM&A Manual is also described in Section 2.4 to (i) provide
supplementary information in the interpretation of the findings of the
fisheries monitoring and (ii) assist the monitoring of the potential impact on the Tung Lung Chau Fish Culture Zone (FCZ) in Joss
House Bay.
Monitoring Location
8.2.
In accordance with Section 2.3
of the approved Methodology Paper on Regular Fisheries Monitoring, it is
recommended to set up six (6) fisheries monitoring locations in Joss House Bay
and its vicinity to monitor the fisheries resources.
8.3.
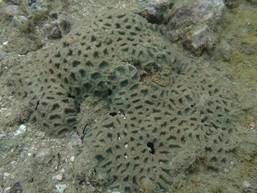
Two (2) sampling locations are
set up in close proximity of the direct footprint of the proposed submarine
utilities around TKO Area 137. These sampling locations represent the potential
Project impact zones (i.e. areas at and in close proximity to the footprint of
the proposed submarine utilities that will be directly affected by the Project
works).
8.4.
Two (2) gradient locations are
proposed between the proposed submarine utilities and Tung Lung Chau FCZ to
assist in the interpretation and identification of any potential fisheries
impact in the vicinity of the FCZ.
8.5.
Two (2) reference locations are proposed in the outer
Joss House Bay between the waters
of Tung Lung Chau and Fat Tong Mun. These reference locations
are further away and will not be affected by the Project
discharge (based on the EIA prediction) and will serve as control stations. Any
significant fisheries impact identified at the reference locations should be caused by other natural
factors or non-Project activities. The trends
of fisheries conditions
recorded in the reference locations will be
used to assist in the interpretation of the trends of fisheries impact
identified in the impact and gradient locations.
8.6.
The coordinates of the proposed monitoring locations are shown in Figure 8.1.
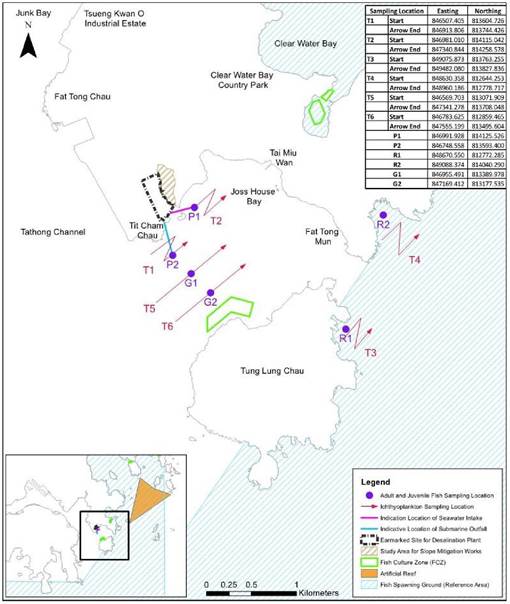
Figure 8.1 Monitoring location
of regular fishery
monitoring during pre-operation Phase
Monitoring Frequency
8.7.
Pre-operation phase fishery monitoring shall be carried out 2
times in wet season (April to
October) and 2 times in dry season (November to March) to examine the
following:
-
Fish species composition;
-
Abundance: number
of fish captured;
-
Diversity of fish resources: species diversity and evenness;
-
Size: range of total length; Biomass
in weight; and
-
Values of catches of commercial
species: catch per unit effort (CPUE) and yield per unit effort (YPUE).
Monitoring Result
and Observation
8.8.
Pre-operation phase fishery
monitoring for dry season 2024 was carried out on 17
and 24 February 2024. The survey findings showed that the abundance and
diversity of fish eggs and larvae are on the low side for the Study Area, and
the abundance and diversity of juveniles are very low for
the Study Area. Survey findings
also showed that there was a
very week relationship in recorded
families between ichthyoplankton assemblages, adult
fish and juvenile fish in the Study Area, which
implies that the Study Area does not appear
to be an important spawning or nursery grounds for commercial fishes. The
detailed result of the monitoring is presented in Appendix I.
9.
Summary
of Exceedance, Complaints,
Notification of Summons and Prosecutions
9.1.
The Environmental Complaint Handling
Procedure is shown in below Figure 9.1:
Figure 9.1 Environmental Complaint
Handling Procedures
9.2.
No noise monitoring was
conducted during the reporting period since there are no Contract-related
construction activities undertaken within a radius of 300m from the monitoring
locations. No action Level exceedance for construction noise monitoring was recorded in the reporting month.
9.3.
Construction phase general water quality monitoring at the ten monitoring stations (CE, CF, WSR1,
WSR2, WSR3, WSR4, WSR16, WSR33, WSR36 and WSR37) are ceased from 1 September 2023 due to the completion of marine-related construction works.
9.4.
Pre-operation phase EM&A
works for water quality were conducted at the thirteen monitoring stations
(CE, CF, WSR1,
WSR2, WSR3, WSR4,
WSR16, WSR33, WSR36,
WSR37 NF1, NF2 and NF3) during
the reporting period
in accordance with the EM&A
Manual
9.5.
The additional marine water
quality monitoring was conducted at the thirteen monitoring stations on 2, 4, 6, 9, 11, 13, 16, 18, 20, 23, 25, 27 and 30 April
2024.
9.6.
Thirty-eight
(38) of the pre-operation phase water quality
monitoring results of SS obtained had exceeded the Action Level. Twenty-two (22) of the pre-operation phase water quality
monitoring results of SS obtained
during the reporting period had exceeded the Limit Level. After
investigation, all exceedances were concluded unrelated to the Project.
9.7.
Pre-operation phase coral
monitoring works was conducted on 17 April 2024.
No sediment, bleaching or increased mortality in the general condition of all
tagged coral colonies were observed during the monthly pre-operation phase
monitoring period. No deterioration
of the coral community was observed in the ecological monitoring results when
compared with the baseline ecological monitoring results. There is no AL/LL
exceedance during the monitoring period.
9.8.
Pre-operation phase fishery
monitoring for dry season 2024 was carried out on 17
and 24 February 2024. The detailed result of the monitoring is present
in Appendix I.
9.9.
In this reporting period,
156 times of
landfill gas monitoring were periodically conducted at TKO Area 137 (Ch1+120 - Ch1+800) until 20 April 2024. No exceedances of action level and limit level was observed.
9.10.
No environmental complaint, notification of summons and prosecution
Statistics on complaint and notification of summons and prosecution are summarized in Appendix K.
10.
EM&A Site Inspection
10.1.
Site inspections were carried
out on a weekly basis to monitor the implementation of proper environmental
pollution control and mitigation measures under the Contract. In the reporting
period, site inspections were carried out on 2, 9, 16,
23 and 29 April 2024 at the site portions listed in Table 10.1 below.
Table 10.1 Summaries of Site Inspection Record
|
Date
|
Inspected Site
Portion
|
Time
|
|
2 April
2024
|
TKO Area
137
|
14:30 - 15:30
|
|
9 April 2024
|
TKO Area 137
|
14:30 - 15:30
|
|
16 April
2024
|
TKO Area 137
|
14:30 - 15:30
|
|
23 April 2024
|
TKO Area 137
|
14:30 - 15:30
|
|
29 April 2024
|
TKO Area 137
|
09:15 - 12:30
|
10.2. Joint site inspections with IEC was carried out on 29 April
2024.
10.3. Environmental deficiencies were observed during weekly site
inspection. Key observations during the site inspections and during the reporting period are summarized in Table 10.2.
Table 10.2 Site Observations
|
Date
|
Environmental Observations
|
Follow-up Status
|
|
2 Apr 2024
|
No major environmental deficiency was observed.
|
N/A
|
|
9 Apr 2024
|
No major environmental deficiency was observed.
|
N/A
|
|
16 Apr 2024
|
No major
environmental deficiency was
observed.
|
N/A
|
|
23 Apr 2024
|
No major environmental deficiency was observed.
|
N/A
|
|
29 Apr 2024
|
No major
environmental deficiency was observed.
|
N/A
|
10.4.
According to the EIA Study Report,
Environmental Permit, contract
documents and EM&A Manual, the mitigation measures
detailed in the documents should be implemented as much as practical during the
reporting period. An updated Implementation Status of Environmental Mitigation
Measures (EMIS) is provided in Appendix C.
Site inspection proforma of the reporting period is provided in Appendix J.
11.
Future Key Issues
11.1. Works to be undertaken in the next reporting month
are:
|
Administration Building
-
Installation of ceiling
-
Painting works
-
Installation of sanitary fitting
-
Installation of vinyl flooring
-
Installation of Aluminium Fins
-
Installation of Internal partition wall and ceiling
-
External wall
finishing works
-
Installation of AP doors
and cat ladders
-
Installation of wood decking
-
Minor Installation of building services, cable laying
and termination, Photovoltaic Panel Installation, Testing
& Commissioning
|
|
Chemical building
-
External wall painting works
-
Defect rectification
|
|
Main Electrical &
Central Chiller Plant
Building
-
Minor Installation of building services, electrical switchboard, cable laying,
pressure test
-
Ladder and Cover installation at Roof
|
|
ActiDAFF
-
Sealing gap and wall openings
-
Installation of signage
-
Minor Installation of mechanical equipment, building services, minor cable laying
and termination, Installation of Fibre Reinforced Polymer Cover, Testing
& Commissioning
|
|
Product Water Storage Tank Building
-
Installation of signage
-
Installation of cladding
works
-
Tiling work at Roof Slab on Tank
A
-
Ladder and Cover installation
at Roof
-
Roof Tiles installation
-
Minor Installation of
building services, cable laying and termination, Testing & Commissioning
|
|
OSCG Building
-
Core Opening at Cladding
-
Installation of cladding
works
-
Installation of Railing on Brine
Maker Tank
|
|
-
Installation of building services,
mechanical equipment and cable
laying and
termination, testing and commissioning and
pressure test
|
|
Reverse Osmosis Building
-
Installation of AP doors
-
Installation of sanitary fitting
-
Sanitary Ware Installation in Toilet
-
Tiling Work in Toilet
-
Installation of Water Meter
Cabinets
-
Installation of building services, electrical switchboard of cable laying
and
termination, Minor Installation of mechanical equipment and raised floor,
testing and commissioning, Photovoltaic Panel Installation
|
|
Post Treatment Building
-
DFMA Gap Seal Up
-
Minor Installation of building services, Minor Installation of mechanical
equipment, Cable laying and termination, Pressure Test
|
|
Inspection corridor
-
Interior painting works
-
Interior fitting
out works
|
|
Combined Shaft and
Pump room
-
Installation of outfall grating and defect rectification .
-
Minor cable laying and
termination, testing and
commissioning Guard House
-
Guard house A defect
rectification
-
Guard house B defect
rectification
-
Minor Cable laying and Termination
Slope Work
-
Drilling; Rock anchors installation, Rock break, Concreting Other
-
Watermain installation works at CLP
132 Kv Substation
-
Underground utility
rectification work for Manhole and
Draw pit
-
Underground utility
Construction Work for Watermain water
-
Underground utility
repair Work for Sewerage, Watermains work)
-
Security Fence
footing construction work
-
Light Pole installation work
-
Road Construction
-
Footpath Construction
-
Landscape Construction
-
Irrigation System
installation
-
Landscape planting work
-
Traffic signage
work
-
Workshop construction work, Tiling work,
green roof and irrigation pipe
|
|
-
Workshop Building Services Installation, cable
laying and termination
-
Tiling work and cladding installation for Elevated Walkway
-
Master meter defect rectification
-
Wave deflector Wall
|
11.2. The major environmental impacts brought by the above construction works will include:
-
Construction dust and noise generation from excavation, construction works and
slope work; and
-
Waste generation from construction activities.
11.3.
The key environmental mitigation measures for the Project in the coming reporting
period associated with the above construction works will include:
-
Dust suppression by regular
wetting and water spraying for construction works;
-
Reduction of noise from equipment and machinery on-site
by regular checking of on-site plant/vehicle to
ensure proper functioning;
-
Sorting and storage of general refuse
and construction waste;
-
Deployment of silt curtain
at the inshore water outflow;
and
-
Deployment protective fencing
for trees
12.
Conclusions and Recommendations
12.1.
This is the 50th Monthly EM&A Report for the Project which summarizes the key findings of the
EM&A programme during the reporting period from 1
April to 30 April 2024, in accordance
with the EM&A Manual and the requirement under FEP-01/503/2015/B.
12.2. No noise monitoring was conducted in the reporting period due to the
construction activities not being undertaken within a radius of 300m from the
monitoring locations.
12.3. The construction phase marine water
quality programme was ceased from 1
September 2023 due to the completion of marine-related construction works.
12.4.
The EM&A works for
Pre-operation phase water quality were conducted during the reporting period in
accordance with the EM&A Manual. Thirty-eight (38)
of the pre- operation phase water quality monitoring results of SS obtained had exceeded the Action
Level. Twenty-two (22) of the pre-operation phase water quality
monitoring results of SS
obtained during the reporting period
had exceeded the Limit Level.
After investigation, all exceedances were concluded unrelated
to the Project.
12.5. Pre-operation phase coral monitoring works was conducted on 17 April 2024. No sediment, bleaching or increased
mortality in the general condition of all tagged coral colonies were observed
during the monthly pre-operation phase monitoring period. No deterioration of the coral community
was observed in the ecological monitoring results when compared with the
baseline ecological monitoring results. There is no AL/LL exceedance during the
monitoring period.
12.6. Pre-operation phase fishery monitoring for dry season 2024 was
carried out on 17 and 24 February 2024. The survey findings showed that the
abundance and diversity of fish eggs and larvae are on the low side for the
Study Area, and the abundance and diversity of
juveniles are very low for the
Study Area. Survey
findings also showed
that there was a
very week relationship in recorded
families between ichthyoplankton assemblages, adult
fish and juvenile fish in the Study Area, which
implies that the Study Area does not appear
to be an important spawning or nursery grounds for commercial fishes. The
detailed result of the monitoring is presented in Appendix I.
12.7. In this reporting period, 156 times of
landfill gas monitoring were periodically conducted at TKO Area 137 (Ch1+120 - Ch1+800) until 20 April
2024. No exceedances of action level and limit level was observed.
12.8. Weekly environmental site inspections were conducted during the
reporting period. Observations and reminders were reported during the site
inspections. All items are rectified within
the reporting period. The environmental performance of the
project was therefore considered satisfactory.
12.9. According to the environmental site inspections performed in the
reporting month, the Contractor is reminded to pay attention on chemical
storage, site hygiene and dust suppression mitigation measures.
12.10. No environmental
complaint, notification of summons and prosecution was received in the
reporting period.
12.11. The ET will keep track on the construction works to confirm
compliance of environmental requirements and the proper
implementation of all necessary mitigation measures.
Appendix A
Master Programme
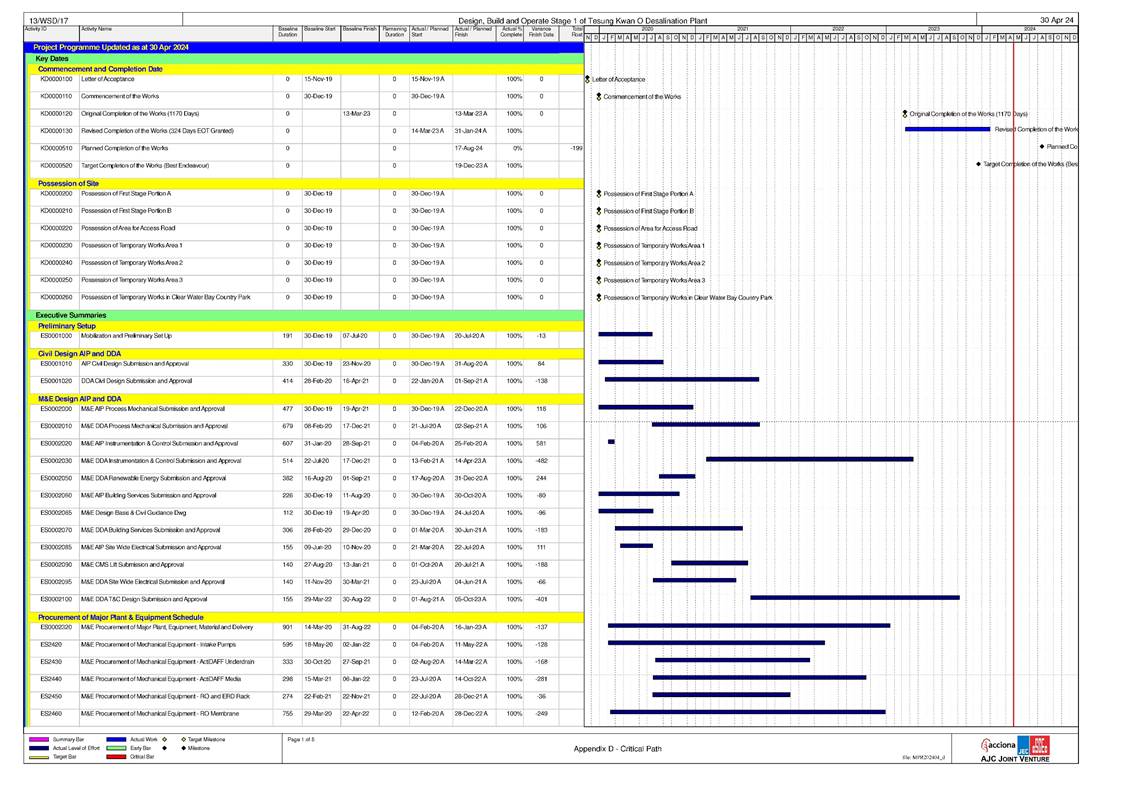
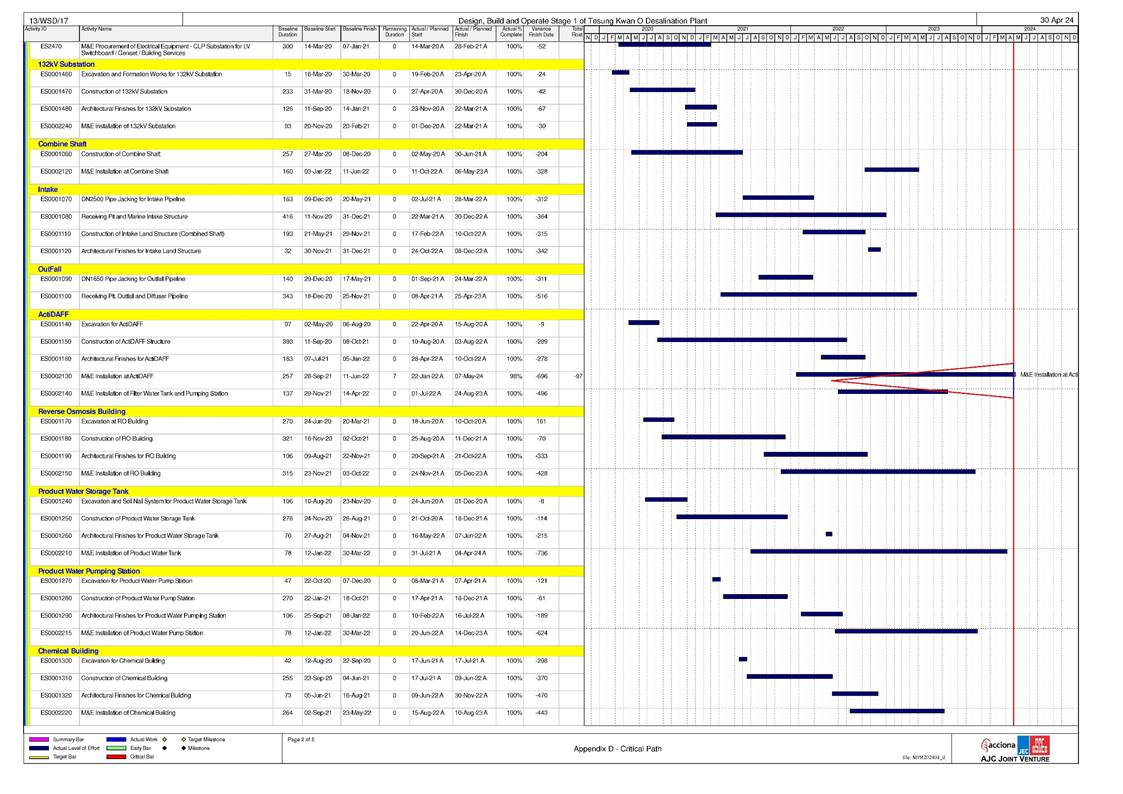
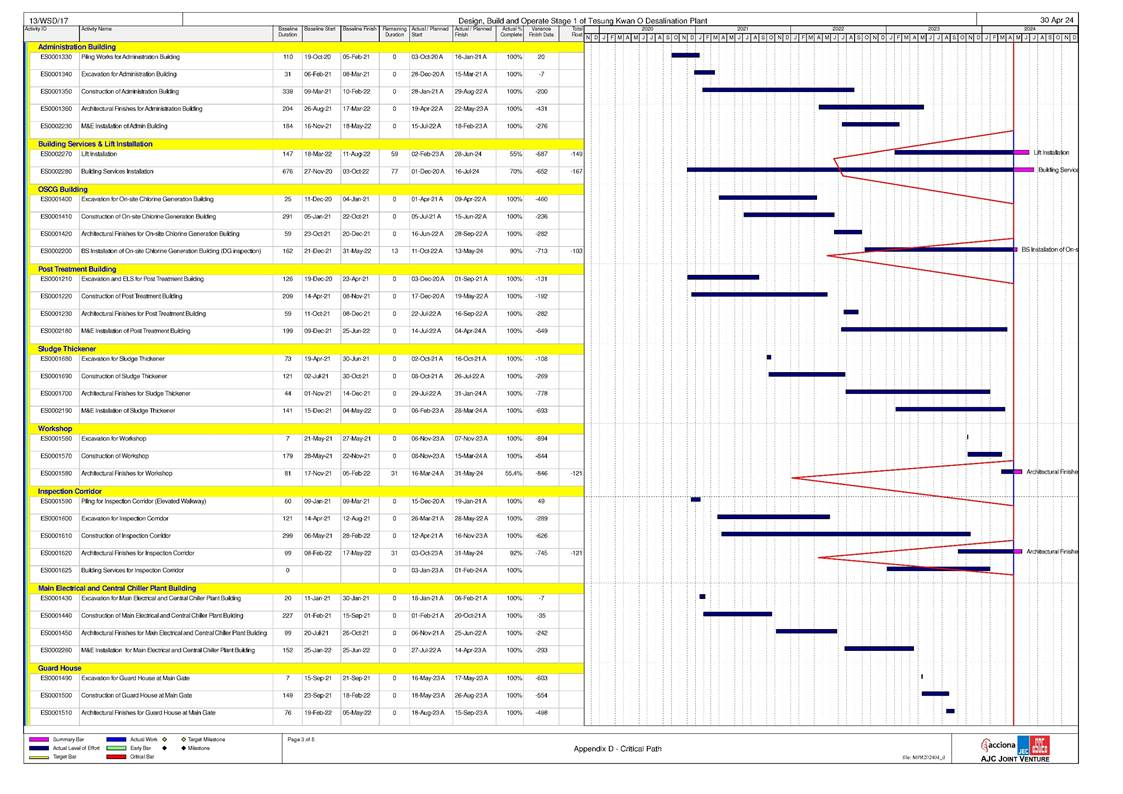

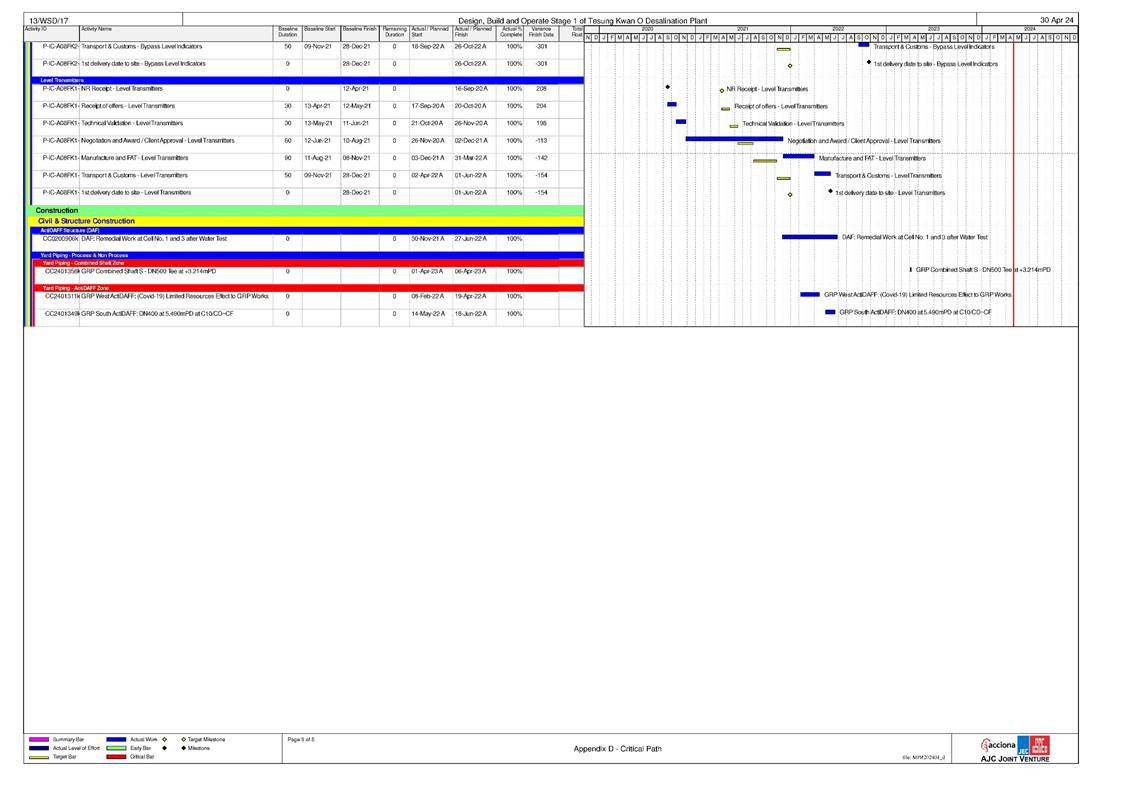
Appendix B
Overview of Desalination Plant in Tseung Kwan O
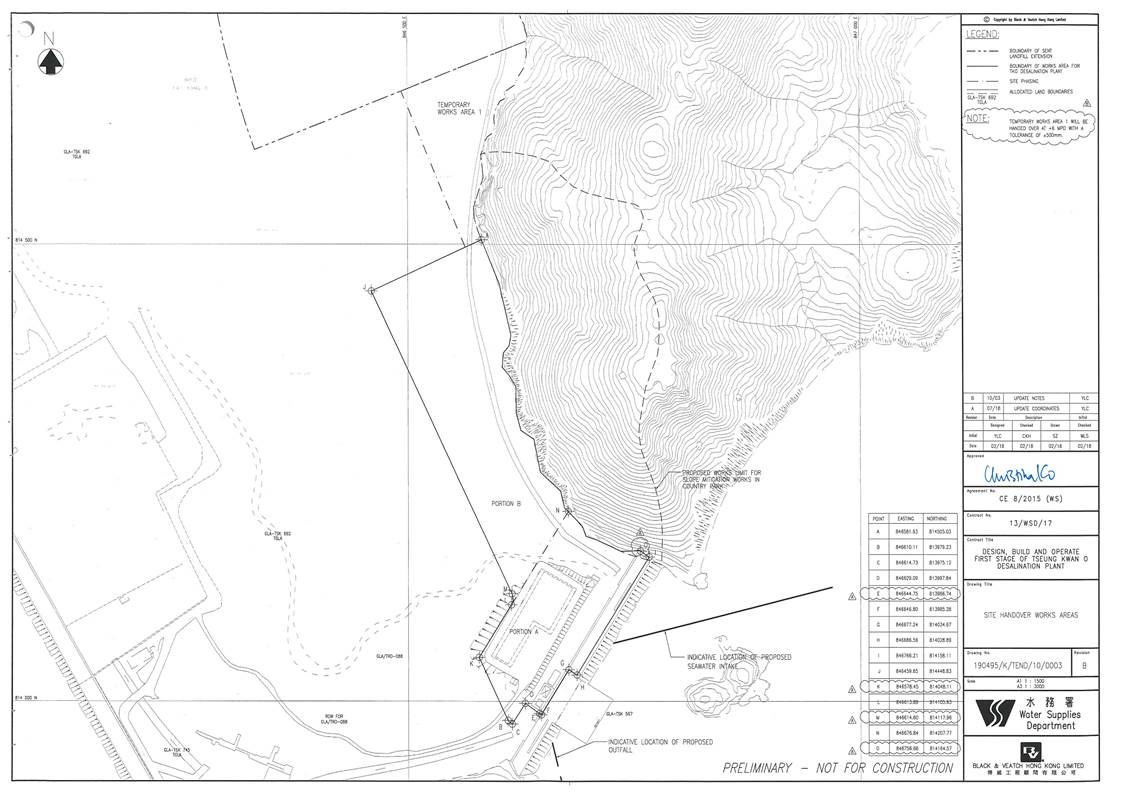
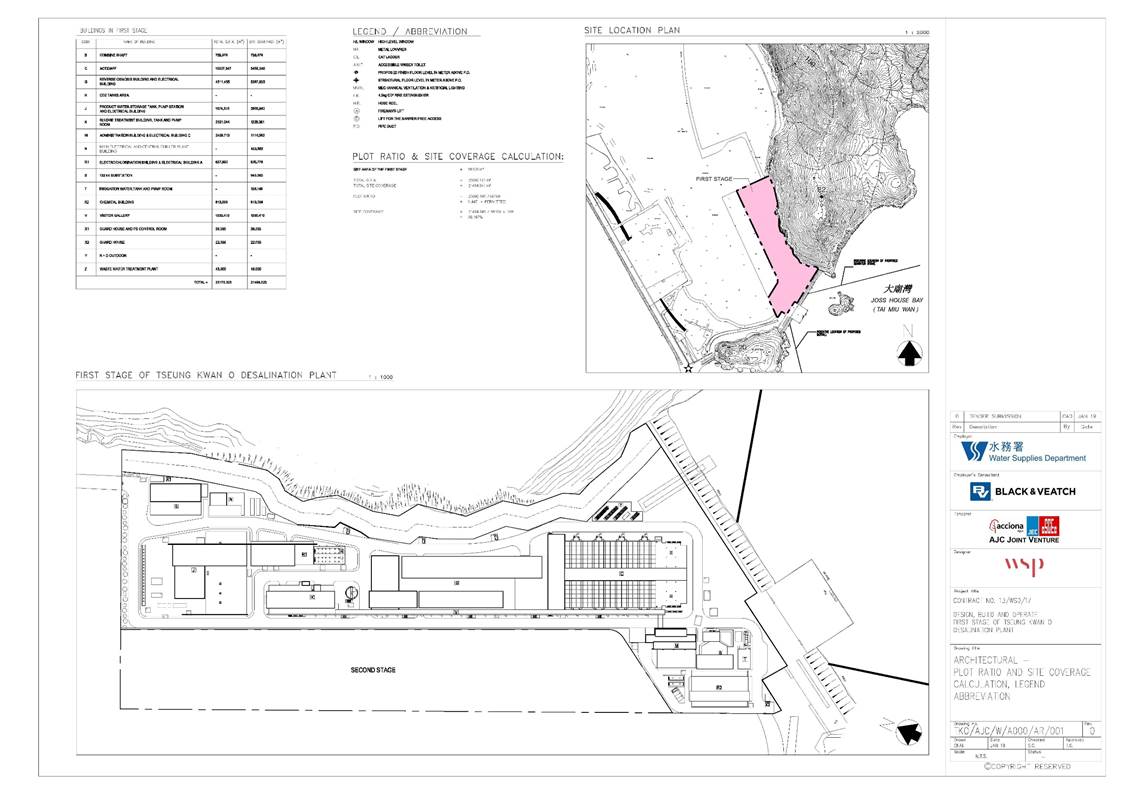
Appendix
C
Summary of Implementation Status of Environmental Mitigation
|
EIA
Reference
|
Recommended Environmental Protection Measures/ Mitigation Measures
|
Objectives of the recommended measures & main concerns to address
|
Implementation Agent
|
Implementation Stage
|
Implementation status
|
Relevant Legislation & Guidelines
|
|
D
|
C
|
O
|
|
Air Quality
|
|
|
S4.8.1
|
Impervious dust screen or sheeting will be provided to enclose scaffolding from the ground floor level of building for construction of superstructure of the new buildings.
|
Land site/ During Construction
|
Contractor(s)
|
|
ü
|
|
Implemented
|
Air Pollution Control (Construction Dust)
|
|
S4.8.1
|
Impervious sheet will be provided for skip hoist for material transport.
|
Land site/ During Construction, particularly dry season
|
Contractor(s)
|
|
ü
|
|
NA
|
-
|
|
S4.8.1
|
The area where dusty work takes place should be sprayed with water or a dust suppression chemical immediately prior to, during and immediately after dusty activities as far as practicable.
|
Land site/ During Construction
|
Contractor(s)
|
|
ü
|
|
Implemented
|
-
|
|
S4.8.1
|
All dusty materials should be sprayed with water or a dust suppression chemical immediately prior to any loading, unloading or transfer operation.
|
Land site/ During Construction
|
Contractor(s)
|
|
ü
|
|
Implemented
|
-
|
|
S4.8.1
|
Dropping heights for excavated materials should be controlled to a practical height to minimize the fugitive dust arising from unloading.
|
Land site/ During Construction
|
Contractor(s)
|
|
ü
|
|
Implemented
|
-
|
|
S4.8.1
|
During transportation by truck, materials should not be loaded to a level higher than the side and tail boards and should be dampened or covered before transport.
|
Land site/ During Construction
|
Contractor(s)
|
|
ü
|
|
Implemented
|
-
|
|
S4.8.1
|
Wheel washing device should be provided at the exits of the work sites. Immediately before leaving a construction site, every vehicle shall be washed to remove any dusty material from its body and wheels as far as practicable.
|
Land site/ During Construction
|
Contractor(s)
|
|
ü
|
|
Implemented
|
-
|
|
S4.8.1
|
Road sections between vehicle-wash areas and vehicular entrance will be paved.
|
Land site/ During Construction
|
Contractor(s)
|
|
ü
|
|
Implemented
|
-
|
|
S4.8.1
|
Hoarding of not less than 2.4m high from ground level will be provided along the length of the Project Site boundary.
|
Land site/ During construction
|
Contractor(s)
|
ü
|
ü
|
|
N/A
|
-
|
|
S4.8.1
|
Haul roads will be kept clear of dusty materials and will be sprayed with water so as to maintain the entire road surface wet at all times.
|
Land site/ During construction
|
Contractor(s)
|
|
ü
|
|
Implemented after reminder
|
-
|
|
EIA
Reference
|
Recommended Environmental Protection Measures/ Mitigation Measures
|
Objectives of the recommended measures & main concerns to address
|
Implementation Agent
|
Implementation Stage
|
Implementation status
|
Relevant Legislation & Guidelines
|
|
D
|
C
|
O
|
|
S4.8.1
|
Temporary stockpiles of dusty materials will be either covered entirely by impervious sheets or sprayed with water to maintain the entire surface wet all the time.
|
Land site/ During construction
|
Contractor(s)
|
|
ü
|
|
Implemented after reminder
|
-
|
|
S4.8.1
|
Stockpiles of more than 20 bags of cement, dry pulverised fuel ash and dusty construction materials will be covered entirely by impervious sheeting sheltered on top and 3-sides.
|
Land site/ During construction
|
Contractor(s)
|
|
ü
|
|
Implemented
|
-
|
|
S4.8.1
|
All exposed areas will be kept wet always to minimise dust emission.
|
Land site/ During construction
|
Contractor(s)
|
|
ü
|
|
Implemented
|
-
|
|
S4.8.1
|
Ultra-low-sulphur diesel (ULSD) will be used for all construction plant on-site, as defined as diesel fuel containing not more than 0.005% sulphur by weight) as stipulated in Environment, Transport and Works Bureau Technical Circular (ETWB-TC(W)) No 19/2005 on Environmental Management on Construction Sites.
|
Land site/ During construction/ During Operation
|
Contractor(s)
|
|
ü
|
ü
|
Implemented
|
Environment, Transport and Works Bureau Technical Circular (ETWB- TC(W)) No 19/2005 on
Environmental Management on Construction Sites
|
|
S4.8.1
|
The engine of the construction equipment during idling will be switched off.
|
Land site/ During construction
|
Contractor(s)
|
|
ü
|
|
Implemented
|
-
|
|
S4.8.1
|
Concrete batching plant will be required on site. control measures recommended in the Guidance Note on a Best Practicable Means for Cement Works (Concrete Batching Plant) (BPM 3/2 (93)) will be implemented. The control measures recommended in the Guidance Note on a Best Practicable Means for Cement Works (Concrete Batching Plant) (BPM 3/2 (93)) will be implemented.
|
Land site/ During construction
|
Contractor(s)
|
|
ü
|
|
N/A
|
-
|
|
S4.8.1
|
Regular maintenance of construction equipment deployed on-site will be conducted to prevent black smoke emission.
|
Land site/ During construction
|
Contractor(s)
|
|
ü
|
|
Implemented after observation
|
-
|
|
S4.10
|
To ensure proper implementation of the recommended dust mitigation measures and good construction site practices during the construction phase, environmental site audits on weekly basis is recommended throughout the construction period.
|
Land site/ During construction
|
Contractor(s)/ Environmental Team (ET) & Independent Environmental Checker (IEC)
|
|
ü
|
|
Implemented
|
-
|
Note: D - Design stage C - Construction O - Operation
|
EIA
Reference
|
Recommended Environmental Protection Measures/ Mitigation Measures
|
Objectives of the recommended measures & main concerns to address
|
Implementation Agent
|
Implementation Stage
|
Implementation status
|
Relevant Legislation & Guidelines
|
|
D
|
C
|
O
|
|
Noise
|
|
S5.7
|
Only well-maintained plant will be operated on-site and plant will be serviced regularly during the construction phase.
|
All area/ During construction
|
Contractor(s)
|
|
ü
|
|
Implemented
|
A Practical Guide for the Reduction of Noise from Construction Works
|
|
S5.7
|
Silencers or mufflers on construction equipment will be utilised and will be properly maintained during the construction phase.
|
Noise control/ During construction
|
Contractor(s)
|
|
ü
|
|
N/A
|
A Practical Guide for the Reduction of Noise from Construction Works
|
|
S5.7
|
Mobile plant, if any, will be sited as far away from NSRs as possible.
|
Noise control/ During construction
|
Contractor(s)
|
|
ü
|
|
N/A
|
A Practical Guide for the Reduction of Noise from Construction Works
|
|
S5.7
|
Machines and plant (such as trucks) that may be in intermittent use will be shut down between work periods or will be throttled down to a minimum.
|
Noise control/ During construction
|
Contractor(s)
|
|
ü
|
|
Implemented
|
A Practical Guide for the Reduction of Noise from Construction Works
|
|
S5.7
|
Plants known to emit noise strongly in one direction will, wherever possible, be orientated so that the noise is directed away from the nearby NSRs.
|
Noise control/ During construction
|
Contractor(s)
|
|
ü
|
|
N/A
|
A Practical Guide for the Reduction of Noise from Construction Works
|
|
S5.7
|
Material stockpiles and other structures will be effectively utilised, wherever practicable, in screening noise from on-site construction activities.
|
Noise control/ During construction
|
Contractor(s)
|
|
ü
|
|
N/A
|
A Practical Guide for the Reduction of Noise from Construction Works
|
|
S5.7
|
Use of Quite Powered Mechanical Equipment (QPME).
|
Noise control/ During construction
|
Contractor(s)
|
|
ü
|
|
Implemented
|
A Practical Guide for the Reduction of Noise from Construction Works
|
|
S5.7
|
Movable noise barriers of 3m in height with skid footing should be used and located within a few metres of stationary plant and mobile plant such that the line of sight to the NSR is blocked by the barriers. The length of the barrier should be at least five times greater than its height. The noise barrier material should have a superficial surface density of at least 7 kg m-2 and have no o or
gappeningss.
|
Noise control/ During construction
|
Contractor(s)
|
|
ü
|
|
N/A
|
A Practical Guide for the Reduction of Noise from Construction Works
|
|
S5.7
|
The noise insulating sheet should be deployed such that there would be no opening or gaps on the joints.
|
Noise control/ During construction
|
Contractor(s)
|
|
ü
|
|
N/A
|
A Practical Guide for the Reduction of Noise from Construction Works
|
|
S5.7
|
Construction activities (e.g. excavation/shoring, reinstatement (asphalt), and pipe jacking) will be planned and carried out in sequence, such that items of PME proposed for these activities will not be operated simultaneously.
|
Noise control/ During construction
|
Contractor(s)
|
ü
|
ü
|
|
Implemented
|
A Practical Guide for the Reduction of Noise from Construction Works
|
|
S5.7
|
PMEs will not be used at the works areas near educational institutions with residual impact (ie the ��influence
area�� within a
|
Noise control / During construction
|
Contractor(s)
|
|
ü
|
|
N/A
|
A Practical Guide for the Reduction of Noise from
|
|
EIA
Reference
|
Recommended Environmental Protection Measures/ Mitigation Measures
|
Objectives of the recommended measures & main concerns to address
|
Implementation Agent
|
Implementation Stage
|
Implementation status
|
Relevant Legislation & Guidelines
|
|
D
|
C
|
O
|
|
|
radius of 40m) during school hours in order to reduce impact to the educational institutions.
|
|
|
|
|
|
|
Construction Works
|
|
S5.7
|
Noise enclosures or acoustic sheds would be used to cover stationary PME such as generators.
Portable/Movable noise enclosure made of material with
superficial surface density of at least 7 kg m-2 may be used for screening the noise from operation of the saw/groover, concrete.
|
Noise control/ Pre- construction/ During construction
|
Contractor(s)
|
ü
|
ü
|
|
N/A
|
-
|
|
S5.9
|
Sawcutting pavement, breaking up of pavement, excavation
/shoring, pipe laying, backfilling, reinstatement (concrete) and pipe jacking shall be scheduled outside the examination period.
|
Noise control/ Pre- construction/ During construction
|
Contractor(s)
|
ü
|
ü
|
|
N/A
|
-
|
|
S5.9
|
In view the duration of noise exceedance at Creative Secondary School, PLK Laws Foundation College, TKO Kei Tak Primary School and School of Continuing and Professional Studies-CUHK is limited to 8 weeks, the construction work in the influence areas near the four schools shall be scheduled during long school holidays (eg summer holiday, Easter holiday or Christmas holiday,
etc) as far as practicable. Scheduling the construction work for the four schools.
|
Noise control/ Pre- construction/ During construction
|
Contractor(s)
|
ü
|
ü
|
|
N/A
|
-
|
|
S5.10
|
A noise monitoring programme shall be implemented for the construction phase.
|
Designated monitoring stations as defined in EM&A Manual/During construction phase
|
Environmental Team
|
|
ü
|
|
N/A
|
-
|
|
S5.10
|
The effectiveness of on-site control measures could also be evaluated through the regular site audits.
|
All facilities/ During construction
|
Contractor(s)/ ET & Independent Environmental Checker
(IEC)
|
|
ü
|
|
Implemented
|
-
|
Note: D - Design stage C - Construction O - Operation
|
EIA
Reference
|
Recommended Environmental Protection Measures/ Mitigation Measures
|
Objectives of the recommended measures & main concerns to address
|
Implementation Agent
|
Implementation Stage
|
Implementation status
|
Relevant Legislation & Guidelines
|
|
D
|
C
|
O
|
|
Water Quality
|
|
S6.9
|
Dredged marine sediment will be disposed of in a gazetted marine disposal area in accordance with marine dumping permit conditions of the Dumping at Sea Ordinance (DASO).
|
Marine Dredging/ During construction
|
Contractor(s)
|
|
ü
|
|
Implemented
|
Dumping at Sea Ordinance (DASO)
|
|
S6.9
|
Disposal vessels will be fitted with tight bottom seals in order to prevent leakage of material during transport.
|
Marine Dredging/ During construction
|
Contractor(s)
|
|
ü
|
|
Implemented
|
-
|
|
S6.9
|
Barges will be filled to a level, which ensures that material does not spill over during transport to the disposal site and that adequate freeboard is maintained to ensure that the decks are not washed by wave action.
|
Marine Dredging/ During construction
|
Contractor(s)
|
|
ü
|
|
Implemented
|
-
|
|
S6.9
|
After dredging, any excess materials will be cleaned from decks and exposed fittings before the vessel is moved from the dredging area.
|
Marine Dredging/ During construction
|
Contractor(s)
|
|
ü
|
|
Implemented
|
-
|
|
S6.9
|
All vessels should be well maintained and inspected before use to limit any potential discharges to the marine environment.
|
Marine Dredging/ During construction
|
Contractor(s)
|
|
ü
|
|
Implemented
|
-
|
|
S6.9
|
All vessels must have a clean ballast system.
|
Marine Dredging/ During construction
|
Contractor(s)
|
|
ü
|
|
Implemented
|
-
|
|
S6.9
|
No discharge of sewage/grey wastewater should be allowed. Wastewater from potentially contaminated area on working vessels should be minimized and collected. These kinds of wastewater should be brought back to port and discharged at appropriate collection and treatment system.
|
Marine Dredging/ During construction
|
Contractor(s)
|
|
ü
|
|
Implemented
|
-
|
|
S6.9
|
No soil waste is allowed to be disposed overboard.
|
Marine Dredging/ During
construction
|
Contractor(s)
|
|
ü
|
|
N/A
|
-
|
|
S6.9
|
Silt removal facilities such as silt traps or sedimentation facilities will be provided to remove silt particles from runoff to meet the requirements of the TM standard under the WPCO. The design of silt removal facilities will be based on the guidelines provided in ProPECC PN 1/94. All drainage facilities and erosion and sediment control structures will be inspected on a regular basis and maintained to confirm proper and efficient operation at all times and particularly during rainstorms. Deposited silt and grit will be removed regularly.
|
Land site & drainage/ During construction
|
Contractor(s)
|
|
ü
|
|
Implemented
|
ProPECC PN 1/94 TM
Standard under the WPCO
|
|
S6.9
|
Earthworks to form the final surfaces will be followed up with surface protection and drainage works to prevent erosion caused by rainstorms.
|
Land site & drainage/ During construction
|
Contractor(s)
|
|
ü
|
|
Implemented
|
-
|
|
EIA
Reference
|
Recommended Environmental Protection Measures/ Mitigation Measures
|
Objectives of the recommended measures & main concerns to address
|
Implementation Agent
|
Implementation Stage
|
Implementation status
|
Relevant Legislation & Guidelines
|
|
D
|
C
|
O
|
|
S6.9
|
Appropriate surface drainage will be designed and provided where necessary.
|
Land site & drainage/ During
construction
|
Contractor(s)
|
|
ü
|
|
Implemented
|
-
|
|
S6.9
|
The precautions to be taken at any time of year when rainstorms are likely together with the actions to be taken when a rainstorm is imminent or forecasted and actions to be taken during or after
rainstorms are summarized in Appendix A2 of ProPECC PN 1/94.
|
Land site & drainage/ During construction
|
Contractor(s)
|
ü
|
ü
|
|
Implemented
|
ProPECC PN 1/94
|
|
S6.9
|
Oil interceptors will be provided in the drainage system where necessary and regularly emptied to prevent the release of oil and grease into the storm water drainage system after accidental spillages.
|
Land site & drainage/ During construction
|
Contractor(s)
|
|
ü
|
|
N/A
|
-
|
|
S6.9
|
Temporary and permanent drainage pipes and culverts provided to facilitate runoff discharge, if any, will be adequately designed for the controlled release of storm flows.
|
Land site & drainage/ During construction
|
Contractor(s)
|
|
ü
|
|
Implemented
|
-
|
|
S6.9
|
The temporary diverted drainage, if any, will be reinstated to the original condition when the construction work has finished or when the temporary diversion is no longer required.
|
Land site & drainage/ During construction
|
Contractor(s)
|
|
ü
|
|
N/A
|
-
|
|
S6.9
|
Appropriate numbers of portable toilets shall be provided by a licensed contractor to serve the construction workers over the construction site to prevent direct disposal of sewage into the water environment.
|
Land site & drainage/ During construction
|
Contractor(s)
|
|
ü
|
|
Implemented
|
-
|
|
S6.9 and S6.12
|
The sterilization water should be dechlorinated with total residual
chlorine (TRC) level below 1 mg/L before discharge to public sewer. In situ testing of TRC should also be conducted for the discharge of chlorinated water for pipeline disinfection to ensure sufficient dechlorination before discharge to public sewer.
|
Sterilization of water mains prior to commissioning
|
Contractor(s)
|
|
ü
|
ü
|
N/A
|
Technical
Memorandum for Effluents Discharged into Drainage and Sewerage Systems Inland and Coastal Waters
|
|
S6.9
|
The cleaning and flushing water should also be treated and desilted to the relevant discharge requirement stipulated in TM-DSS before discharging.
|
Sterilization of water mains prior to commissioning
|
Contractor(s)
|
|
ü
|
ü
|
Implemented
|
|
S6.9
|
Site drainage should be well maintained, and good construction practices should be observed to ensure that oil, fuels, solvents, and other chemicals are managed, stored and handled properly and do
not enter the nearby water streams.
|
Land site & drainage/ During construction/ During operation
|
Contractor(s)
|
|
ü
|
ü
|
Implemented
|
-
|
|
S6.12
|
Regular site inspections will be carried out in order to confirm that regulatory requirements are being met and that contractors are implementing the standard site practice and mitigation measures
as proposed to reduce potential impacts to water quality.
|
During construction
|
Contractor(s)/ ET & IEC
|
|
ü
|
|
Implemented
|
-
|
Note: D - Design stage C - Construction O - Operation
|
EIA
Reference
|
Recommended Environmental Protection Measures/ Mitigation Measures
|
Objectives of the
recommended measures & main concerns to address
|
Implementation Agent
|
Implementation Stage
|
Implementation Status
|
Relevant Legislation & Guidelines
|
|
D
|
C
|
O
|
|
Waste Management
|
|
S8.5
|
Nomination of approved personnel to be responsible for standard site practices, arrangements for collection and effective disposal to an appropriate facility of all wastes generated at the site.
|
Contract mobilization/ During construction
|
Contractor(s)
|
|
ü
|
|
Implemented
|
-
|
|
S8.5
|
Training of site personnel in proper waste management and chemical handling procedures. Training will be provided to workers on the concepts of site cleanliness and appropriate waste management procedures, including waste reduction, reuse, and recycling at the beginning of the construction works.
|
Contract mobilization/ During construction
|
Contractor(s)
|
|
ü
|
|
Implemented
|
-
|
|
S8.5
|
Provision of sufficient waste disposal points and regular collection for disposal.
|
All area/ During construction/ During operation
|
Contractor(s)
|
|
ü
|
ü
|
Implemented
|
DEVB TC(W) No.
8/2010, Enhanced Specification for Site Cleanliness and
Tidiness.
|
|
S8.5
|
Appropriate measures to reduce windblown litter and dust transportation of waste by either covering trucks or by transporting wastes in enclosed containers.
|
All area/ During construction
|
Contractor(s)
|
|
ü
|
|
Implemented
|
DEVB TC(W) No.
8/2010,
Enhanced Specification for Site Cleanliness and Tidiness.
|
|
S8.5
|
A waste management plan
(WMP) as stated in the ��ETWB TC(W) No. 19/2005, Environmental Management on Construction Sites�� for the amount of waste generated, recycled and disposed of (including the disposal sites) will be established and implemented during the construction phase as part of the Environmental Management Plan (EMP). The Contractor will be required to prepare the EMP and submits it to the Architect/ Engineer under
the Contract for approval prior to implementation.
|
All area/ During construction
|
Contractor(s)
|
|
ü
|
|
Implemented
|
ETWB TC(W) No.
19/2005,
Environmental Management on Construction Sites
|
|
S8.5
|
Separation of chemical wastes for special handling and appropriate treatment at the Chemical Waste Treatment Centre at Tsing Yi.
|
All area/ During construction
|
Contractor(s)
|
|
ü
|
|
Implemented
|
Chapters 2 & 3 Code of Practice on the Packaging, Labelling & Storage of Chemical Wastes published under the Waste Disposal Ordinance (Cap 354),
Section 35
|
|
S8.5
|
Regular cleaning and maintenance programme for drainage systems, sumps and oil interceptors.
|
Land site/ During construction
|
Contractor(s)
|
|
ü
|
|
Implemented
|
Waste Disposal Ordinance (Cap 354)
|
|
EIA
Reference
|
Recommended Environmental Protection Measures/ Mitigation Measures
|
Objectives of the
recommended measures & main concerns to address
|
Implementation Agent
|
Implementation Stage
|
Implementation Status
|
Relevant Legislation & Guidelines
|
|
D
|
C
|
O
|
|
S8.5
|
A recording system for the amount of wastes generated/ recycled and disposal sites. The trip- ticket system will be included as one of the contractual requirements and implemented by the contractor(s).
|
Land site/ During construction
|
Contractor(s)
|
|
ü
|
|
Implemented
|
DEVB TC(W) No.
6/2010,
Trip Ticket System for Disposal of Construction &
Demolition Materials
|
|
S8.5
|
Segregation and storage of different types of waste in different containers, skips or stockpiles to enhance reuse or recycling of material and their proper disposal.
|
Land site/ During construction/ During operation
|
Contractor(s)
|
|
ü
|
|
Implemented
|
WBTC 32/92, The Use of Tropical Hard Wood on Construction Site
|
|
S8.5
|
Encourage collection of aluminium cans and wastepaper by individual collectors during construction with separate labelled bins provided to segregate these wastes from other general refuse by the workforce.
|
Land site/ During construction
|
Contractor(s)
|
|
ü
|
|
Implemented
|
ETWB TCW No.
33/2002,
Management of Construction and Demolition Material
Including Rock
|
|
S8.5
|
Any unused chemicals and those with remaining functional capacity will be recycled as far as possible.
|
Land site/ During construction
|
Contractor(s)
|
|
ü
|
|
N/A
|
-
|
|
S8.5
|
Use of reusable non-timber formwork to reduce the amount of C&D materials.
|
All areas/ During construction
|
Contractor(s)
|
|
ü
|
|
Implemented
|
WBTC 32/92, The Use of Tropical Hard Wood on Construction Site
|
|
S8.5
|
Prior to disposal of construction waste, wood, steel, and other metals will be separated to the extent practical, for re-use and/or recycling to reduce the quantity of waste to be disposed of to landfill.
|
All areas/ During construction
|
Contractor(s)
|
|
ü
|
|
Implemented
|
DEVB TC(W) No.
6/2010,
Trip Ticket System for Disposal of Construction & Demolition Materials
|
|
S8.5
|
Proper storage and site practices to reduce the potential for damage or contamination of construction materials.
|
All areas/ During construction
|
Contractor(s)
|
|
ü
|
|
Implemented
|
-
|
|
S8.5
|
Plan and stock construction materials carefully to reduce amount of waste generated and avoid unnecessary generation of waste.
|
All areas/ During construction
|
Contractor(s)
|
|
ü
|
|
Implemented
|
-
|
|
S8.5
|
A Sediment Quality Report (SQR) for sampling and chemical testing of the sediment will be prepared and submitted to the EPD for approval. The approved detailed sampling and chemical testing will be carried out prior to the commencement of the dredging activities to confirm the sediment disposal method.
|
Marine works/ During construction
|
Contractor(s)
|
|
ü
|
|
N/A
|
ETWB TC(W) No.
34/2002
and Dumping at Sea Ordinance (DASO)
|
|
EIA
Reference
|
Recommended Environmental Protection Measures/ Mitigation Measures
|
Objectives of the
recommended measures & main concerns to address
|
Implementation Agent
|
Implementation Stage
|
Implementation Status
|
Relevant Legislation & Guidelines
|
|
D
|
C
|
O
|
|
S8.5
|
The management of dredged/ excavated sediment management requirement from ETWB TC(W) No. 34/2002 will be incorporated in the Specification of the Contract Documents.
|
Marine works/ During construction
|
WSD/ Contractor(s)
|
|
ü
|
|
Implemented
|
ETWB TC(W) No.
34/2002 and Dumping
at Sea Ordinance (DASO)
|
|
S8.5
|
The contractor will open a billing account with EPD in accordance with the Waste Disposal (Charges for Disposal of Construction Waste) Regulation for the payment of disposal charges.
|
Contract mobilization/ During construction
|
Contractor(s)
|
|
ü
|
|
Implemented
|
Cap 354N Waste Disposal (Charges for Disposal of Construction Waste) Regulation
|
|
S8.5
|
A trip-ticket system will be established in accordance with DEVB TC(W) No. 6/2010 to monitor the reuse of surplus excavated materials off-site and disposal of construction waste and general refuse at transfer facilities/ landfills, and to control fly-tipping.
|
Contract mobilization/ During construction
|
Contractor(s)
|
|
ü
|
|
Implemented
|
DEVB TC(W) No.
6/2010,
Trip Ticket System for Disposal of Construction &
Demolition Materials
|
|
S8.5
|
The project proponent will also conduct regular inspection of the waste management measures implemented on site as described in the Waste Management Plan.
|
All area/ During construction
|
Contractor(s)/ Environmental Team (ET) & Independent Environmental Checker
(IEC)
|
|
ü
|
|
Implemented
|
ETWB TC(W) No.
19/2005,
Environmental Management on Construction Sites
|
|
S8.5
|
A recording system (similar to summary table as shown in Annex 5 and Annex 6 of Appendix G of ETWB TC(W) No. 19/2005) for the amount of waste generated, recycled and disposed of (including the disposal sites) will be established during the construction phase.
|
All area/ During construction
|
Contractor(s)
|
|
ü
|
|
Implemented
|
Annex 5 and Annex 6 of Appendix G of ETWB TC(W) No.
19/2005
|
|
S8.5
|
Inert C&D materials (public fill) will be reused within the Project as far as practicable.
|
All area/ During construction
|
Contractor(s)
|
|
ü
|
|
Implemented
|
-
|
|
S8.5
|
Public fill and construction waste shall be segregated and stored in different containers or skips to facilitate reuse or recycling of materials and their proper disposal.
|
All area/ During construction
|
Contractor(s)
|
|
ü
|
|
Implemented
|
-
|
|
S8.5
|
Specific areas of the work site will be designated for such segregation and storage if immediate use is not practicable.
|
All area/ During construction
|
Contractor(s)
|
|
ü
|
|
Implemented
|
-
|
|
S8.5
|
To reduce the potential dust and water quality impacts of site formation works, C&D materials will be wetted as quickly as possible to the extent practice after filling.
|
All area/ During construction
|
Contractor(s)
|
|
ü
|
|
Implemented
|
Air Pollution Control (Construction Dust) Regulation (Cap 311R);
WPCO (Cap 358)
|
|
EIA
Reference
|
Recommended Environmental Protection Measures/ Mitigation Measures
|
Objectives of the
recommended measures & main concerns to address
|
Implementation Agent
|
Implementation Stage
|
Implementation Status
|
Relevant Legislation & Guidelines
|
|
D
|
C
|
O
|
|
S8.5
|
Open stockpiles of excavated/ fill materials or construction wastes on-site should be covered with tarpaulin or similar fabric.
|
Land site/ During Construction, particularly dry season
|
Contractor(s)
|
|
ü
|
|
Implemented
|
Air Pollution Control (Construction Dust) Regulation (Cap 311R)
|
|
S8.5
|
Chemical waste container shall be suitable for the substance they are holding, resistant to corrosion, maintained in a good condition, and securely closed.
|
All area/ During construction/ During operation
|
Contractor(s)/ WSD
|
|
ü
|
ü
|
Implemented
|
Waste Disposal (Chemical Waste) (General) Regulation; Code of Practice on the Packaging, Handling and Storage of Chemical Wastes
|
|
S8.5
|
Chemical waste container shall have a capacity of less than 450 L unless the specifications have been approved by the EPD.
|
All area/ During construction/ During operation
|
Contractor(s)/ WSD
|
|
ü
|
ü
|
Implemented
|
|
S8.5
|
A label in English and Chinese shall be displayed on the chemical container in accordance with instructions prescribed in Schedule 2 of the Regulations.
|
All area/ During construction/ During operation
|
Contractor(s)/ WSD
|
|
ü
|
ü
|
Implemented
|
|
S8.5
|
Storage areas for chemical waste shall be enclosed on at least 3 sides.
|
All area/ During construction/ During operation
|
Contractor(s)/ WSD
|
|
ü
|
ü
|
Implemented
|
|
S8.5
|
Storage areas for chemical waste shall have an impermeable floor and bunding, of capacity to accommodate 110% of the volume of the largest container or 20% by volume of the chemical waste stored in that area, whichever is the greatest.
|
All area/ During construction/ During operation
|
Contractor(s)/ WSD
|
|
ü
|
ü
|
Implemented
|
|
S8.5
|
Storage areas for chemical waste shall have adequate ventilation.
|
All area/ During construction/ During operation
|
Contractor(s)/ WSD
|
|
ü
|
ü
|
Implemented
|
|
S8.5
|
Storage areas for chemical waste shall be covered to prevent rainfall entering (water collected within the bund must be tested and disposed of as chemical waste, if necessary).
|
All area/ During construction/ During operation
|
Contractor(s)/ WSD
|
|
ü
|
ü
|
Implemented
|
|
S8.5
|
Storage areas for chemical waste shall be arranged so that incompatible materials are appropriately separated.
|
All area/ During construction/ During operation
|
Contractor(s)/ WSD
|
|
ü
|
ü
|
Implemented
|
|
S8.5
|
General refuse will be stored in enclosed bins or compaction units separately from construction and chemical wastes.
|
All area/ During construction/ During operation
|
Contractor(s)/ WSD
|
|
ü
|
ü
|
Implemented after reminder
|
|
S8.5
|
Adequate number of waste containers will be provided to avoid over-spillage of waste.
|
All area/ During construction/ During operation
|
Contractor(s)/ WSD
|
|
ü
|
ü
|
Implemented
|
DEVB TC(W) No.
8/2010
Enhanced Specification for Site Cleanliness and Tidiness.
|
|
EIA
Reference
|
Recommended Environmental Protection Measures/ Mitigation Measures
|
Objectives of the
recommended measures & main concerns to address
|
Implementation Agent
|
Implementation Stage
|
Implementation Status
|
Relevant Legislation & Guidelines
|
|
D
|
C
|
O
|
|
S8.5
|
A reputable waste collector will be employed by the Contractor to remove general refuse from the site, separately from construction and chemical wastes, on a daily basis to minimize odour, pest and litter impacts.
|
All area/ During construction/ During operation
|
Contractor(s)/ WSD
|
|
ü
|
ü
|
Implemented
|
-
|
|
S8.5
|
Recycling bins will be provided at strategic locations within the Site to facilitate recovery of recyclable materials (including aluminum can, wastepaper, glass bottles and plastic bottles) from the Site. Materials recovered will be sold for recycling.
|
All area/ During construction/ During operation
|
Contractor(s)/ WSD
|
|
ü
|
ü
|
Implemented
|
-
|
|
S8.5
|
To avoid any odour and litter impact, accurate number of portable
toilets will be provided for workers on-site.
|
All area/ During construction
|
Contractor(s)
|
|
ü
|
|
Implemented
|
-
|
|
S8.5
|
The burning of refuse on construction sites is prohibited by law.
|
All area/ During construction
|
Contractor(s)
|
|
ü
|
|
Implemented
|
Air Pollution Control Ordinance (Cap 311)
|
|
S8.7
|
To facilitate monitoring and control over the contractors�� performance on waste management, a waste inspection and audit programme will be implemented throughout the construction
phase.
|
All facilities/ During construction
|
ET/ IEC
|
|
ü
|
|
Implemented
|
-
|
Note: D - Design stage C - Construction O - Operation
|
EIA
Reference
|
Recommended Environmental Protection Measures/ Mitigation Measures
|
Objectives of the
recommended measures & main concerns to address
|
Implementation Agent
|
Implementation Stage
|
Implementation Status
|
Relevant Legislation & Guidelines
|
|
D
|
C
|
O
|
|
Ecology
|
|
S9.7
|
For slope mitigation works within the Clear Water Bay Country Park, to avoid tree felling and damages to trees, the exact locations of the flexible barrier foundation plates, soil nails and rock dowels can be adjusted during detailed design, and a setback distance from existing trees is recommended to be maintained as far as practical. A detailed specification describing the exact locations of the flexible barrier foundation plates, soil nails and rock dowels will be prepared to illustrate how the setback distance from existing trees would be implemented for tree avoidance.
|
Slope mitigation works area/ During detailed design/ During construction
|
Contractor(s)
|
ü
|
ü
|
|
Implemented
|
-
|
|
S9.7
|
Pruning of tree canopies along the alignment of the flexible barriers shall be limited to a minimum.
|
Slope mitigation works area/
During construction
|
Contractor(s)
|
|
ü
|
|
Implemented
|
|
|
S9.7
|
The alignment of flexible barriers shall be optimized to preserve all species of conservation interest and minimize the impact to the existing vegetation as far as practicable. All individuals of Marsdenia lachnostoma within the slope mitigation areas shall be retained in- situ, by positioning the alignment of flexible barrier at
a minimum 1.5m in a radius away from these individuals.
|
Slope mitigation works area/ During detailed design/ During construction
|
Contractor(s)
|
ü
|
ü
|
|
Implemented
|
-
|
|
S9.7 and 9.10
|
At the detailed design stage prior to the commencement of the slope mitigation works, a vegetation survey shall be carried out at the slope mitigation areas within the Clear Water Bay Country Park to assess the condition and identify the location of each individual of Marsdenia lachnostoma and other flora species of conservation interest that may be directly affected by the construction works.
|
Slope mitigation works area/ During detailed design/ During construction
|
Contractor(s)
|
ü
|
|
|
Implemented
|
-
|
|
S9.7
|
Temporary fencing will be installed to fence off the concerned species either in groups of individually within the works area and in the close proximity to prevent from being damaged and disturbed during construction. A sign identifying the site shall be attached to the fence and flagging tape shall be attached to the
individuals to visualize their locations.
|
Slope mitigation works area/ During construction
|
Contractor(s)
|
|
ü
|
|
Implemented
|
-
|
|
S9.7 and S9.10
|
A specification for fencing and demarcating individuals of Marsdenai lachnostoma (or other flora species of conservation interest, if found) adjacent to the proposed alignment of the flexible barriers will be prepared to protect the species.
|
Slope mitigation works area/ During construction
|
Contractor(s)
|
|
ü
|
|
Implemented
|
-
|
|
S9.7
|
Induction training shall also be provided to all site personnel in order to brief them on this flora of conservation interest including the locations and their importance.
|
Slope mitigation works area/ During construction
|
Contractor(s)
|
|
ü
|
|
Implemented
|
-
|
|
EIA
Reference
|
Recommended Environmental Protection Measures/ Mitigation Measures
|
Objectives of the
recommended measures & main concerns to address
|
Implementation Agent
|
Implementation Stage
|
Implementation Status
|
Relevant Legislation & Guidelines
|
|
D
|
C
|
O
|
|
S9.7
|
The resident site supervisory staff will closely monitor the
conditions of concerned individuals during construction of flexible barriers in the close proximity.
|
Slope mitigation works area/ During construction
|
Contractor(s)
|
|
ü
|
|
Implemented
|
-
|
|
S9.7
|
Erect fences along the boundary of the works area before the
commencement of works to prevent vehicle movements and encroachment of personnel onto adjacent areas.
|
All area/ During construction
|
Contractor(s)
|
|
ü
|
|
Implemented
|
-
|
|
S9.7
|
Regularly check the work site boundaries to ensure that they are not breached, and that damage does not occur to surrounding areas.
|
All area/ During construction
|
Contractor(s)/ ET
|
|
ü
|
|
Implemented
|
-
|
|
S9.7
|
Avoid any damage and disturbance, particularly those caused by filling and illegal dumping, to the surrounding habitats through
proper management of waste disposal.
|
All area/ During construction
|
Contractor(s)
|
|
ü
|
|
Implemented
|
-
|
|
S9.7
|
Reinstate temporarily affected areas, particularly the habitats of plantation and shrubland-grassland immediately after completion of construction works, through on-site tree/shrub planting. The tree/shrub species will be chosen with reference to
those in the surrounding area.
|
All area/ During construction
|
Contractor(s)
|
|
ü
|
|
To be implemented
|
-
|
|
S9.7
|
Affected habitats within the Clear Water Bay Country Bay shall be reinstated by hydro-seeding and planting of climbers and native shrub seedlings where practical upon completion of the slope mitigation works.
|
All area/ During construction
|
Contractor(s)
|
|
ü
|
|
To be implemented
|
-
|
Note: D - Design stage C - Construction O - Operation
|
EIA
Reference
|
Recommended Environmental Protection Measures/ Mitigation Measures
|
Objectives of the recommended measures & main concerns to address
|
Implementation Agent
|
Implementation Stage
|
Implementation Status
|
Relevant Legislation & Guidelines
|
|
D
|
C
|
O
|
|
Landscape & Visual
|
|
S11.10 & 11.11
|
The construction area and area allowed for temporary structures, such as the contractor��s
office, will be minimized to a practical minimum. (MM1)
|
All area/ Detailed design/
During construction/ During operation
|
WSD/ Contractor(s)
|
ü
|
ü
|
ü
|
Implemented
|
-
|
|
S11.10 & 11.11
|
At the detailed design stage, the design team will seek to minimize the landscape footprint of the Project and above ground facilities, while satisfying all other requirements. (MM2)
|
All area/ Detailed design/ During construction/ During
operation
|
WSD/ Contractor(s)
|
ü
|
ü
|
ü
|
Implemented
|
-
|
|
S11.10 & 11.11
|
Design principles will be adopted to take into account the surrounding area, particularly Clear Water Bay Country Park behind and the nearby waterfront, with due consideration given to:
- green roofs where practical (i.e. without equipment on the roof);
- roadside planting;
- aesthetic treatment of all structures;
- vertical greening;
- screen planting along application site; and
- landscape enhancement with amenity planting where practical including planting along the edge (site boundary) fence with native shrubs where feasible, to reduce their visual impact and
blend them into the surrounding landscape. (MM3)
|
All area/ Detailed design/ During construction/ During operation
|
WSD/ Contractor(s)
|
ü
|
ü
|
ü
|
Implemented
|
-
|
|
S11.10 & 11.11
|
All trees within the Project Site or the potential slope mitigation works area will be carefully protected during construction according to DEVB TCW No. 10/2013 - Tree Preservation (MM4)
|
All area/ Detailed design/ During construction/ During
operation
|
WSD/ Contractor(s)
|
ü
|
ü
|
ü
|
Implemented
|
ETWB TCW No. 3/2006
- Tree Preservation.
|
|
S11.10 & 11.11
|
No tree within the Country Park will be felled. Trees within the Site unavoidably affected by the works will be transplanted where necessary and practical. For trees that need to be felled, compensatory planting will be provided to the satisfaction of
|
All area/ Detailed design/ During construction/ During operation
|
WSD/ Contractor(s)
|
ü
|
ü
|
ü
|
Implemented
|
DEVB TC(W) No. 10/2013
|
|
|
relevant Government departments.
|
|
|
|
|
|
|
|
|
|
A compensatory tree planting proposal including locations of
|
|
|
|
|
|
|
|
|
|
tree compensation will be submitted to seek relevant
|
|
|
|
|
|
|
|
|
|
government department��s approval, in accordance with DEVB
|
|
|
|
|
|
|
|
|
|
TC(W) No. 10/2013. (MM5)
|
|
|
|
|
|
|
|
|
S11.10 & 11.11
|
Any slope mitigation works necessary to address natural terrain hazards, will be minimized to minimize any potential environmental impact to the Country Park e.g. soil nailing and rock stabilization will aim to avoid existing trees e.g. should any restoration of vegetation be necessary, the best planting matrix with native species will be established, with the aim of resembling the existing vegetation. (MM6)
|
All area/ Detailed design/ During construction/ During operation
|
WSD/ Contractor(s)
|
ü
|
ü
|
ü
|
Implemented
|
|
|
EIA
Reference
|
Recommended Environmental Protection Measures/ Mitigation Measures
|
Objectives of the recommended measures & main concerns to address
|
Implementation Agent
|
Implementation Stage
|
Implementation Status
|
Relevant Legislation & Guidelines
|
|
D
|
C
|
O
|
|
S11.10 & 11.11
|
Dredging works for the installation of intake structures and outfall diffusers should be minimized to avoid or reduce any potential environmental impacts to as low as reasonably practicable (ALARP). The intake and outfall structures (e.g. intake openings
and diffuser heads) will be prefabricated and transferred to site for installation. (MM7)
|
All area/ Detailed design/ During construction/ During operation
|
WSD/ Contractor(s)
|
ü
|
ü
|
ü
|
Implemented
|
|
|
S11.10 & 11.11
|
All night-time lighting will be reduced to a practical minimum both in terms of number of level and will be hooded and directional. (MM8) units and lux level and will be hooded and
directional. (MM8)
|
All area/ Detailed design/ During construction/ During operation
|
WSD/ Contractor(s)
|
ü
|
ü
|
ü
|
Implemented
|
-
|
Note: D - Design stage C - Construction O - Operation
|
EIA
Reference
|
Recommended Environmental Protection Measures/ Mitigation Measures
|
Objectives of the recommended measures & main concerns to address
|
Implementation Agent
|
Implementation Stage
|
Implementation Status
|
Relevant Legislation & Guidelines
|
|
D
|
C
|
O
|
|
Landfill Gas Hazard
|
|
S12.7
|
During all works, safety procedures should be implemented to minimize the risks of fires and explosions, asphyxiation of workers and toxicity effects resulting from contact with contaminated soil and groundwater.
|
All area/ Detailed design/ During construction/operation
|
Contractor(s)
|
ü
|
ü
|
ü
|
Implemented
|
-
|
|
S12.7
|
During trenching and excavation as well as creation of confined spaces at near to or below ground level, precautions should be clearly laid down and rigidly Gas detection equipment and
appropriate breathing apparatus should be available and used when entering confined spaces or trenches deeper than 1 meter.
|
All area/ Detailed design/ During construction/operation
|
Contractor(s)
|
ü
|
ü
|
ü
|
Implemented
|
|
|
S12.7
|
The Contractor should make the workers are aware of potential hazards of working in confined spaces (any chamber, manhole or culvert which is large enough to permit access to personnel). Such work in confined spaces is controlled by the Factories and Industrial Undertakings (Confined Spaces) Regulations of the Factories and Industrial Undertakings Ordinance.
Following the Safety Guide to Working in Confined Spaces ensures compliance with the above regulations.
|
All area/ Detailed design/ During construction/operation
|
Contractor(s)
|
ü
|
ü
|
ü
|
Implemented
|
|
|
S12.7
|
Safety officers, specifically trained with regard to landfill gas and leachate related hazards and the appropriate actions to take in adverse circumstances, should be present on the site throughout the works, in particular, when works are undertaken below
grade.
|
All area/ Detailed design/ During construction/operation
|
Contractor(s)
|
ü
|
ü
|
ü
|
Implemented
|
|
|
S12.7
|
All personnel who work on site and all visitors to the site should be made aware of the possibility of ignition of gas in the vicinity of the works, the possible presence of contaminated water and the need to avoid physical contact with it.
|
All area/ Detailed design/ During construction/operation
|
Contractor(s)
|
ü
|
ü
|
ü
|
Implemented
|
|
|
S12.7
|
Monitoring for landfill gas should be undertaken in all excavations, manholes, chambers (particularly during pipe jacking) and any confined spaces through the use of an intrinsically safe portable instrument, appropriately calibrated
and capable of measuring the concentrations of methane. carbon dioxide and oxygen.
|
All area/ Detailed design/ During construction/operation
|
Contractor(s)
|
ü
|
ü
|
ü
|
Implemented
|
|
|
S12.7
|
Monitoring frequency and areas to be monitored should be specified prior to commencement of groundwork, either by the
Safety Officer, or by an appropriately qualified person. All measurements should be recorded and documented.
|
All area/ Detailed design/ During construction/operation
|
Contractor(s)
|
ü
|
ü
|
ü
|
Implemented
|
|
|
S12.7
|
Proceed drilling with adequate care and precautions against the potential hazards which may be encountered.
|
All area/ Detailed design/ During construction/operation
|
Contractor(s)
|
ü
|
ü
|
ü
|
Implemented
|
|
|
EIA
Reference
|
Recommended Environmental Protection Measures/ Mitigation Measures
|
Objectives of the recommended measures & main concerns to address
|
Implementation Agent
|
Implementation Stage
|
Implementation Status
|
Relevant Legislation & Guidelines
|
|
D
|
C
|
O
|
|
S12.7
|
Prior to the commencement of the site works, the drilling contractor should devise a 'method-of- working' statement covering all normal and emergency procedures (including but not limited to number of operatives, experience and special skills of operatives, normal method of operations, emergency procedures, supervisors responsibilities, storage and use of safety equipment, safety procedures and signs, barriers and guarding). The site
supervisor and all operatives must be familiar with this statement.
|
All area/ During construction/operation
|
Contractor(s)
|
ü
|
ü
|
ü
|
Implemented
|
|
|
S12.7
|
Where below ground service entries are necessary to the Incoming Switchgear Room, 132 kV Substation and Chlorine Store (I) and (II), the entry point should be sealed to prevent gas entry. In addition, any below grade cable trenches entering the Incoming Switchgear Room and 132 kV Substation can become the pathway for landfill gas and hence grilled metal covers should
be used.
|
All area/ Detailed design/ During construction/operation
|
Contractor(s)
|
ü
|
ü
|
ü
|
N/A
|
|
|
S12.7
|
It is recommended regular landfill gas monitoring should be carried out at the Incoming Switchgear Room, 132 kV Substation and Chlorine Store (I) and (II). The monitoring frequency will be monthly for the first year of operation. If the monitoring results
show no sign of landfill gas migration, reduce the monitoring frequency to once every six months.
|
All area/ Detailed design/ During construction/operation
|
Contractor(s)
|
ü
|
ü
|
ü
|
N/A
|
|
|
S12.7
|
The manholes and utility pits within the Project Site and along the fresh water mains. Each manhole/ utility pit should be monitored with two measurements (at mid depth and base). Each measurement should be monitored for a minimum of 10 minutes. A steady reading and peak reading should be recorded at each manhole/ utility pit and for each measurement. The need for
venting the manhole/ utility pit and further monitoring will be reviewed after the initial monitoring.
|
All area/ Detailed design/ During construction/operation
|
Contractor(s)
|
ü
|
ü
|
ü
|
Implemented
|
|
|
S12.7
|
All construction, operation and maintenance personnel working on-site as well as visitors should be made aware of the hazards of landfill gas and its possible presence on-site. This should be achieved through a combination of posting warning signs in prominent places and also by access to detailed information on landfill gas hazards and the designs and procedural means by
which these hazards are being minimized on-site.
|
All area/ Detailed design/ During construction/operation
|
Contractor(s)
|
ü
|
ü
|
ü
|
Implemented
|
|
Note: D - Design stage C - Construction O - Operation
Appendix D
Impact Monitoring Schedule
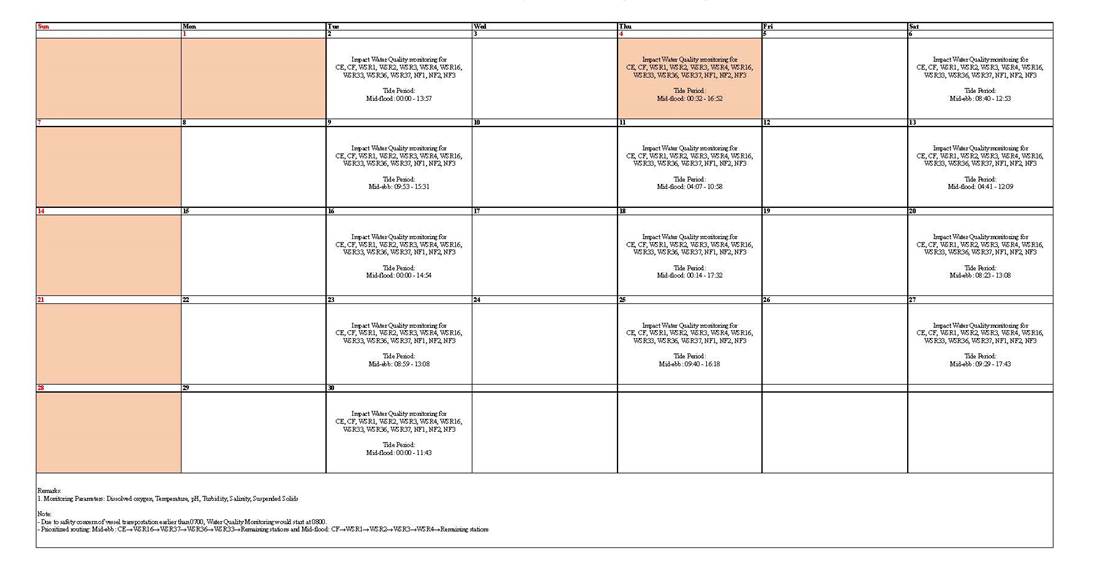
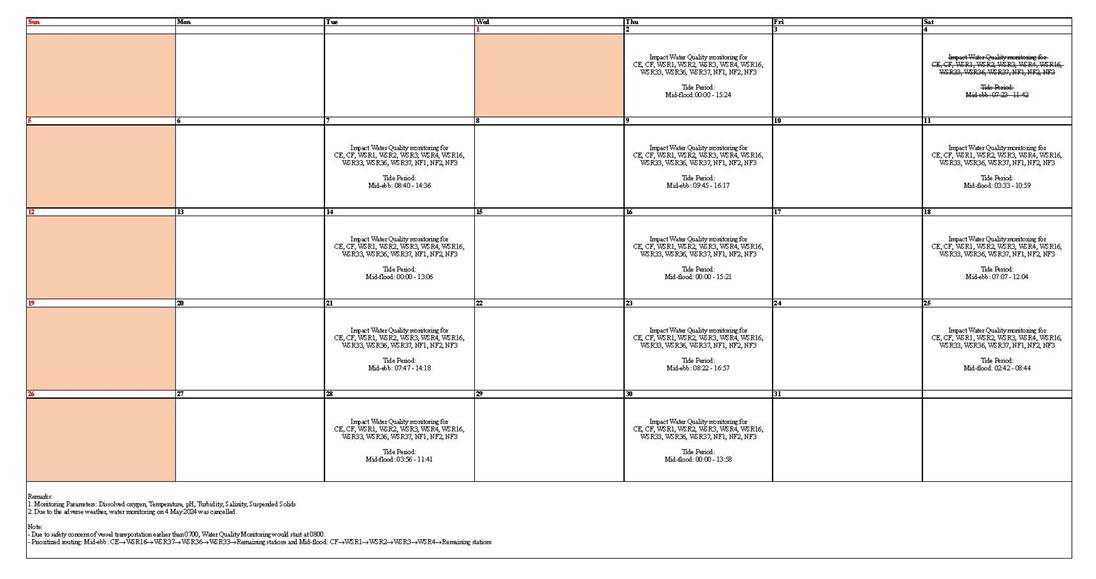
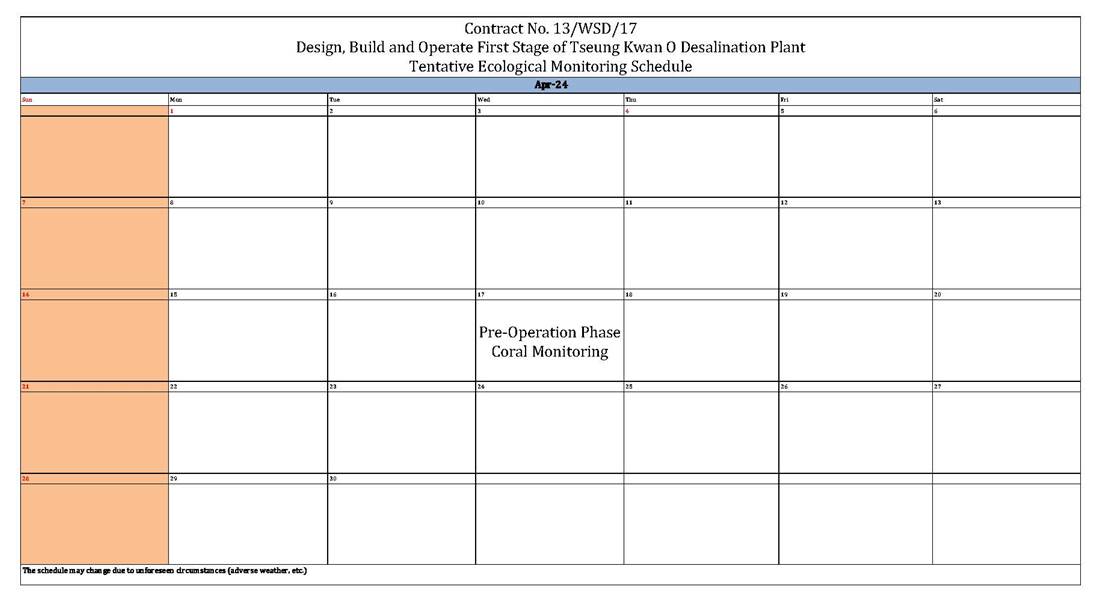
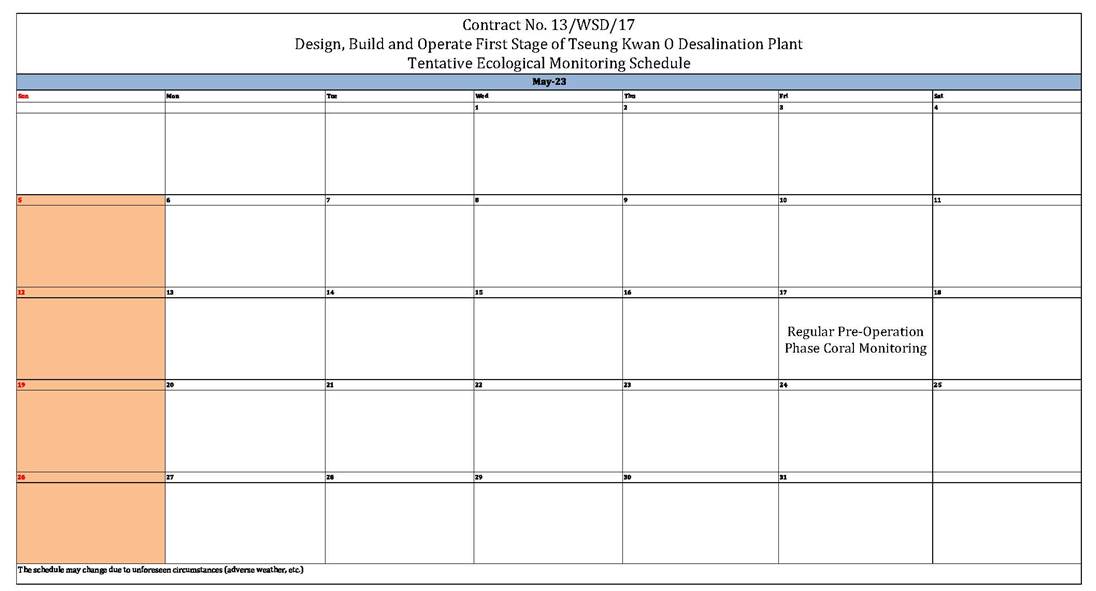
Appendix E
Event / Action
Plan
Table E1 Event and Action Plan for Construction Noise Monitoring
Table E2 Event and Action Plan for Water Quality Monitoring
Table E2 Event and Action Plan for Ecology
during Construction Phase
Table E3 Event and Action Plan for Pre-Operation Phase Coral Monitoring
Appendix F
Water Quality
Monitoring Equipment and
Landfill
Gas Equipment Calibration Certification
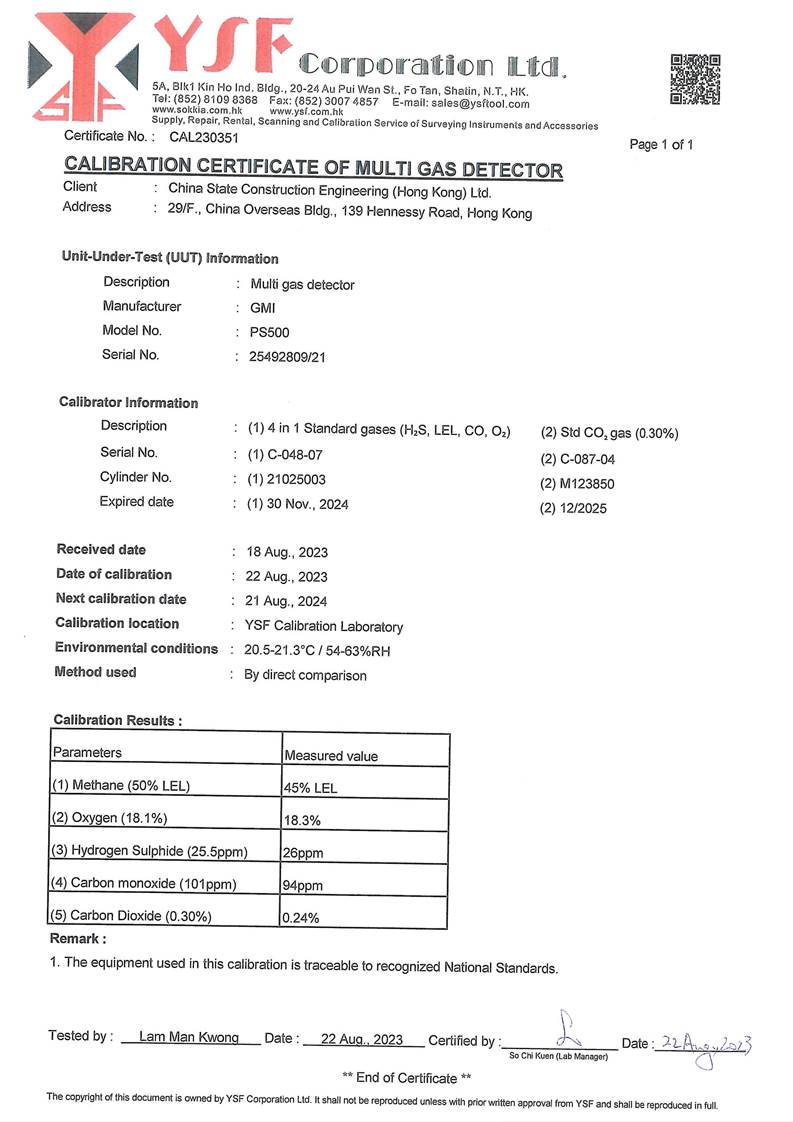
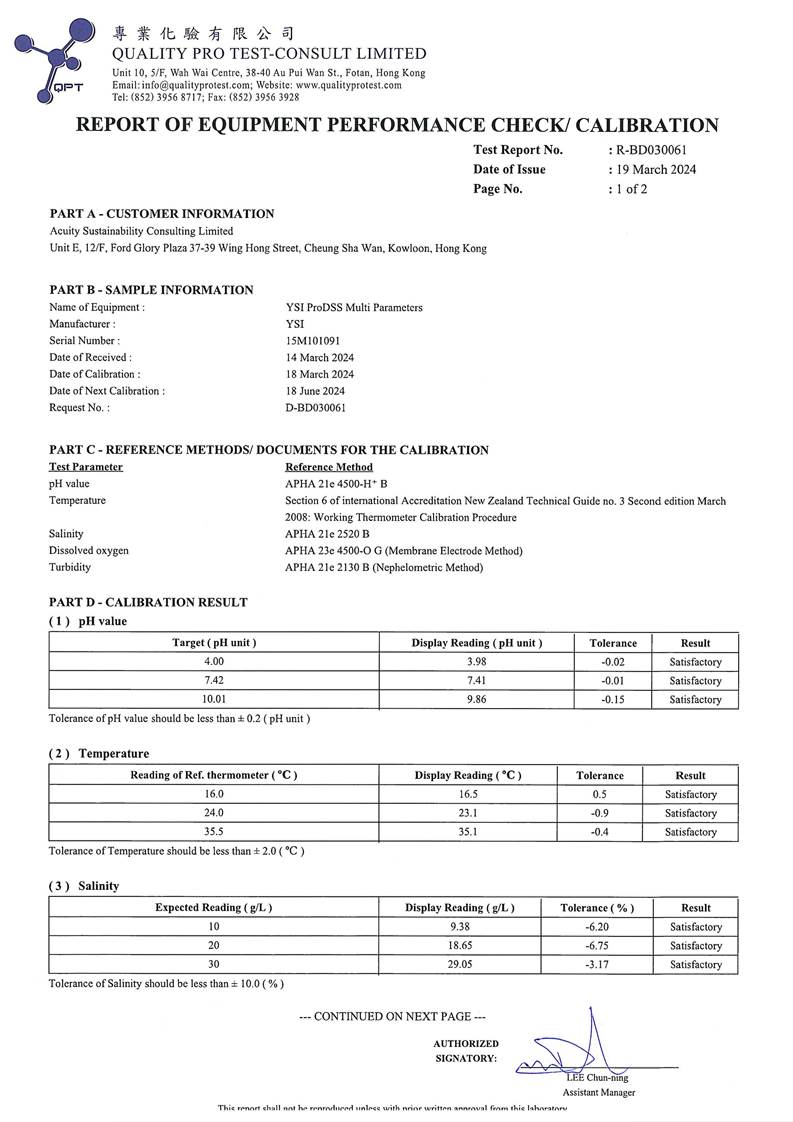

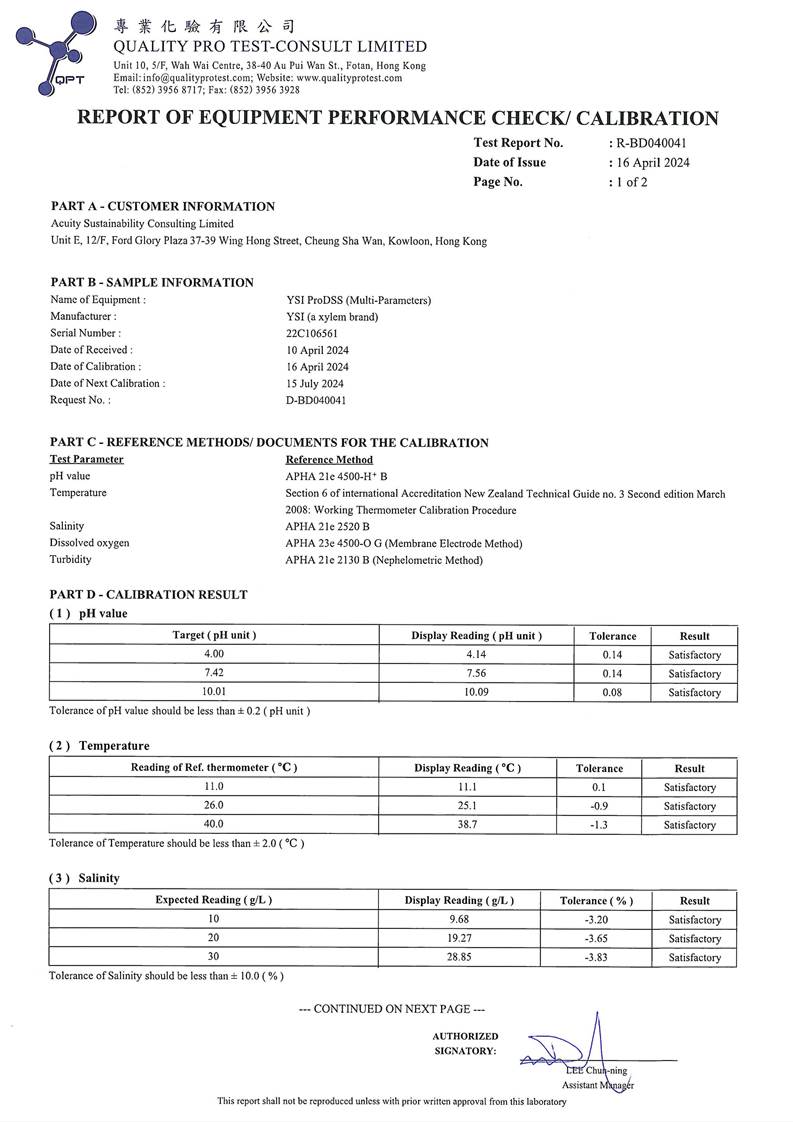
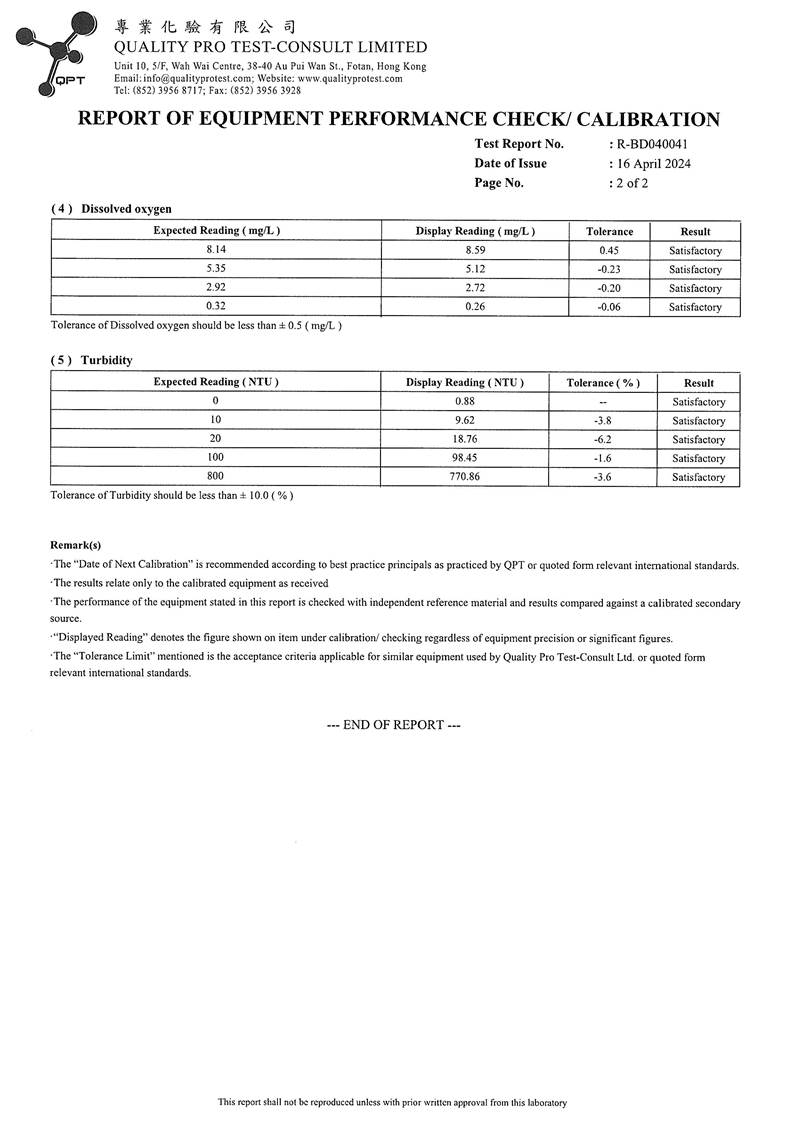
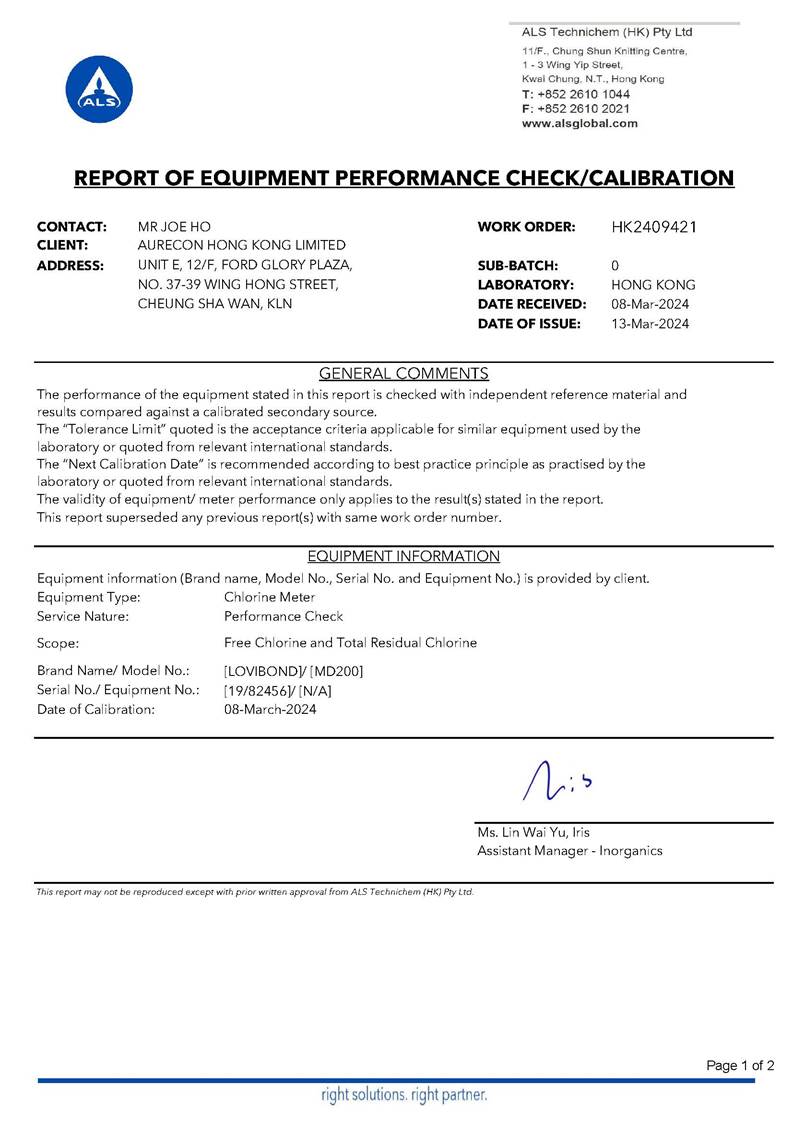

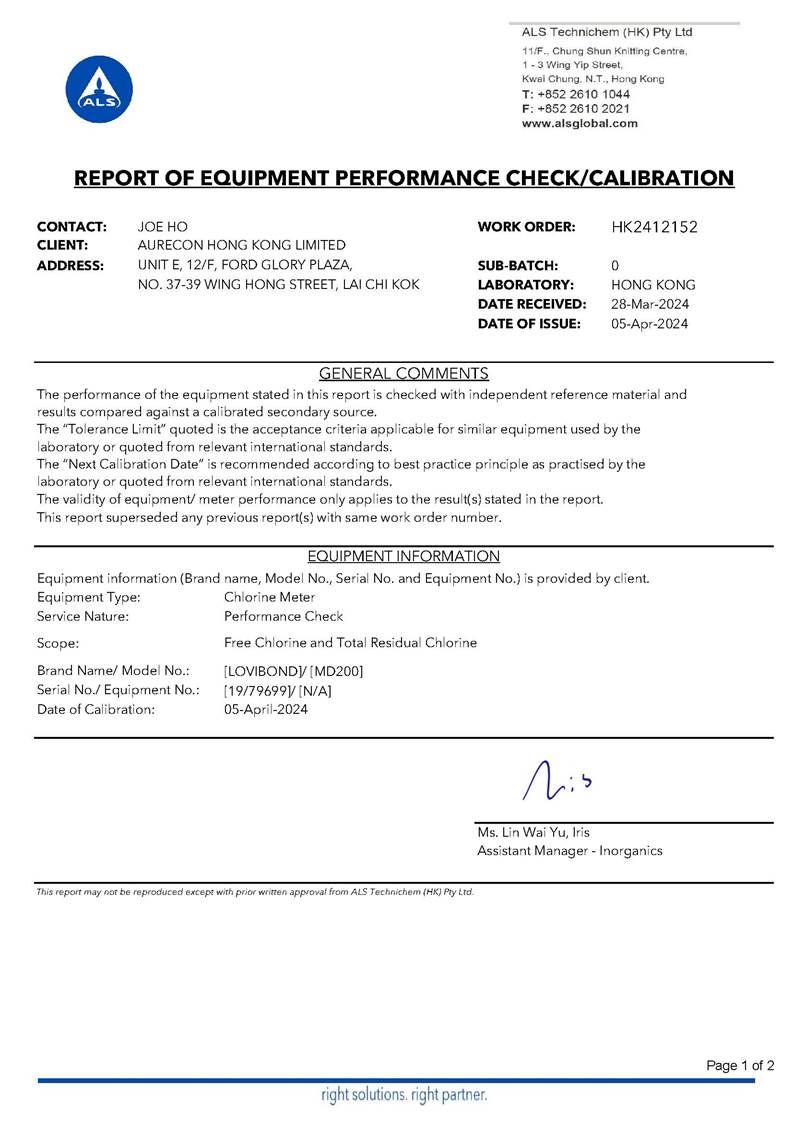

Appendix G
Water Quality
Monitoring Data &
Landfill
Gas Monitoring Data
|
Location
|
Date
|
Weather
|
Tide
|
Sea Condition
|
Water Level
|
Depth (m)
|
Time
|
DO (mg/L)
|
pH
|
Sal (ppt)
|
Temp ((�XC)
|
Turbidty (NTU)
|
SS (mg/L)
|
Iron (mg/L)
|
Total Residual Chlorine (mg/L)
|
|
CE
|
2/4/2024
|
Cloudy
|
Mid-flood
|
Moderate
|
S
|
1
|
12:36:00 PM
|
8.34
|
8.16
|
33.45
|
23.66
|
2.31
|
4.00
|
<0.1
|
<0.01
|
|
CE
|
2/4/2024
|
Cloudy
|
Mid-flood
|
Moderate
|
S
|
1
|
12:36:00 PM
|
8.39
|
8.15
|
33.44
|
23.61
|
2.32
|
3.00
|
<0.1
|
<0.01
|
|
CE
|
2/4/2024
|
Cloudy
|
Mid-flood
|
Moderate
|
M
|
10
|
12:37:00 PM
|
8.34
|
8.14
|
33.47
|
23.69
|
2.34
|
2.50
|
<0.1
|
<0.01
|
|
CE
|
2/4/2024
|
Cloudy
|
Mid-flood
|
Moderate
|
M
|
10
|
12:37:00 PM
|
8.42
|
8.18
|
33.40
|
23.68
|
2.31
|
4.00
|
<0.1
|
<0.01
|
|
CE
|
2/4/2024
|
Cloudy
|
Mid-flood
|
Moderate
|
B
|
19
|
12:38:00 PM
|
8.42
|
8.16
|
33.37
|
23.65
|
2.30
|
4.00
|
<0.1
|
<0.01
|
|
CE
|
2/4/2024
|
Cloudy
|
Mid-flood
|
Moderate
|
B
|
19
|
12:38:00 PM
|
8.38
|
8.17
|
33.40
|
23.69
|
2.32
|
5.00
|
<0.1
|
<0.01
|
|
CF
|
2/4/2024
|
Cloudy
|
Mid-flood
|
Moderate
|
S
|
1
|
9:45:00 AM
|
8.89
|
8.31
|
32.60
|
23.75
|
2.65
|
4.00
|
<0.1
|
<0.01
|
|
CF
|
2/4/2024
|
Cloudy
|
Mid-flood
|
Moderate
|
S
|
1
|
9:45:00 AM
|
8.89
|
8.30
|
32.55
|
23.70
|
2.63
|
2.50
|
<0.1
|
<0.01
|
|
CF
|
2/4/2024
|
Cloudy
|
Mid-flood
|
Moderate
|
M
|
10
|
9:46:00 AM
|
8.86
|
8.24
|
32.52
|
23.77
|
2.66
|
3.00
|
<0.1
|
<0.01
|
|
CF
|
2/4/2024
|
Cloudy
|
Mid-flood
|
Moderate
|
M
|
10
|
9:46:00 AM
|
8.76
|
8.30
|
32.53
|
23.73
|
2.67
|
3.00
|
<0.1
|
<0.01
|
|
CF
|
2/4/2024
|
Cloudy
|
Mid-flood
|
Moderate
|
B
|
20
|
9:47:00 AM
|
8.76
|
8.27
|
32.47
|
23.78
|
2.66
|
4.00
|
<0.1
|
<0.01
|
|
CF
|
2/4/2024
|
Cloudy
|
Mid-flood
|
Moderate
|
B
|
20
|
9:47:00 AM
|
8.84
|
8.25
|
32.52
|
23.73
|
2.63
|
3.00
|
<0.1
|
<0.01
|
|
WSR01
|
2/4/2024
|
Cloudy
|
Mid-flood
|
Moderate
|
S
|
1
|
10:09:00 AM
|
8.25
|
8.15
|
32.75
|
23.75
|
1.56
|
2.50
|
<0.1
|
<0.01
|
|
WSR01
|
2/4/2024
|
Cloudy
|
Mid-flood
|
Moderate
|
S
|
1
|
10:09:00 AM
|
8.36
|
8.16
|
32.75
|
23.73
|
1.59
|
3.00
|
<0.1
|
<0.01
|
|
WSR01
|
2/4/2024
|
Cloudy
|
Mid-flood
|
Moderate
|
M
|
4
|
10:10:00 AM
|
8.37
|
8.16
|
32.77
|
23.67
|
1.56
|
4.00
|
<0.1
|
<0.01
|
|
WSR01
|
2/4/2024
|
Cloudy
|
Mid-flood
|
Moderate
|
M
|
4
|
10:10:00 AM
|
8.33
|
8.16
|
32.68
|
23.67
|
1.59
|
3.00
|
<0.1
|
<0.01
|
|
WSR01
|
2/4/2024
|
Cloudy
|
Mid-flood
|
Moderate
|
B
|
7
|
10:11:00 AM
|
8.25
|
8.14
|
32.81
|
23.72
|
1.55
|
2.50
|
<0.1
|
<0.01
|
|
WSR01
|
2/4/2024
|
Cloudy
|
Mid-flood
|
Moderate
|
B
|
7
|
10:11:00 AM
|
8.31
|
8.18
|
32.67
|
23.74
|
1.55
|
3.00
|
<0.1
|
<0.01
|
|
WSR02
|
2/4/2024
|
Cloudy
|
Mid-flood
|
Moderate
|
S
|
1
|
10:27:00 AM
|
8.21
|
8.31
|
33.60
|
23.76
|
2.08
|
4.00
|
<0.1
|
<0.01
|
|
WSR02
|
2/4/2024
|
Cloudy
|
Mid-flood
|
Moderate
|
S
|
1
|
10:27:00 AM
|
8.30
|
8.29
|
33.56
|
23.70
|
2.10
|
3.00
|
<0.1
|
<0.01
|
|
WSR02
|
2/4/2024
|
Cloudy
|
Mid-flood
|
Moderate
|
M
|
5
|
10:28:00 AM
|
8.20
|
8.30
|
33.59
|
23.68
|
2.11
|
4.00
|
<0.1
|
<0.01
|
|
WSR02
|
2/4/2024
|
Cloudy
|
Mid-flood
|
Moderate
|
M
|
5
|
10:28:00 AM
|
8.32
|
8.31
|
33.58
|
23.74
|
2.12
|
2.50
|
<0.1
|
<0.01
|
|
WSR02
|
2/4/2024
|
Cloudy
|
Mid-flood
|
Moderate
|
B
|
8
|
10:29:00 AM
|
8.29
|
8.32
|
33.62
|
23.67
|
2.10
|
3.00
|
<0.1
|
<0.01
|
|
WSR02
|
2/4/2024
|
Cloudy
|
Mid-flood
|
Moderate
|
B
|
8
|
10:29:00 AM
|
8.21
|
8.31
|
33.66
|
23.75
|
2.10
|
4.00
|
<0.1
|
<0.01
|
|
WSR03
|
2/4/2024
|
Cloudy
|
Mid-flood
|
Moderate
|
S
|
1
|
10:40:00 AM
|
9.04
|
8.21
|
33.41
|
23.89
|
1.78
|
4.00
|
<0.1
|
<0.01
|
|
WSR03
|
2/4/2024
|
Cloudy
|
Mid-flood
|
Moderate
|
S
|
1
|
10:40:00 AM
|
8.98
|
8.20
|
33.41
|
23.85
|
1.81
|
5.00
|
<0.1
|
<0.01
|
|
WSR03
|
2/4/2024
|
Cloudy
|
Mid-flood
|
Moderate
|
M
|
4
|
10:41:00 AM
|
9.06
|
8.20
|
33.33
|
23.91
|
1.78
|
3.00
|
<0.1
|
<0.01
|
|
WSR03
|
2/4/2024
|
Cloudy
|
Mid-flood
|
Moderate
|
M
|
4
|
10:41:00 AM
|
9.06
|
8.17
|
33.35
|
23.92
|
1.81
|
4.00
|
<0.1
|
<0.01
|
|
WSR03
|
2/4/2024
|
Cloudy
|
Mid-flood
|
Moderate
|
B
|
8
|
10:42:00 AM
|
9.00
|
8.18
|
33.35
|
23.86
|
1.82
|
4.00
|
<0.1
|
<0.01
|
|
WSR03
|
2/4/2024
|
Cloudy
|
Mid-flood
|
Moderate
|
B
|
8
|
10:42:00 AM
|
9.01
|
8.19
|
33.44
|
23.87
|
1.82
|
6.00
|
<0.1
|
<0.01
|
|
Location
|
Date
|
Weather
|
Tide
|
Sea Condition
|
Water Level
|
Depth (m)
|
Time
|
DO (mg/L)
|
pH
|
Sal (ppt)
|
Temp ((�XC)
|
Turbidty (NTU)
|
SS (mg/L)
|
Iron (mg/L)
|
Total Residual Chlorine (mg/L)
|
|
WSR04
|
2/4/2024
|
Cloudy
|
Mid-flood
|
Moderate
|
S
|
1
|
10:55:00 AM
|
8.73
|
8.34
|
33.47
|
23.83
|
1.74
|
5.00
|
<0.1
|
<0.01
|
|
WSR04
|
2/4/2024
|
Cloudy
|
Mid-flood
|
Moderate
|
S
|
1
|
10:55:00 AM
|
8.75
|
8.33
|
33.43
|
23.76
|
1.74
|
3.00
|
<0.1
|
<0.01
|
|
WSR04
|
2/4/2024
|
Cloudy
|
Mid-flood
|
Moderate
|
M
|
4
|
10:56:00 AM
|
8.74
|
8.33
|
33.49
|
23.75
|
1.73
|
6.00
|
<0.1
|
<0.01
|
|
WSR04
|
2/4/2024
|
Cloudy
|
Mid-flood
|
Moderate
|
M
|
4
|
10:56:00 AM
|
8.85
|
8.34
|
33.43
|
23.83
|
1.74
|
5.00
|
<0.1
|
<0.01
|
|
WSR04
|
2/4/2024
|
Cloudy
|
Mid-flood
|
Moderate
|
B
|
7
|
10:57:00 AM
|
8.71
|
8.29
|
33.47
|
23.81
|
1.73
|
7.00
|
<0.1
|
<0.01
|
|
WSR04
|
2/4/2024
|
Cloudy
|
Mid-flood
|
Moderate
|
B
|
7
|
10:57:00 AM
|
8.73
|
8.29
|
33.52
|
23.83
|
1.78
|
6.00
|
<0.1
|
<0.01
|
|
WSR16
|
2/4/2024
|
Cloudy
|
Mid-flood
|
Moderate
|
S
|
1
|
12:17:00 PM
|
8.48
|
8.26
|
33.85
|
23.71
|
1.98
|
3.00
|
<0.1
|
<0.01
|
|
WSR16
|
2/4/2024
|
Cloudy
|
Mid-flood
|
Moderate
|
S
|
1
|
12:17:00 PM
|
8.43
|
8.26
|
33.76
|
23.73
|
1.93
|
3.00
|
<0.1
|
<0.01
|
|
WSR16
|
2/4/2024
|
Cloudy
|
Mid-flood
|
Moderate
|
M
|
9
|
12:18:00 PM
|
8.42
|
8.27
|
33.78
|
23.73
|
1.98
|
3.00
|
<0.1
|
<0.01
|
|
WSR16
|
2/4/2024
|
Cloudy
|
Mid-flood
|
Moderate
|
M
|
9
|
12:18:00 PM
|
8.55
|
8.33
|
33.81
|
23.68
|
1.95
|
5.00
|
<0.1
|
<0.01
|
|
WSR16
|
2/4/2024
|
Cloudy
|
Mid-flood
|
Moderate
|
B
|
16
|
12:19:00 PM
|
8.42
|
8.28
|
33.83
|
23.70
|
1.96
|
3.00
|
<0.1
|
<0.01
|
|
WSR16
|
2/4/2024
|
Cloudy
|
Mid-flood
|
Moderate
|
B
|
16
|
12:19:00 PM
|
8.45
|
8.31
|
33.85
|
23.72
|
1.95
|
2.50
|
<0.1
|
<0.01
|
|
WSR33
|
2/4/2024
|
Cloudy
|
Mid-flood
|
Moderate
|
S
|
1
|
11:10:00 AM
|
9.15
|
8.16
|
33.00
|
23.95
|
1.48
|
4.00
|
<0.1
|
<0.01
|
|
WSR33
|
2/4/2024
|
Cloudy
|
Mid-flood
|
Moderate
|
S
|
1
|
11:10:00 AM
|
9.16
|
8.16
|
32.96
|
23.93
|
1.48
|
3.00
|
<0.1
|
<0.01
|
|
WSR33
|
2/4/2024
|
Cloudy
|
Mid-flood
|
Moderate
|
M
|
4
|
11:11:00 AM
|
9.07
|
8.16
|
32.95
|
23.92
|
1.44
|
3.00
|
<0.1
|
<0.01
|
|
WSR33
|
2/4/2024
|
Cloudy
|
Mid-flood
|
Moderate
|
M
|
4
|
11:11:00 AM
|
9.09
|
8.20
|
33.06
|
23.89
|
1.45
|
3.00
|
<0.1
|
<0.01
|
|
WSR33
|
2/4/2024
|
Cloudy
|
Mid-flood
|
Moderate
|
B
|
6
|
11:12:00 AM
|
9.22
|
8.15
|
33.02
|
23.93
|
1.48
|
2.50
|
<0.1
|
<0.01
|
|
WSR33
|
2/4/2024
|
Cloudy
|
Mid-flood
|
Moderate
|
B
|
6
|
11:12:00 AM
|
9.07
|
8.14
|
33.01
|
23.93
|
1.47
|
3.00
|
<0.1
|
<0.01
|
|
WSR36
|
2/4/2024
|
Cloudy
|
Mid-flood
|
Moderate
|
S
|
1
|
11:25:00 AM
|
8.21
|
8.16
|
33.95
|
23.80
|
1.45
|
2.50
|
<0.1
|
<0.01
|
|
WSR36
|
2/4/2024
|
Cloudy
|
Mid-flood
|
Moderate
|
S
|
1
|
11:25:00 AM
|
8.20
|
8.17
|
34.01
|
23.85
|
1.49
|
5.00
|
<0.1
|
<0.01
|
|
WSR36
|
2/4/2024
|
Cloudy
|
Mid-flood
|
Moderate
|
M
|
3
|
11:26:00 AM
|
8.09
|
8.17
|
34.02
|
23.85
|
1.46
|
4.00
|
<0.1
|
<0.01
|
|
WSR36
|
2/4/2024
|
Cloudy
|
Mid-flood
|
Moderate
|
M
|
3
|
11:26:00 AM
|
8.24
|
8.19
|
33.97
|
23.77
|
1.46
|
2.50
|
<0.1
|
<0.01
|
|
WSR36
|
2/4/2024
|
Cloudy
|
Mid-flood
|
Moderate
|
B
|
6
|
11:26:00 AM
|
8.09
|
8.15
|
33.97
|
23.83
|
1.49
|
3.00
|
<0.1
|
<0.01
|
|
WSR36
|
2/4/2024
|
Cloudy
|
Mid-flood
|
Moderate
|
B
|
6
|
11:26:00 AM
|
8.23
|
8.15
|
33.95
|
23.77
|
1.45
|
3.00
|
<0.1
|
<0.01
|
|
WSR37
|
2/4/2024
|
Cloudy
|
Mid-flood
|
Moderate
|
S
|
1
|
11:40:00 AM
|
8.00
|
8.32
|
33.93
|
23.74
|
2.09
|
6.00
|
<0.1
|
<0.01
|
|
WSR37
|
2/4/2024
|
Cloudy
|
Mid-flood
|
Moderate
|
S
|
1
|
11:40:00 AM
|
7.94
|
8.30
|
33.79
|
23.75
|
2.12
|
4.00
|
<0.1
|
<0.01
|
|
WSR37
|
2/4/2024
|
Cloudy
|
Mid-flood
|
Moderate
|
M
|
4
|
11:41:00 AM
|
8.04
|
8.26
|
33.87
|
23.76
|
2.13
|
3.00
|
<0.1
|
<0.01
|
|
WSR37
|
2/4/2024
|
Cloudy
|
Mid-flood
|
Moderate
|
M
|
4
|
11:41:00 AM
|
7.99
|
8.25
|
33.79
|
23.73
|
2.12
|
3.00
|
<0.1
|
<0.01
|
|
WSR37
|
2/4/2024
|
Cloudy
|
Mid-flood
|
Moderate
|
B
|
7
|
11:42:00 AM
|
7.92
|
8.30
|
33.90
|
23.68
|
2.11
|
5.00
|
<0.1
|
<0.01
|
|
WSR37
|
2/4/2024
|
Cloudy
|
Mid-flood
|
Moderate
|
B
|
7
|
11:42:00 AM
|
8.02
|
8.28
|
33.91
|
23.71
|
2.12
|
4.00
|
<0.1
|
<0.01
|
|
Location
|
Date
|
Weather
|
Tide
|
Sea Condition
|
Water Level
|
Depth (m)
|
Time
|
DO (mg/L)
|
pH
|
Sal (ppt)
|
Temp ((�XC)
|
Turbidty (NTU)
|
SS (mg/L)
|
Iron (mg/L)
|
Total Residual Chlorine (mg/L)
|
|
NF1
|
2/4/2024
|
Cloudy
|
Mid-flood
|
Moderate
|
S
|
1
|
12:04:00 PM
|
9.06
|
8.15
|
32.55
|
23.65
|
2.25
|
7.00
|
<0.1
|
<0.01
|
|
NF1
|
2/4/2024
|
Cloudy
|
Mid-flood
|
Moderate
|
S
|
1
|
12:04:00 PM
|
9.11
|
8.17
|
32.57
|
23.68
|
2.24
|
7.00
|
<0.1
|
<0.01
|
|
NF1
|
2/4/2024
|
Cloudy
|
Mid-flood
|
Moderate
|
M
|
7
|
12:05:00 PM
|
9.05
|
8.21
|
32.51
|
23.67
|
2.21
|
4.00
|
<0.1
|
<0.01
|
|
NF1
|
2/4/2024
|
Cloudy
|
Mid-flood
|
Moderate
|
M
|
7
|
12:05:00 PM
|
9.13
|
8.15
|
32.51
|
23.70
|
2.23
|
8.00
|
<0.1
|
<0.01
|
|
NF1
|
2/4/2024
|
Cloudy
|
Mid-flood
|
Moderate
|
B
|
13
|
12:06:00 PM
|
9.08
|
8.20
|
32.63
|
23.69
|
2.21
|
5.00
|
<0.1
|
<0.01
|
|
NF1
|
2/4/2024
|
Cloudy
|
Mid-flood
|
Moderate
|
B
|
13
|
12:06:00 PM
|
9.16
|
8.15
|
32.62
|
23.63
|
2.25
|
6.00
|
<0.1
|
<0.01
|
|
NF2
|
2/4/2024
|
Cloudy
|
Mid-flood
|
Moderate
|
S
|
1
|
11:56:00 AM
|
8.01
|
8.25
|
32.48
|
23.58
|
1.77
|
6.00
|
<0.1
|
<0.01
|
|
NF2
|
2/4/2024
|
Cloudy
|
Mid-flood
|
Moderate
|
S
|
1
|
11:56:00 AM
|
7.96
|
8.28
|
32.54
|
23.60
|
1.75
|
6.00
|
<0.1
|
<0.01
|
|
NF2
|
2/4/2024
|
Cloudy
|
Mid-flood
|
Moderate
|
M
|
5
|
11:57:00 AM
|
7.94
|
8.25
|
32.48
|
23.57
|
1.76
|
10.00
|
<0.1
|
<0.01
|
|
NF2
|
2/4/2024
|
Cloudy
|
Mid-flood
|
Moderate
|
M
|
5
|
11:57:00 AM
|
7.90
|
8.31
|
32.43
|
23.58
|
1.79
|
8.00
|
<0.1
|
<0.01
|
|
NF2
|
2/4/2024
|
Cloudy
|
Mid-flood
|
Moderate
|
B
|
9
|
11:58:00 AM
|
8.04
|
8.31
|
32.44
|
23.60
|
1.74
|
6.00
|
<0.1
|
<0.01
|
|
NF2
|
2/4/2024
|
Cloudy
|
Mid-flood
|
Moderate
|
B
|
9
|
11:58:00 AM
|
7.90
|
8.28
|
32.47
|
23.60
|
1.75
|
5.00
|
<0.1
|
<0.01
|
|
NF3
|
2/4/2024
|
Cloudy
|
Mid-flood
|
Moderate
|
S
|
1
|
11:49:00 AM
|
8.22
|
8.23
|
33.70
|
23.78
|
1.73
|
7.00
|
<0.1
|
<0.01
|
|
NF3
|
2/4/2024
|
Cloudy
|
Mid-flood
|
Moderate
|
S
|
1
|
11:49:00 AM
|
8.30
|
8.25
|
33.74
|
23.74
|
1.72
|
6.00
|
<0.1
|
<0.01
|
|
NF3
|
2/4/2024
|
Cloudy
|
Mid-flood
|
Moderate
|
M
|
6
|
11:50:00 AM
|
8.37
|
8.29
|
33.68
|
23.79
|
1.73
|
4.00
|
<0.1
|
<0.01
|
|
NF3
|
2/4/2024
|
Cloudy
|
Mid-flood
|
Moderate
|
M
|
6
|
11:50:00 AM
|
8.34
|
8.28
|
33.81
|
23.79
|
1.69
|
4.00
|
<0.1
|
<0.01
|
|
NF3
|
2/4/2024
|
Cloudy
|
Mid-flood
|
Moderate
|
B
|
11
|
11:51:00 AM
|
8.29
|
8.24
|
33.72
|
23.82
|
1.70
|
11.00
|
<0.1
|
<0.01
|
|
NF3
|
2/4/2024
|
Cloudy
|
Mid-flood
|
Moderate
|
B
|
11
|
11:51:00 AM
|
8.28
|
8.29
|
33.70
|
23.77
|
1.71
|
8.00
|
<0.1
|
<0.01
|
|
CE
|
4/4/2024
|
Cloudy
|
Mid-flood
|
Moderate
|
S
|
1
|
10:48:00 AM
|
8.56
|
8.30
|
32.54
|
23.83
|
2.37
|
2.50
|
<0.1
|
<0.01
|
|
CE
|
4/4/2024
|
Cloudy
|
Mid-flood
|
Moderate
|
S
|
1
|
10:48:00 AM
|
8.45
|
8.33
|
32.61
|
23.79
|
2.33
|
2.50
|
<0.1
|
<0.01
|
|
CE
|
4/4/2024
|
Cloudy
|
Mid-flood
|
Moderate
|
M
|
11
|
10:49:00 AM
|
8.49
|
8.29
|
32.61
|
23.85
|
2.36
|
3.00
|
<0.1
|
<0.01
|
|
CE
|
4/4/2024
|
Cloudy
|
Mid-flood
|
Moderate
|
M
|
11
|
10:49:00 AM
|
8.53
|
8.32
|
32.60
|
23.85
|
2.38
|
3.00
|
<0.1
|
<0.01
|
|
CE
|
4/4/2024
|
Cloudy
|
Mid-flood
|
Moderate
|
B
|
21
|
10:50:00 AM
|
8.48
|
8.34
|
32.56
|
23.88
|
2.44
|
3.00
|
<0.1
|
<0.01
|
|
CE
|
4/4/2024
|
Cloudy
|
Mid-flood
|
Moderate
|
B
|
21
|
10:50:00 AM
|
8.46
|
8.29
|
32.53
|
23.79
|
2.53
|
2.50
|
<0.1
|
<0.01
|
|
CF
|
4/4/2024
|
Cloudy
|
Mid-flood
|
Moderate
|
S
|
1
|
8:00:00 AM
|
8.07
|
8.24
|
33.95
|
24.01
|
2.62
|
4.00
|
<0.1
|
<0.01
|
|
CF
|
4/4/2024
|
Cloudy
|
Mid-flood
|
Moderate
|
S
|
1
|
8:00:00 AM
|
8.06
|
8.25
|
33.89
|
24.00
|
2.59
|
3.00
|
<0.1
|
<0.01
|
|
CF
|
4/4/2024
|
Cloudy
|
Mid-flood
|
Moderate
|
M
|
10
|
8:01:00 AM
|
8.00
|
8.28
|
33.89
|
23.97
|
2.64
|
3.00
|
<0.1
|
<0.01
|
|
CF
|
4/4/2024
|
Cloudy
|
Mid-flood
|
Moderate
|
M
|
10
|
8:01:00 AM
|
8.01
|
8.27
|
33.91
|
24.00
|
2.70
|
4.00
|
<0.1
|
<0.01
|
|
CF
|
4/4/2024
|
Cloudy
|
Mid-flood
|
Moderate
|
B
|
20
|
8:02:00 AM
|
8.03
|
8.28
|
33.90
|
24.03
|
2.65
|
3.00
|
<0.1
|
<0.01
|
|
CF
|
4/4/2024
|
Cloudy
|
Mid-flood
|
Moderate
|
B
|
20
|
8:02:00 AM
|
7.94
|
8.24
|
33.88
|
24.01
|
2.64
|
2.50
|
<0.1
|
<0.01
|
|
Location
|
Date
|
Weather
|
Tide
|
Sea Condition
|
Water Level
|
Depth (m)
|
Time
|
DO (mg/L)
|
pH
|
Sal (ppt)
|
Temp ((�XC)
|
Turbidty (NTU)
|
SS (mg/L)
|
Iron (mg/L)
|
Total Residual Chlorine (mg/L)
|
|
WSR01
|
4/4/2024
|
Cloudy
|
Mid-flood
|
Moderate
|
S
|
1
|
8:22:00 AM
|
7.78
|
8.26
|
33.27
|
24.08
|
1.92
|
3.00
|
<0.1
|
<0.01
|
|
WSR01
|
4/4/2024
|
Cloudy
|
Mid-flood
|
Moderate
|
S
|
1
|
8:22:00 AM
|
7.85
|
8.25
|
33.18
|
24.02
|
1.90
|
4.00
|
<0.1
|
<0.01
|
|
WSR01
|
4/4/2024
|
Cloudy
|
Mid-flood
|
Moderate
|
M
|
5
|
8:23:00 AM
|
7.71
|
8.28
|
33.21
|
24.04
|
1.91
|
2.50
|
<0.1
|
<0.01
|
|
WSR01
|
4/4/2024
|
Cloudy
|
Mid-flood
|
Moderate
|
M
|
5
|
8:23:00 AM
|
7.71
|
8.30
|
33.22
|
24.05
|
1.88
|
2.50
|
<0.1
|
<0.01
|
|
WSR01
|
4/4/2024
|
Cloudy
|
Mid-flood
|
Moderate
|
B
|
8
|
8:24:00 AM
|
7.85
|
8.29
|
33.29
|
24.03
|
1.94
|
2.50
|
<0.1
|
<0.01
|
|
WSR01
|
4/4/2024
|
Cloudy
|
Mid-flood
|
Moderate
|
B
|
8
|
8:24:00 AM
|
7.79
|
8.29
|
33.26
|
24.02
|
1.90
|
2.50
|
<0.1
|
<0.01
|
|
WSR02
|
4/4/2024
|
Cloudy
|
Mid-flood
|
Moderate
|
S
|
1
|
8:40:00 AM
|
8.58
|
8.31
|
33.32
|
23.77
|
2.17
|
2.50
|
<0.1
|
<0.01
|
|
WSR02
|
4/4/2024
|
Cloudy
|
Mid-flood
|
Moderate
|
S
|
1
|
8:40:00 AM
|
8.66
|
8.29
|
33.30
|
23.70
|
2.14
|
2.50
|
<0.1
|
<0.01
|
|
WSR02
|
4/4/2024
|
Cloudy
|
Mid-flood
|
Moderate
|
M
|
5
|
8:41:00 AM
|
8.62
|
8.27
|
33.39
|
23.70
|
2.17
|
4.00
|
<0.1
|
<0.01
|
|
WSR02
|
4/4/2024
|
Cloudy
|
Mid-flood
|
Moderate
|
M
|
5
|
8:41:00 AM
|
8.62
|
8.31
|
33.31
|
23.73
|
2.04
|
2.50
|
<0.1
|
<0.01
|
|
WSR02
|
4/4/2024
|
Cloudy
|
Mid-flood
|
Moderate
|
B
|
9
|
8:42:00 AM
|
8.61
|
8.31
|
33.29
|
23.71
|
2.07
|
4.00
|
<0.1
|
<0.01
|
|
WSR02
|
4/4/2024
|
Cloudy
|
Mid-flood
|
Moderate
|
B
|
9
|
8:42:00 AM
|
8.62
|
8.34
|
33.37
|
23.71
|
2.09
|
3.00
|
<0.1
|
<0.01
|
|
WSR03
|
4/4/2024
|
Cloudy
|
Mid-flood
|
Moderate
|
S
|
1
|
8:53:00 AM
|
8.67
|
8.13
|
33.58
|
23.96
|
2.20
|
5.00
|
<0.1
|
<0.01
|
|
WSR03
|
4/4/2024
|
Cloudy
|
Mid-flood
|
Moderate
|
S
|
1
|
8:53:00 AM
|
8.65
|
8.15
|
33.57
|
23.98
|
2.17
|
3.00
|
<0.1
|
<0.01
|
|
WSR03
|
4/4/2024
|
Cloudy
|
Mid-flood
|
Moderate
|
M
|
4
|
8:54:00 AM
|
8.73
|
8.17
|
33.62
|
23.98
|
2.15
|
2.50
|
<0.1
|
<0.01
|
|
WSR03
|
4/4/2024
|
Cloudy
|
Mid-flood
|
Moderate
|
M
|
4
|
8:54:00 AM
|
8.62
|
8.14
|
33.59
|
23.94
|
2.09
|
2.50
|
<0.1
|
<0.01
|
|
WSR03
|
4/4/2024
|
Cloudy
|
Mid-flood
|
Moderate
|
B
|
7
|
8:55:00 AM
|
8.67
|
8.20
|
33.67
|
23.97
|
2.07
|
5.00
|
<0.1
|
<0.01
|
|
WSR03
|
4/4/2024
|
Cloudy
|
Mid-flood
|
Moderate
|
B
|
7
|
8:55:00 AM
|
8.70
|
8.20
|
33.57
|
23.95
|
2.15
|
3.00
|
<0.1
|
<0.01
|
|
WSR04
|
4/4/2024
|
Cloudy
|
Mid-flood
|
Moderate
|
S
|
1
|
9:06:00 AM
|
8.56
|
8.18
|
33.05
|
24.03
|
1.88
|
4.00
|
<0.1
|
<0.01
|
|
WSR04
|
4/4/2024
|
Cloudy
|
Mid-flood
|
Moderate
|
S
|
1
|
9:06:00 AM
|
8.55
|
8.16
|
33.14
|
24.02
|
1.92
|
3.00
|
<0.1
|
<0.01
|
|
WSR04
|
4/4/2024
|
Cloudy
|
Mid-flood
|
Moderate
|
M
|
4
|
9:07:00 AM
|
8.63
|
8.22
|
33.09
|
24.03
|
1.93
|
3.00
|
<0.1
|
<0.01
|
|
WSR04
|
4/4/2024
|
Cloudy
|
Mid-flood
|
Moderate
|
M
|
4
|
9:07:00 AM
|
8.57
|
8.20
|
33.04
|
24.10
|
1.90
|
4.00
|
<0.1
|
<0.01
|
|
WSR04
|
4/4/2024
|
Cloudy
|
Mid-flood
|
Moderate
|
B
|
6
|
9:08:00 AM
|
8.57
|
8.21
|
33.08
|
24.08
|
1.90
|
2.50
|
<0.1
|
<0.01
|
|
WSR04
|
4/4/2024
|
Cloudy
|
Mid-flood
|
Moderate
|
B
|
6
|
9:08:00 AM
|
8.63
|
8.18
|
33.09
|
24.03
|
1.94
|
2.50
|
<0.1
|
<0.01
|
|
WSR16
|
4/4/2024
|
Cloudy
|
Mid-flood
|
Moderate
|
S
|
1
|
10:28:00 AM
|
9.09
|
8.22
|
32.95
|
23.72
|
2.20
|
3.00
|
<0.1
|
<0.01
|
|
WSR16
|
4/4/2024
|
Cloudy
|
Mid-flood
|
Moderate
|
S
|
1
|
10:28:00 AM
|
9.21
|
8.18
|
32.92
|
23.76
|
2.19
|
4.00
|
<0.1
|
<0.01
|
|
WSR16
|
4/4/2024
|
Cloudy
|
Mid-flood
|
Moderate
|
M
|
8
|
10:29:00 AM
|
9.18
|
8.17
|
32.92
|
23.78
|
2.18
|
4.00
|
<0.1
|
<0.01
|
|
WSR16
|
4/4/2024
|
Cloudy
|
Mid-flood
|
Moderate
|
M
|
8
|
10:29:00 AM
|
9.13
|
8.19
|
32.92
|
23.69
|
2.18
|
4.00
|
<0.1
|
<0.01
|
|
WSR16
|
4/4/2024
|
Cloudy
|
Mid-flood
|
Moderate
|
B
|
16
|
10:30:00 AM
|
9.07
|
8.22
|
32.90
|
23.75
|
2.19
|
4.00
|
<0.1
|
<0.01
|
|
WSR16
|
4/4/2024
|
Cloudy
|
Mid-flood
|
Moderate
|
B
|
16
|
10:30:00 AM
|
9.16
|
8.23
|
32.86
|
23.75
|
2.19
|
2.50
|
<0.1
|
<0.01
|
|
Location
|
Date
|
Weather
|
Tide
|
Sea Condition
|
Water Level
|
Depth (m)
|
Time
|
DO (mg/L)
|
pH
|
Sal (ppt)
|
Temp ((�XC)
|
Turbidty (NTU)
|
SS (mg/L)
|
Iron (mg/L)
|
Total Residual Chlorine (mg/L)
|
|
WSR33
|
4/4/2024
|
Cloudy
|
Mid-flood
|
Moderate
|
S
|
1
|
9:20:00 AM
|
7.86
|
8.26
|
32.81
|
23.94
|
2.01
|
2.50
|
<0.1
|
<0.01
|
|
WSR33
|
4/4/2024
|
Cloudy
|
Mid-flood
|
Moderate
|
S
|
1
|
9:20:00 AM
|
7.73
|
8.29
|
32.74
|
23.92
|
2.04
|
2.50
|
<0.1
|
<0.01
|
|
WSR33
|
4/4/2024
|
Cloudy
|
Mid-flood
|
Moderate
|
M
|
4
|
9:21:00 AM
|
7.83
|
8.32
|
32.82
|
23.94
|
2.04
|
3.00
|
<0.1
|
<0.01
|
|
WSR33
|
4/4/2024
|
Cloudy
|
Mid-flood
|
Moderate
|
M
|
4
|
9:21:00 AM
|
7.79
|
8.33
|
32.77
|
23.89
|
2.01
|
2.50
|
<0.1
|
<0.01
|
|
WSR33
|
4/4/2024
|
Cloudy
|
Mid-flood
|
Moderate
|
B
|
6
|
9:22:00 AM
|
7.75
|
8.30
|
32.84
|
23.89
|
2.00
|
3.00
|
<0.1
|
<0.01
|
|
WSR33
|
4/4/2024
|
Cloudy
|
Mid-flood
|
Moderate
|
B
|
6
|
9:22:00 AM
|
7.85
|
8.29
|
32.81
|
23.92
|
2.00
|
2.50
|
<0.1
|
<0.01
|
|
WSR36
|
4/4/2024
|
Cloudy
|
Mid-flood
|
Moderate
|
S
|
1
|
9:35:00 AM
|
8.91
|
8.29
|
32.50
|
23.90
|
1.80
|
3.00
|
<0.1
|
<0.01
|
|
WSR36
|
4/4/2024
|
Cloudy
|
Mid-flood
|
Moderate
|
S
|
1
|
9:35:00 AM
|
8.83
|
8.29
|
32.54
|
23.86
|
1.83
|
2.50
|
<0.1
|
<0.01
|
|
WSR36
|
4/4/2024
|
Cloudy
|
Mid-flood
|
Moderate
|
M
|
4
|
9:36:00 AM
|
8.96
|
8.33
|
32.43
|
23.90
|
1.85
|
3.00
|
<0.1
|
<0.01
|
|
WSR36
|
4/4/2024
|
Cloudy
|
Mid-flood
|
Moderate
|
M
|
4
|
9:36:00 AM
|
8.86
|
8.33
|
32.50
|
23.95
|
1.79
|
4.00
|
<0.1
|
<0.01
|
|
WSR36
|
4/4/2024
|
Cloudy
|
Mid-flood
|
Moderate
|
B
|
6
|
9:36:00 AM
|
8.89
|
8.36
|
32.45
|
23.97
|
1.82
|
3.00
|
<0.1
|
<0.01
|
|
WSR36
|
4/4/2024
|
Cloudy
|
Mid-flood
|
Moderate
|
B
|
6
|
9:36:00 AM
|
8.90
|
8.28
|
32.46
|
23.96
|
1.84
|
4.00
|
<0.1
|
<0.01
|
|
WSR37
|
4/4/2024
|
Cloudy
|
Mid-flood
|
Moderate
|
S
|
1
|
9:50:00 AM
|
8.53
|
8.27
|
32.40
|
23.97
|
1.88
|
4.00
|
<0.1
|
<0.01
|
|
WSR37
|
4/4/2024
|
Cloudy
|
Mid-flood
|
Moderate
|
S
|
1
|
9:50:00 AM
|
8.50
|
8.29
|
32.38
|
23.93
|
1.90
|
5.00
|
<0.1
|
<0.01
|
|
WSR37
|
4/4/2024
|
Cloudy
|
Mid-flood
|
Moderate
|
M
|
4
|
9:51:00 AM
|
8.63
|
8.26
|
32.39
|
23.97
|
1.92
|
3.00
|
<0.1
|
<0.01
|
|
WSR37
|
4/4/2024
|
Cloudy
|
Mid-flood
|
Moderate
|
M
|
4
|
9:51:00 AM
|
8.63
|
8.33
|
32.36
|
23.95
|
1.88
|
2.50
|
<0.1
|
<0.01
|
|
WSR37
|
4/4/2024
|
Cloudy
|
Mid-flood
|
Moderate
|
B
|
7
|
9:52:00 AM
|
8.59
|
8.25
|
32.40
|
23.92
|
1.86
|
5.00
|
<0.1
|
<0.01
|
|
WSR37
|
4/4/2024
|
Cloudy
|
Mid-flood
|
Moderate
|
B
|
7
|
9:52:00 AM
|
8.56
|
8.32
|
32.37
|
23.97
|
1.91
|
3.00
|
<0.1
|
<0.01
|
|
NF1
|
4/4/2024
|
Cloudy
|
Mid-flood
|
Moderate
|
S
|
1
|
10:15:00 AM
|
8.22
|
8.23
|
32.29
|
23.70
|
2.08
|
3.00
|
<0.1
|
<0.01
|
|
NF1
|
4/4/2024
|
Cloudy
|
Mid-flood
|
Moderate
|
S
|
1
|
10:15:00 AM
|
8.23
|
8.30
|
32.29
|
23.65
|
2.09
|
3.00
|
<0.1
|
<0.01
|
|
NF1
|
4/4/2024
|
Cloudy
|
Mid-flood
|
Moderate
|
M
|
7
|
10:16:00 AM
|
8.13
|
8.24
|
32.27
|
23.71
|
2.11
|
2.50
|
<0.1
|
<0.01
|
|
NF1
|
4/4/2024
|
Cloudy
|
Mid-flood
|
Moderate
|
M
|
7
|
10:16:00 AM
|
8.24
|
8.29
|
32.31
|
23.70
|
2.09
|
3.00
|
<0.1
|
<0.01
|
|
NF1
|
4/4/2024
|
Cloudy
|
Mid-flood
|
Moderate
|
B
|
13
|
10:17:00 AM
|
8.22
|
8.28
|
32.34
|
23.64
|
2.11
|
2.50
|
<0.1
|
<0.01
|
|
NF1
|
4/4/2024
|
Cloudy
|
Mid-flood
|
Moderate
|
B
|
13
|
10:17:00 AM
|
8.16
|
8.23
|
32.34
|
23.71
|
2.10
|
4.00
|
<0.1
|
<0.01
|
|
NF2
|
4/4/2024
|
Cloudy
|
Mid-flood
|
Moderate
|
S
|
1
|
10:07:00 AM
|
8.35
|
8.17
|
33.29
|
23.86
|
2.22
|
2.50
|
<0.1
|
<0.01
|
|
NF2
|
4/4/2024
|
Cloudy
|
Mid-flood
|
Moderate
|
S
|
1
|
10:07:00 AM
|
8.21
|
8.16
|
33.29
|
23.86
|
2.23
|
3.00
|
<0.1
|
<0.01
|
|
NF2
|
4/4/2024
|
Cloudy
|
Mid-flood
|
Moderate
|
M
|
5
|
10:08:00 AM
|
8.35
|
8.13
|
33.25
|
23.88
|
2.19
|
2.50
|
<0.1
|
<0.01
|
|
NF2
|
4/4/2024
|
Cloudy
|
Mid-flood
|
Moderate
|
M
|
5
|
10:08:00 AM
|
8.35
|
8.20
|
33.32
|
23.84
|
2.19
|
4.00
|
<0.1
|
<0.01
|
|
NF2
|
4/4/2024
|
Cloudy
|
Mid-flood
|
Moderate
|
B
|
10
|
10:09:00 AM
|
8.26
|
8.14
|
33.21
|
23.86
|
2.20
|
7.00
|
<0.1
|
<0.01
|
|
NF2
|
4/4/2024
|
Cloudy
|
Mid-flood
|
Moderate
|
B
|
10
|
10:09:00 AM
|
8.21
|
8.13
|
33.25
|
23.85
|
2.23
|
10.00
|
<0.1
|
<0.01
|
|
Location
|
Date
|
Weather
|
Tide
|
Sea Condition
|
Water Level
|
Depth (m)
|
Time
|
DO (mg/L)
|
pH
|
Sal (ppt)
|
Temp ((�XC)
|
Turbidty (NTU)
|
SS (mg/L)
|
Iron (mg/L)
|
Total Residual Chlorine (mg/L)
|
|
NF3
|
4/4/2024
|
Cloudy
|
Mid-flood
|
Moderate
|
S
|
1
|
9:59:00 AM
|
8.51
|
8.35
|
32.93
|
23.88
|
2.19
|
3.00
|
<0.1
|
<0.01
|
|
NF3
|
4/4/2024
|
Cloudy
|
Mid-flood
|
Moderate
|
S
|
1
|
9:59:00 AM
|
8.38
|
8.37
|
32.87
|
23.87
|
2.22
|
2.50
|
<0.1
|
<0.01
|
|
NF3
|
4/4/2024
|
Cloudy
|
Mid-flood
|
Moderate
|
M
|
6
|
10:00:00 AM
|
8.39
|
8.29
|
32.96
|
23.79
|
2.26
|
3.00
|
<0.1
|
<0.01
|
|
NF3
|
4/4/2024
|
Cloudy
|
Mid-flood
|
Moderate
|
M
|
6
|
10:00:00 AM
|
8.46
|
8.34
|
32.84
|
23.78
|
2.16
|
3.00
|
<0.1
|
<0.01
|
|
NF3
|
4/4/2024
|
Cloudy
|
Mid-flood
|
Moderate
|
B
|
11
|
10:01:00 AM
|
8.40
|
8.33
|
32.88
|
23.82
|
2.12
|
5.00
|
<0.1
|
<0.01
|
|
NF3
|
4/4/2024
|
Cloudy
|
Mid-flood
|
Moderate
|
B
|
11
|
10:01:00 AM
|
8.50
|
8.30
|
32.89
|
23.79
|
2.18
|
3.00
|
<0.1
|
<0.01
|
|
CE
|
6/4/2024
|
Cloudy
|
Mid-ebb
|
Moderate
|
S
|
1
|
9:24:00 AM
|
8.13
|
8.21
|
32.38
|
23.27
|
2.67
|
2.50
|
<0.1
|
<0.01
|
|
CE
|
6/4/2024
|
Cloudy
|
Mid-ebb
|
Moderate
|
S
|
1
|
9:24:00 AM
|
8.11
|
8.19
|
32.29
|
23.25
|
2.75
|
3.00
|
<0.1
|
<0.01
|
|
CE
|
6/4/2024
|
Cloudy
|
Mid-ebb
|
Moderate
|
M
|
12
|
9:25:00 AM
|
8.10
|
8.16
|
32.28
|
23.19
|
2.79
|
2.50
|
<0.1
|
<0.01
|
|
CE
|
6/4/2024
|
Cloudy
|
Mid-ebb
|
Moderate
|
M
|
12
|
9:25:00 AM
|
8.23
|
8.18
|
32.29
|
23.26
|
2.76
|
2.50
|
<0.1
|
<0.01
|
|
CE
|
6/4/2024
|
Cloudy
|
Mid-ebb
|
Moderate
|
B
|
22
|
9:26:00 AM
|
8.14
|
8.15
|
32.28
|
23.23
|
2.80
|
4.00
|
<0.1
|
<0.01
|
|
CE
|
6/4/2024
|
Cloudy
|
Mid-ebb
|
Moderate
|
B
|
22
|
9:26:00 AM
|
8.18
|
8.16
|
32.28
|
23.25
|
2.61
|
8.00
|
<0.1
|
<0.01
|
|
CF
|
6/4/2024
|
Cloudy
|
Mid-ebb
|
Moderate
|
S
|
1
|
12:33:00 PM
|
8.77
|
8.29
|
32.89
|
23.23
|
2.51
|
3.00
|
<0.1
|
<0.01
|
|
CF
|
6/4/2024
|
Cloudy
|
Mid-ebb
|
Moderate
|
S
|
1
|
12:33:00 PM
|
8.82
|
8.29
|
32.85
|
23.22
|
2.44
|
3.00
|
<0.1
|
<0.01
|
|
CF
|
6/4/2024
|
Cloudy
|
Mid-ebb
|
Moderate
|
M
|
11
|
12:34:00 PM
|
8.82
|
8.28
|
32.90
|
23.25
|
2.44
|
2.50
|
<0.1
|
<0.01
|
|
CF
|
6/4/2024
|
Cloudy
|
Mid-ebb
|
Moderate
|
M
|
11
|
12:34:00 PM
|
8.74
|
8.29
|
32.92
|
23.28
|
2.49
|
2.50
|
<0.1
|
<0.01
|
|
CF
|
6/4/2024
|
Cloudy
|
Mid-ebb
|
Moderate
|
B
|
20
|
12:35:00 PM
|
8.86
|
8.36
|
32.94
|
23.27
|
2.48
|
4.00
|
<0.1
|
<0.01
|
|
CF
|
6/4/2024
|
Cloudy
|
Mid-ebb
|
Moderate
|
B
|
20
|
12:35:00 PM
|
8.77
|
8.35
|
32.93
|
23.31
|
2.49
|
4.00
|
<0.1
|
<0.01
|
|
WSR01
|
6/4/2024
|
Cloudy
|
Mid-ebb
|
Moderate
|
S
|
1
|
12:10:00 PM
|
9.16
|
8.35
|
33.07
|
23.40
|
2.25
|
3.00
|
<0.1
|
<0.01
|
|
WSR01
|
6/4/2024
|
Cloudy
|
Mid-ebb
|
Moderate
|
S
|
1
|
12:10:00 PM
|
9.03
|
8.33
|
33.08
|
23.43
|
2.17
|
4.00
|
<0.1
|
<0.01
|
|
WSR01
|
6/4/2024
|
Cloudy
|
Mid-ebb
|
Moderate
|
M
|
4
|
12:11:00 PM
|
9.09
|
8.29
|
33.10
|
23.37
|
2.22
|
3.00
|
<0.1
|
<0.01
|
|
WSR01
|
6/4/2024
|
Cloudy
|
Mid-ebb
|
Moderate
|
M
|
4
|
12:11:00 PM
|
9.04
|
8.37
|
33.01
|
23.40
|
2.23
|
4.00
|
<0.1
|
<0.01
|
|
WSR01
|
6/4/2024
|
Cloudy
|
Mid-ebb
|
Moderate
|
B
|
8
|
12:12:00 PM
|
9.18
|
8.33
|
33.10
|
23.41
|
2.21
|
3.00
|
<0.1
|
<0.01
|
|
WSR01
|
6/4/2024
|
Cloudy
|
Mid-ebb
|
Moderate
|
B
|
8
|
12:12:00 PM
|
9.16
|
8.30
|
33.02
|
23.39
|
2.22
|
3.00
|
<0.1
|
<0.01
|
|
WSR02
|
6/4/2024
|
Cloudy
|
Mid-ebb
|
Moderate
|
S
|
1
|
11:51:00 AM
|
8.74
|
8.05
|
33.02
|
23.25
|
1.98
|
6.00
|
<0.1
|
<0.01
|
|
WSR02
|
6/4/2024
|
Cloudy
|
Mid-ebb
|
Moderate
|
S
|
1
|
11:51:00 AM
|
8.77
|
8.12
|
33.03
|
23.25
|
2.03
|
4.00
|
<0.1
|
<0.01
|
|
WSR02
|
6/4/2024
|
Cloudy
|
Mid-ebb
|
Moderate
|
M
|
5
|
11:52:00 AM
|
8.64
|
8.08
|
33.01
|
23.30
|
2.01
|
3.00
|
<0.1
|
<0.01
|
|
WSR02
|
6/4/2024
|
Cloudy
|
Mid-ebb
|
Moderate
|
M
|
5
|
11:52:00 AM
|
8.71
|
8.11
|
33.04
|
23.29
|
2.01
|
2.50
|
<0.1
|
<0.01
|
|
WSR02
|
6/4/2024
|
Cloudy
|
Mid-ebb
|
Moderate
|
B
|
9
|
11:53:00 AM
|
8.68
|
8.09
|
33.06
|
23.26
|
2.02
|
4.00
|
<0.1
|
<0.01
|
|
WSR02
|
6/4/2024
|
Cloudy
|
Mid-ebb
|
Moderate
|
B
|
9
|
11:53:00 AM
|
8.76
|
8.05
|
33.02
|
23.32
|
1.97
|
3.00
|
<0.1
|
<0.01
|
|
Location
|
Date
|
Weather
|
Tide
|
Sea Condition
|
Water Level
|
Depth (m)
|
Time
|
DO (mg/L)
|
pH
|
Sal (ppt)
|
Temp ((�XC)
|
Turbidty (NTU)
|
SS (mg/L)
|
Iron (mg/L)
|
Total Residual Chlorine (mg/L)
|
|
WSR03
|
6/4/2024
|
Cloudy
|
Mid-ebb
|
Moderate
|
S
|
1
|
11:33:00 AM
|
8.37
|
8.31
|
32.02
|
23.47
|
2.23
|
3.00
|
<0.1
|
<0.01
|
|
WSR03
|
6/4/2024
|
Cloudy
|
Mid-ebb
|
Moderate
|
S
|
1
|
11:33:00 AM
|
8.39
|
8.25
|
32.11
|
23.44
|
2.24
|
4.00
|
<0.1
|
<0.01
|
|
WSR03
|
6/4/2024
|
Cloudy
|
Mid-ebb
|
Moderate
|
M
|
4
|
11:34:00 AM
|
8.34
|
8.33
|
32.12
|
23.48
|
2.22
|
6.00
|
<0.1
|
<0.01
|
|
WSR03
|
6/4/2024
|
Cloudy
|
Mid-ebb
|
Moderate
|
M
|
4
|
11:34:00 AM
|
8.29
|
8.27
|
32.07
|
23.40
|
2.22
|
5.00
|
<0.1
|
<0.01
|
|
WSR03
|
6/4/2024
|
Cloudy
|
Mid-ebb
|
Moderate
|
B
|
7
|
11:35:00 AM
|
8.35
|
8.25
|
32.04
|
23.43
|
2.18
|
4.00
|
<0.1
|
<0.01
|
|
WSR03
|
6/4/2024
|
Cloudy
|
Mid-ebb
|
Moderate
|
B
|
7
|
11:35:00 AM
|
8.42
|
8.30
|
32.07
|
23.38
|
2.19
|
5.00
|
<0.1
|
<0.01
|
|
WSR04
|
6/4/2024
|
Cloudy
|
Mid-ebb
|
Moderate
|
S
|
1
|
11:19:00 AM
|
8.58
|
8.11
|
33.20
|
23.53
|
2.04
|
4.00
|
<0.1
|
<0.01
|
|
WSR04
|
6/4/2024
|
Cloudy
|
Mid-ebb
|
Moderate
|
S
|
1
|
11:19:00 AM
|
8.65
|
8.06
|
33.15
|
23.58
|
2.05
|
5.00
|
<0.1
|
<0.01
|
|
WSR04
|
6/4/2024
|
Cloudy
|
Mid-ebb
|
Moderate
|
M
|
4
|
11:20:00 AM
|
8.64
|
8.13
|
33.21
|
23.53
|
2.09
|
5.00
|
<0.1
|
<0.01
|
|
WSR04
|
6/4/2024
|
Cloudy
|
Mid-ebb
|
Moderate
|
M
|
4
|
11:20:00 AM
|
8.65
|
8.11
|
33.15
|
23.58
|
2.08
|
4.00
|
<0.1
|
<0.01
|
|
WSR04
|
6/4/2024
|
Cloudy
|
Mid-ebb
|
Moderate
|
B
|
6
|
11:21:00 AM
|
8.63
|
8.12
|
33.09
|
23.53
|
2.08
|
3.00
|
<0.1
|
<0.01
|
|
WSR04
|
6/4/2024
|
Cloudy
|
Mid-ebb
|
Moderate
|
B
|
6
|
11:21:00 AM
|
8.56
|
8.06
|
33.13
|
23.55
|
2.10
|
6.00
|
<0.1
|
<0.01
|
|
WSR16
|
6/4/2024
|
Cloudy
|
Mid-ebb
|
Moderate
|
S
|
1
|
9:47:00 AM
|
8.06
|
8.21
|
32.65
|
23.41
|
1.97
|
3.00
|
<0.1
|
<0.01
|
|
WSR16
|
6/4/2024
|
Cloudy
|
Mid-ebb
|
Moderate
|
S
|
1
|
9:47:00 AM
|
7.92
|
8.29
|
32.71
|
23.36
|
1.91
|
5.00
|
<0.1
|
<0.01
|
|
WSR16
|
6/4/2024
|
Cloudy
|
Mid-ebb
|
Moderate
|
M
|
8
|
9:48:00 AM
|
8.04
|
8.21
|
32.74
|
23.36
|
1.95
|
4.00
|
<0.1
|
<0.01
|
|
WSR16
|
6/4/2024
|
Cloudy
|
Mid-ebb
|
Moderate
|
M
|
8
|
9:48:00 AM
|
7.92
|
8.25
|
32.66
|
23.41
|
1.91
|
2.50
|
<0.1
|
<0.01
|
|
WSR16
|
6/4/2024
|
Cloudy
|
Mid-ebb
|
Moderate
|
B
|
16
|
9:49:00 AM
|
8.03
|
8.26
|
32.71
|
23.39
|
1.98
|
2.50
|
<0.1
|
<0.01
|
|
WSR16
|
6/4/2024
|
Cloudy
|
Mid-ebb
|
Moderate
|
B
|
16
|
9:49:00 AM
|
7.96
|
8.24
|
32.65
|
23.33
|
1.92
|
4.00
|
<0.1
|
<0.01
|
|
WSR33
|
6/4/2024
|
Cloudy
|
Mid-ebb
|
Moderate
|
S
|
1
|
11:02:00 AM
|
9.02
|
8.16
|
33.64
|
23.39
|
1.43
|
2.50
|
<0.1
|
<0.01
|
|
WSR33
|
6/4/2024
|
Cloudy
|
Mid-ebb
|
Moderate
|
S
|
1
|
11:02:00 AM
|
9.06
|
8.15
|
33.60
|
23.33
|
1.68
|
2.50
|
<0.1
|
<0.01
|
|
WSR33
|
6/4/2024
|
Cloudy
|
Mid-ebb
|
Moderate
|
M
|
4
|
11:03:00 AM
|
9.04
|
8.16
|
33.55
|
23.28
|
1.43
|
3.00
|
<0.1
|
<0.01
|
|
WSR33
|
6/4/2024
|
Cloudy
|
Mid-ebb
|
Moderate
|
M
|
4
|
11:03:00 AM
|
8.97
|
8.20
|
33.55
|
23.39
|
1.59
|
3.00
|
<0.1
|
<0.01
|
|
WSR33
|
6/4/2024
|
Cloudy
|
Mid-ebb
|
Moderate
|
B
|
6
|
11:04:00 AM
|
9.02
|
8.17
|
33.59
|
23.36
|
1.44
|
6.00
|
<0.1
|
<0.01
|
|
WSR33
|
6/4/2024
|
Cloudy
|
Mid-ebb
|
Moderate
|
B
|
6
|
11:04:00 AM
|
8.99
|
8.15
|
33.52
|
23.39
|
1.69
|
5.00
|
<0.1
|
<0.01
|
|
WSR36
|
6/4/2024
|
Cloudy
|
Mid-ebb
|
Moderate
|
S
|
1
|
10:46:00 AM
|
8.56
|
8.28
|
32.37
|
23.24
|
2.24
|
2.50
|
<0.1
|
<0.01
|
|
WSR36
|
6/4/2024
|
Cloudy
|
Mid-ebb
|
Moderate
|
S
|
1
|
10:46:00 AM
|
8.56
|
8.27
|
32.45
|
23.18
|
2.26
|
4.00
|
<0.1
|
<0.01
|
|
WSR36
|
6/4/2024
|
Cloudy
|
Mid-ebb
|
Moderate
|
M
|
4
|
10:47:00 AM
|
8.56
|
8.30
|
32.42
|
23.26
|
2.28
|
6.00
|
<0.1
|
<0.01
|
|
WSR36
|
6/4/2024
|
Cloudy
|
Mid-ebb
|
Moderate
|
M
|
4
|
10:47:00 AM
|
8.52
|
8.29
|
32.47
|
23.28
|
2.21
|
4.00
|
<0.1
|
<0.01
|
|
WSR36
|
6/4/2024
|
Cloudy
|
Mid-ebb
|
Moderate
|
B
|
6
|
10:47:00 AM
|
8.53
|
8.29
|
32.41
|
23.22
|
2.29
|
3.00
|
<0.1
|
<0.01
|
|
WSR36
|
6/4/2024
|
Cloudy
|
Mid-ebb
|
Moderate
|
B
|
6
|
10:47:00 AM
|
8.44
|
8.34
|
32.46
|
23.27
|
2.27
|
3.00
|
<0.1
|
<0.01
|
|
Location
|
Date
|
Weather
|
Tide
|
Sea Condition
|
Water Level
|
Depth (m)
|
Time
|
DO (mg/L)
|
pH
|
Sal (ppt)
|
Temp ((�XC)
|
Turbidty (NTU)
|
SS (mg/L)
|
Iron (mg/L)
|
Total Residual Chlorine (mg/L)
|
|
WSR37
|
6/4/2024
|
Cloudy
|
Mid-ebb
|
Moderate
|
S
|
1
|
10:40:00 AM
|
8.95
|
8.20
|
32.75
|
23.37
|
1.83
|
2.50
|
<0.1
|
<0.01
|
|
WSR37
|
6/4/2024
|
Cloudy
|
Mid-ebb
|
Moderate
|
S
|
1
|
10:40:00 AM
|
8.83
|
8.23
|
32.72
|
23.34
|
1.83
|
2.50
|
<0.1
|
<0.01
|
|
WSR37
|
6/4/2024
|
Cloudy
|
Mid-ebb
|
Moderate
|
M
|
4
|
10:41:00 AM
|
8.81
|
8.24
|
32.77
|
23.36
|
1.84
|
2.50
|
<0.1
|
<0.01
|
|
WSR37
|
6/4/2024
|
Cloudy
|
Mid-ebb
|
Moderate
|
M
|
4
|
10:41:00 AM
|
8.92
|
8.19
|
32.80
|
23.31
|
1.81
|
4.00
|
<0.1
|
<0.01
|
|
WSR37
|
6/4/2024
|
Cloudy
|
Mid-ebb
|
Moderate
|
B
|
8
|
10:42:00 AM
|
8.95
|
8.22
|
32.72
|
23.33
|
1.80
|
5.00
|
<0.1
|
<0.01
|
|
WSR37
|
6/4/2024
|
Cloudy
|
Mid-ebb
|
Moderate
|
B
|
8
|
10:42:00 AM
|
8.93
|
8.18
|
32.79
|
23.31
|
1.80
|
8.00
|
<0.1
|
<0.01
|
|
NF1
|
6/4/2024
|
Cloudy
|
Mid-ebb
|
Moderate
|
S
|
1
|
10:10:00 AM
|
8.91
|
8.26
|
33.03
|
23.72
|
2.00
|
3.00
|
<0.1
|
<0.01
|
|
NF1
|
6/4/2024
|
Cloudy
|
Mid-ebb
|
Moderate
|
S
|
1
|
10:10:00 AM
|
9.04
|
8.21
|
32.97
|
23.70
|
1.99
|
2.50
|
<0.1
|
<0.01
|
|
NF1
|
6/4/2024
|
Cloudy
|
Mid-ebb
|
Moderate
|
M
|
7
|
10:11:00 AM
|
9.02
|
8.22
|
33.02
|
23.68
|
2.00
|
4.00
|
<0.1
|
<0.01
|
|
NF1
|
6/4/2024
|
Cloudy
|
Mid-ebb
|
Moderate
|
M
|
7
|
10:11:00 AM
|
8.92
|
8.24
|
33.05
|
23.64
|
1.97
|
2.50
|
<0.1
|
<0.01
|
|
NF1
|
6/4/2024
|
Cloudy
|
Mid-ebb
|
Moderate
|
B
|
12
|
10:12:00 AM
|
8.99
|
8.20
|
33.03
|
23.70
|
1.96
|
2.50
|
<0.1
|
<0.01
|
|
NF1
|
6/4/2024
|
Cloudy
|
Mid-ebb
|
Moderate
|
B
|
12
|
10:12:00 AM
|
9.00
|
8.21
|
33.01
|
23.66
|
1.98
|
2.50
|
<0.1
|
<0.01
|
|
NF2
|
6/4/2024
|
Cloudy
|
Mid-ebb
|
Moderate
|
S
|
1
|
10:25:00 AM
|
8.63
|
8.10
|
33.02
|
23.42
|
1.65
|
4.00
|
<0.1
|
<0.01
|
|
NF2
|
6/4/2024
|
Cloudy
|
Mid-ebb
|
Moderate
|
S
|
1
|
10:25:00 AM
|
8.68
|
8.10
|
33.02
|
23.50
|
1.61
|
3.00
|
<0.1
|
<0.01
|
|
NF2
|
6/4/2024
|
Cloudy
|
Mid-ebb
|
Moderate
|
M
|
5
|
10:26:00 AM
|
8.69
|
8.09
|
33.00
|
23.50
|
1.66
|
4.00
|
<0.1
|
<0.01
|
|
NF2
|
6/4/2024
|
Cloudy
|
Mid-ebb
|
Moderate
|
M
|
5
|
10:26:00 AM
|
8.67
|
8.07
|
32.96
|
23.46
|
1.50
|
6.00
|
<0.1
|
<0.01
|
|
NF2
|
6/4/2024
|
Cloudy
|
Mid-ebb
|
Moderate
|
B
|
9
|
10:27:00 AM
|
8.70
|
8.11
|
33.01
|
23.43
|
1.63
|
6.00
|
<0.1
|
<0.01
|
|
NF2
|
6/4/2024
|
Cloudy
|
Mid-ebb
|
Moderate
|
B
|
9
|
10:27:00 AM
|
8.54
|
8.14
|
32.91
|
23.41
|
1.59
|
7.00
|
<0.1
|
<0.01
|
|
NF3
|
6/4/2024
|
Cloudy
|
Mid-ebb
|
Moderate
|
S
|
1
|
10:33:00 AM
|
8.85
|
8.32
|
32.52
|
23.52
|
1.64
|
6.00
|
<0.1
|
<0.01
|
|
NF3
|
6/4/2024
|
Cloudy
|
Mid-ebb
|
Moderate
|
S
|
1
|
10:33:00 AM
|
8.99
|
8.28
|
32.47
|
23.53
|
1.69
|
7.00
|
<0.1
|
<0.01
|
|
NF3
|
6/4/2024
|
Cloudy
|
Mid-ebb
|
Moderate
|
M
|
6
|
10:34:00 AM
|
8.97
|
8.32
|
32.47
|
23.63
|
1.65
|
7.00
|
<0.1
|
<0.01
|
|
NF3
|
6/4/2024
|
Cloudy
|
Mid-ebb
|
Moderate
|
M
|
6
|
10:34:00 AM
|
8.98
|
8.34
|
32.54
|
23.60
|
1.69
|
4.00
|
<0.1
|
<0.01
|
|
NF3
|
6/4/2024
|
Cloudy
|
Mid-ebb
|
Moderate
|
B
|
11
|
10:35:00 AM
|
9.00
|
8.32
|
32.45
|
23.61
|
1.70
|
4.00
|
<0.1
|
<0.01
|
|
NF3
|
6/4/2024
|
Cloudy
|
Mid-ebb
|
Moderate
|
B
|
11
|
10:35:00 AM
|
8.89
|
8.33
|
32.49
|
23.62
|
1.66
|
2.50
|
<0.1
|
<0.01
|
|
CE
|
9/4/2004
|
Cloudy
|
Mid-ebb
|
Moderate
|
S
|
1
|
10:57:00 AM
|
8.50
|
8.16
|
33.00
|
24.16
|
2.67
|
4.00
|
<0.1
|
<0.01
|
|
CE
|
9/4/2004
|
Cloudy
|
Mid-ebb
|
Moderate
|
S
|
1
|
10:57:00 AM
|
8.57
|
8.24
|
32.97
|
24.12
|
2.65
|
5.00
|
<0.1
|
<0.01
|
|
CE
|
9/4/2004
|
Cloudy
|
Mid-ebb
|
Moderate
|
M
|
12
|
10:58:00 AM
|
8.56
|
8.19
|
33.01
|
24.13
|
2.71
|
7.00
|
<0.1
|
<0.01
|
|
CE
|
9/4/2004
|
Cloudy
|
Mid-ebb
|
Moderate
|
M
|
12
|
10:58:00 AM
|
8.50
|
8.22
|
33.04
|
24.17
|
2.69
|
8.00
|
<0.1
|
<0.01
|
|
CE
|
9/4/2004
|
Cloudy
|
Mid-ebb
|
Moderate
|
B
|
23
|
10:59:00 AM
|
8.52
|
8.22
|
32.94
|
24.12
|
2.57
|
3.00
|
<0.1
|
<0.01
|
|
CE
|
9/4/2004
|
Cloudy
|
Mid-ebb
|
Moderate
|
B
|
23
|
10:59:00 AM
|
8.57
|
8.22
|
33.09
|
24.06
|
2.59
|
4.00
|
<0.1
|
<0.01
|
|
Location
|
Date
|
Weather
|
Tide
|
Sea Condition
|
Water Level
|
Depth (m)
|
Time
|
DO (mg/L)
|
pH
|
Sal (ppt)
|
Temp ((�XC)
|
Turbidty (NTU)
|
SS (mg/L)
|
Iron (mg/L)
|
Total Residual Chlorine (mg/L)
|
|
CF
|
9/4/2004
|
Cloudy
|
Mid-ebb
|
Moderate
|
S
|
1
|
2:05:00 PM
|
8.55
|
8.18
|
32.54
|
24.43
|
3.28
|
3.00
|
<0.1
|
<0.01
|
|
CF
|
9/4/2004
|
Cloudy
|
Mid-ebb
|
Moderate
|
S
|
1
|
2:05:00 PM
|
8.54
|
8.17
|
32.57
|
24.35
|
2.92
|
6.00
|
<0.1
|
<0.01
|
|
CF
|
9/4/2004
|
Cloudy
|
Mid-ebb
|
Moderate
|
M
|
10
|
2:06:00 PM
|
8.52
|
8.21
|
32.64
|
24.38
|
3.08
|
4.00
|
<0.1
|
<0.01
|
|
CF
|
9/4/2004
|
Cloudy
|
Mid-ebb
|
Moderate
|
M
|
10
|
2:06:00 PM
|
8.49
|
8.14
|
32.69
|
24.33
|
3.02
|
3.00
|
<0.1
|
<0.01
|
|
CF
|
9/4/2004
|
Cloudy
|
Mid-ebb
|
Moderate
|
B
|
19
|
2:07:00 PM
|
8.48
|
8.13
|
32.53
|
24.41
|
3.33
|
6.00
|
<0.1
|
<0.01
|
|
CF
|
9/4/2004
|
Cloudy
|
Mid-ebb
|
Moderate
|
B
|
19
|
2:07:00 PM
|
8.57
|
8.16
|
32.67
|
24.44
|
2.41
|
8.00
|
<0.1
|
<0.01
|
|
WSR01
|
9/4/2004
|
Cloudy
|
Mid-ebb
|
Moderate
|
S
|
1
|
1:39:00 PM
|
8.98
|
8.24
|
34.11
|
24.16
|
2.10
|
5.00
|
<0.1
|
<0.01
|
|
WSR01
|
9/4/2004
|
Cloudy
|
Mid-ebb
|
Moderate
|
S
|
1
|
1:39:00 PM
|
8.95
|
8.27
|
34.12
|
24.17
|
2.07
|
5.00
|
<0.1
|
<0.01
|
|
WSR01
|
9/4/2004
|
Cloudy
|
Mid-ebb
|
Moderate
|
M
|
4
|
1:40:00 PM
|
8.98
|
8.24
|
34.18
|
24.19
|
2.02
|
4.00
|
<0.1
|
<0.01
|
|
WSR01
|
9/4/2004
|
Cloudy
|
Mid-ebb
|
Moderate
|
M
|
4
|
1:40:00 PM
|
8.94
|
8.23
|
34.09
|
24.14
|
2.04
|
5.00
|
<0.1
|
<0.01
|
|
WSR01
|
9/4/2004
|
Cloudy
|
Mid-ebb
|
Moderate
|
B
|
7
|
1:41:00 PM
|
8.97
|
8.18
|
34.17
|
24.18
|
2.03
|
2.50
|
<0.1
|
<0.01
|
|
WSR01
|
9/4/2004
|
Cloudy
|
Mid-ebb
|
Moderate
|
B
|
7
|
1:41:00 PM
|
8.96
|
8.24
|
34.16
|
24.13
|
2.05
|
4.00
|
<0.1
|
<0.01
|
|
WSR02
|
9/4/2004
|
Cloudy
|
Mid-ebb
|
Moderate
|
S
|
1
|
1:51:00 PM
|
8.70
|
8.39
|
33.58
|
24.05
|
1.88
|
4.00
|
<0.1
|
<0.01
|
|
WSR02
|
9/4/2004
|
Cloudy
|
Mid-ebb
|
Moderate
|
S
|
1
|
1:51:00 PM
|
8.65
|
8.34
|
33.54
|
24.13
|
1.81
|
5.00
|
<0.1
|
<0.01
|
|
WSR02
|
9/4/2004
|
Cloudy
|
Mid-ebb
|
Moderate
|
M
|
5
|
1:52:00 PM
|
8.66
|
8.36
|
33.60
|
24.11
|
1.89
|
2.50
|
<0.1
|
<0.01
|
|
WSR02
|
9/4/2004
|
Cloudy
|
Mid-ebb
|
Moderate
|
M
|
5
|
1:52:00 PM
|
8.66
|
8.36
|
33.63
|
24.10
|
1.87
|
4.00
|
<0.1
|
<0.01
|
|
WSR02
|
9/4/2004
|
Cloudy
|
Mid-ebb
|
Moderate
|
B
|
9
|
1:53:00 PM
|
8.76
|
8.40
|
33.56
|
24.12
|
1.87
|
7.00
|
<0.1
|
<0.01
|
|
WSR02
|
9/4/2004
|
Cloudy
|
Mid-ebb
|
Moderate
|
B
|
9
|
1:53:00 PM
|
8.75
|
8.32
|
33.54
|
24.15
|
1.82
|
4.00
|
<0.1
|
<0.01
|
|
WSR03
|
9/4/2004
|
Cloudy
|
Mid-ebb
|
Moderate
|
S
|
1
|
12:57:00 PM
|
8.27
|
8.31
|
33.09
|
24.39
|
1.92
|
8.00
|
<0.1
|
<0.01
|
|
WSR03
|
9/4/2004
|
Cloudy
|
Mid-ebb
|
Moderate
|
S
|
1
|
12:57:00 PM
|
8.35
|
8.28
|
33.06
|
24.31
|
1.93
|
5.00
|
<0.1
|
<0.01
|
|
WSR03
|
9/4/2004
|
Cloudy
|
Mid-ebb
|
Moderate
|
M
|
4
|
12:58:00 PM
|
8.28
|
8.34
|
33.01
|
24.39
|
1.91
|
3.00
|
<0.1
|
<0.01
|
|
WSR03
|
9/4/2004
|
Cloudy
|
Mid-ebb
|
Moderate
|
M
|
4
|
12:58:00 PM
|
8.22
|
8.36
|
33.09
|
24.35
|
1.95
|
5.00
|
<0.1
|
<0.01
|
|
WSR03
|
9/4/2004
|
Cloudy
|
Mid-ebb
|
Moderate
|
B
|
8
|
12:59:00 PM
|
8.23
|
8.36
|
33.09
|
24.29
|
1.95
|
6.00
|
<0.1
|
<0.01
|
|
WSR03
|
9/4/2004
|
Cloudy
|
Mid-ebb
|
Moderate
|
B
|
8
|
12:59:00 PM
|
8.28
|
8.28
|
32.94
|
24.34
|
1.99
|
8.00
|
<0.1
|
<0.01
|
|
WSR04
|
9/4/2004
|
Cloudy
|
Mid-ebb
|
Moderate
|
S
|
1
|
12:43:00 PM
|
9.00
|
8.15
|
32.94
|
24.11
|
2.03
|
5.00
|
<0.1
|
<0.01
|
|
WSR04
|
9/4/2004
|
Cloudy
|
Mid-ebb
|
Moderate
|
S
|
1
|
12:43:00 PM
|
9.00
|
8.16
|
32.98
|
24.07
|
2.00
|
7.00
|
<0.1
|
<0.01
|
|
WSR04
|
9/4/2004
|
Cloudy
|
Mid-ebb
|
Moderate
|
M
|
4
|
12:44:00 PM
|
8.96
|
8.12
|
32.90
|
24.15
|
2.05
|
5.00
|
<0.1
|
<0.01
|
|
WSR04
|
9/4/2004
|
Cloudy
|
Mid-ebb
|
Moderate
|
M
|
4
|
12:44:00 PM
|
8.91
|
8.14
|
32.91
|
24.07
|
1.99
|
5.00
|
<0.1
|
<0.01
|
|
WSR04
|
9/4/2004
|
Cloudy
|
Mid-ebb
|
Moderate
|
B
|
6
|
12:45:00 PM
|
8.95
|
8.11
|
32.94
|
24.10
|
1.99
|
5.00
|
<0.1
|
<0.01
|
|
WSR04
|
9/4/2004
|
Cloudy
|
Mid-ebb
|
Moderate
|
B
|
6
|
12:45:00 PM
|
9.00
|
8.17
|
32.93
|
24.09
|
1.96
|
5.00
|
<0.1
|
<0.01
|
|
Location
|
Date
|
Weather
|
Tide
|
Sea Condition
|
Water Level
|
Depth (m)
|
Time
|
DO (mg/L)
|
pH
|
Sal (ppt)
|
Temp ((�XC)
|
Turbidty (NTU)
|
SS (mg/L)
|
Iron (mg/L)
|
Total Residual Chlorine (mg/L)
|
|
WSR16
|
9/4/2004
|
Cloudy
|
Mid-ebb
|
Moderate
|
S
|
1
|
11:18:00 AM
|
8.93
|
8.09
|
33.11
|
24.36
|
1.64
|
5.00
|
<0.1
|
<0.01
|
|
WSR16
|
9/4/2004
|
Cloudy
|
Mid-ebb
|
Moderate
|
S
|
1
|
11:18:00 AM
|
8.83
|
8.11
|
33.10
|
24.32
|
1.56
|
6.00
|
<0.1
|
<0.01
|
|
WSR16
|
9/4/2004
|
Cloudy
|
Mid-ebb
|
Moderate
|
M
|
8
|
11:19:00 AM
|
8.93
|
8.13
|
33.24
|
24.39
|
1.64
|
6.00
|
<0.1
|
<0.01
|
|
WSR16
|
9/4/2004
|
Cloudy
|
Mid-ebb
|
Moderate
|
M
|
8
|
11:19:00 AM
|
8.83
|
8.15
|
33.17
|
24.33
|
1.66
|
6.00
|
<0.1
|
<0.01
|
|
WSR16
|
9/4/2004
|
Cloudy
|
Mid-ebb
|
Moderate
|
B
|
15
|
11:20:00 AM
|
8.84
|
8.14
|
33.20
|
24.40
|
1.61
|
4.00
|
<0.1
|
<0.01
|
|
WSR16
|
9/4/2004
|
Cloudy
|
Mid-ebb
|
Moderate
|
B
|
15
|
11:20:00 AM
|
8.85
|
8.16
|
33.20
|
24.37
|
1.63
|
3.00
|
<0.1
|
<0.01
|
|
WSR33
|
9/4/2004
|
Cloudy
|
Mid-ebb
|
Moderate
|
S
|
1
|
12:28:00 PM
|
8.72
|
8.15
|
33.24
|
24.22
|
2.15
|
3.00
|
<0.1
|
<0.01
|
|
WSR33
|
9/4/2004
|
Cloudy
|
Mid-ebb
|
Moderate
|
S
|
1
|
12:28:00 PM
|
8.71
|
8.15
|
33.24
|
24.25
|
2.21
|
3.00
|
<0.1
|
<0.01
|
|
WSR33
|
9/4/2004
|
Cloudy
|
Mid-ebb
|
Moderate
|
M
|
4
|
12:29:00 PM
|
8.66
|
8.12
|
33.23
|
24.20
|
2.16
|
6.00
|
<0.1
|
<0.01
|
|
WSR33
|
9/4/2004
|
Cloudy
|
Mid-ebb
|
Moderate
|
M
|
4
|
12:29:00 PM
|
8.68
|
8.12
|
33.18
|
24.27
|
2.13
|
4.00
|
<0.1
|
<0.01
|
|
WSR33
|
9/4/2004
|
Cloudy
|
Mid-ebb
|
Moderate
|
B
|
7
|
12:30:00 PM
|
8.76
|
8.15
|
33.24
|
24.19
|
2.16
|
3.00
|
<0.1
|
<0.01
|
|
WSR33
|
9/4/2004
|
Cloudy
|
Mid-ebb
|
Moderate
|
B
|
7
|
12:30:00 PM
|
8.73
|
8.14
|
33.20
|
24.30
|
2.15
|
5.00
|
<0.1
|
<0.01
|
|
WSR36
|
9/4/2004
|
Cloudy
|
Mid-ebb
|
Moderate
|
S
|
1
|
12:14:00 PM
|
9.58
|
8.19
|
34.14
|
24.08
|
2.19
|
6.00
|
<0.1
|
<0.01
|
|
WSR36
|
9/4/2004
|
Cloudy
|
Mid-ebb
|
Moderate
|
S
|
1
|
12:14:00 PM
|
9.52
|
8.21
|
34.11
|
24.11
|
2.21
|
4.00
|
<0.1
|
<0.01
|
|
WSR36
|
9/4/2004
|
Cloudy
|
Mid-ebb
|
Moderate
|
M
|
4
|
12:15:00 PM
|
9.56
|
8.20
|
34.19
|
24.03
|
2.24
|
2.50
|
<0.1
|
<0.01
|
|
WSR36
|
9/4/2004
|
Cloudy
|
Mid-ebb
|
Moderate
|
M
|
4
|
12:15:00 PM
|
9.60
|
8.16
|
34.18
|
24.06
|
2.29
|
2.50
|
<0.1
|
<0.01
|
|
WSR36
|
9/4/2004
|
Cloudy
|
Mid-ebb
|
Moderate
|
B
|
6
|
12:15:00 PM
|
9.58
|
8.21
|
34.11
|
24.13
|
2.23
|
3.00
|
<0.1
|
<0.01
|
|
WSR36
|
9/4/2004
|
Cloudy
|
Mid-ebb
|
Moderate
|
B
|
6
|
12:15:00 PM
|
9.59
|
8.20
|
34.13
|
24.03
|
2.20
|
4.00
|
<0.1
|
<0.01
|
|
WSR37
|
9/4/2004
|
Cloudy
|
Mid-ebb
|
Moderate
|
S
|
1
|
12:07:00 PM
|
8.42
|
8.34
|
32.90
|
23.99
|
2.23
|
5.00
|
<0.1
|
<0.01
|
|
WSR37
|
9/4/2004
|
Cloudy
|
Mid-ebb
|
Moderate
|
S
|
1
|
12:07:00 PM
|
8.55
|
8.30
|
32.83
|
23.93
|
2.28
|
6.00
|
<0.1
|
<0.01
|
|
WSR37
|
9/4/2004
|
Cloudy
|
Mid-ebb
|
Moderate
|
M
|
4
|
12:08:00 PM
|
8.42
|
8.36
|
32.97
|
23.95
|
2.25
|
3.00
|
<0.1
|
<0.01
|
|
WSR37
|
9/4/2004
|
Cloudy
|
Mid-ebb
|
Moderate
|
M
|
4
|
12:08:00 PM
|
8.52
|
8.35
|
32.90
|
23.91
|
2.25
|
4.00
|
<0.1
|
<0.01
|
|
WSR37
|
9/4/2004
|
Cloudy
|
Mid-ebb
|
Moderate
|
B
|
8
|
12:09:00 PM
|
8.52
|
8.31
|
32.85
|
23.90
|
2.23
|
3.00
|
<0.1
|
<0.01
|
|
WSR37
|
9/4/2004
|
Cloudy
|
Mid-ebb
|
Moderate
|
B
|
8
|
12:09:00 PM
|
8.47
|
8.28
|
32.86
|
23.91
|
2.21
|
4.00
|
<0.1
|
<0.01
|
|
NF1
|
9/4/2004
|
Cloudy
|
Mid-ebb
|
Moderate
|
S
|
1
|
11:37:00 AM
|
8.92
|
8.15
|
32.82
|
24.17
|
1.94
|
4.00
|
<0.1
|
<0.01
|
|
NF1
|
9/4/2004
|
Cloudy
|
Mid-ebb
|
Moderate
|
S
|
1
|
11:37:00 AM
|
8.95
|
8.20
|
32.79
|
24.16
|
1.92
|
4.00
|
<0.1
|
<0.01
|
|
NF1
|
9/4/2004
|
Cloudy
|
Mid-ebb
|
Moderate
|
M
|
7
|
11:38:00 AM
|
9.02
|
8.21
|
32.78
|
24.09
|
1.91
|
4.00
|
<0.1
|
<0.01
|
|
NF1
|
9/4/2004
|
Cloudy
|
Mid-ebb
|
Moderate
|
M
|
7
|
11:38:00 AM
|
8.95
|
8.16
|
32.80
|
24.16
|
1.94
|
4.00
|
<0.1
|
<0.01
|
|
NF1
|
9/4/2004
|
Cloudy
|
Mid-ebb
|
Moderate
|
B
|
13
|
11:39:00 AM
|
8.93
|
8.20
|
32.80
|
24.15
|
1.96
|
7.00
|
<0.1
|
<0.01
|
|
NF1
|
9/4/2004
|
Cloudy
|
Mid-ebb
|
Moderate
|
B
|
13
|
11:39:00 AM
|
8.97
|
8.20
|
32.82
|
24.10
|
1.91
|
6.00
|
<0.1
|
<0.01
|
|
Location
|
Date
|
Weather
|
Tide
|
Sea Condition
|
Water Level
|
Depth (m)
|
Time
|
DO (mg/L)
|
pH
|
Sal (ppt)
|
Temp ((�XC)
|
Turbidty (NTU)
|
SS (mg/L)
|
Iron (mg/L)
|
Total Residual Chlorine (mg/L)
|
|
NF2
|
9/4/2004
|
Cloudy
|
Mid-ebb
|
Moderate
|
S
|
1
|
11:51:00 AM
|
8.53
|
8.26
|
33.41
|
24.19
|
1.90
|
3.00
|
<0.1
|
<0.01
|
|
NF2
|
9/4/2004
|
Cloudy
|
Mid-ebb
|
Moderate
|
S
|
1
|
11:51:00 AM
|
8.56
|
8.25
|
33.54
|
24.18
|
1.86
|
2.50
|
<0.1
|
<0.01
|
|
NF2
|
9/4/2004
|
Cloudy
|
Mid-ebb
|
Moderate
|
M
|
5
|
11:52:00 AM
|
8.55
|
8.20
|
33.47
|
24.22
|
1.94
|
4.00
|
<0.1
|
<0.01
|
|
NF2
|
9/4/2004
|
Cloudy
|
Mid-ebb
|
Moderate
|
M
|
5
|
11:52:00 AM
|
8.57
|
8.28
|
33.45
|
24.18
|
1.89
|
2.50
|
<0.1
|
<0.01
|
|
NF2
|
9/4/2004
|
Cloudy
|
Mid-ebb
|
Moderate
|
B
|
9
|
11:53:00 AM
|
8.56
|
8.19
|
33.42
|
24.21
|
1.85
|
3.00
|
<0.1
|
<0.01
|
|
NF2
|
9/4/2004
|
Cloudy
|
Mid-ebb
|
Moderate
|
B
|
9
|
11:53:00 AM
|
8.58
|
8.25
|
33.43
|
24.16
|
1.84
|
3.00
|
<0.1
|
<0.01
|
|
NF3
|
9/4/2004
|
Cloudy
|
Mid-ebb
|
Moderate
|
S
|
1
|
11:59:00 AM
|
8.31
|
8.30
|
33.07
|
24.19
|
2.04
|
2.50
|
<0.1
|
<0.01
|
|
NF3
|
9/4/2004
|
Cloudy
|
Mid-ebb
|
Moderate
|
S
|
1
|
11:59:00 AM
|
8.39
|
8.30
|
33.05
|
24.23
|
2.00
|
4.00
|
<0.1
|
<0.01
|
|
NF3
|
9/4/2004
|
Cloudy
|
Mid-ebb
|
Moderate
|
M
|
6
|
12:00:00 PM
|
8.40
|
8.21
|
33.10
|
24.24
|
2.09
|
4.00
|
<0.1
|
<0.01
|
|
NF3
|
9/4/2004
|
Cloudy
|
Mid-ebb
|
Moderate
|
M
|
6
|
12:00:00 PM
|
8.32
|
8.21
|
33.02
|
24.19
|
2.10
|
3.00
|
<0.1
|
<0.01
|
|
NF3
|
9/4/2004
|
Cloudy
|
Mid-ebb
|
Moderate
|
B
|
11
|
12:01:00 PM
|
8.35
|
8.28
|
33.07
|
24.14
|
2.01
|
3.00
|
<0.1
|
<0.01
|
|
NF3
|
9/4/2004
|
Cloudy
|
Mid-ebb
|
Moderate
|
B
|
11
|
12:01:00 PM
|
8.30
|
8.25
|
32.99
|
24.17
|
2.09
|
2.50
|
<0.1
|
<0.01
|
|
CE
|
11/4/2024
|
Cloudy
|
Mid-flood
|
Moderate
|
S
|
1
|
10:48:00 AM
|
8.09
|
8.23
|
33.18
|
24.36
|
2.49
|
4.00
|
<0.1
|
<0.01
|
|
CE
|
11/4/2024
|
Cloudy
|
Mid-flood
|
Moderate
|
S
|
1
|
10:48:00 AM
|
8.12
|
8.26
|
33.15
|
24.33
|
2.56
|
3.00
|
<0.1
|
<0.01
|
|
CE
|
11/4/2024
|
Cloudy
|
Mid-flood
|
Moderate
|
M
|
11
|
10:49:00 AM
|
8.07
|
8.24
|
33.18
|
24.35
|
2.45
|
3.00
|
<0.1
|
<0.01
|
|
CE
|
11/4/2024
|
Cloudy
|
Mid-flood
|
Moderate
|
M
|
11
|
10:49:00 AM
|
8.11
|
8.27
|
33.19
|
24.33
|
2.49
|
5.00
|
<0.1
|
<0.01
|
|
CE
|
11/4/2024
|
Cloudy
|
Mid-flood
|
Moderate
|
B
|
21
|
10:50:00 AM
|
8.07
|
8.25
|
33.20
|
24.36
|
2.58
|
5.00
|
<0.1
|
<0.01
|
|
CE
|
11/4/2024
|
Cloudy
|
Mid-flood
|
Moderate
|
B
|
21
|
10:50:00 AM
|
8.12
|
8.22
|
33.15
|
24.31
|
2.63
|
7.00
|
<0.1
|
<0.01
|
|
CF
|
11/4/2024
|
Cloudy
|
Mid-flood
|
Moderate
|
S
|
1
|
8:00:00 AM
|
8.63
|
8.14
|
33.82
|
24.55
|
2.33
|
4.00
|
<0.1
|
<0.01
|
|
CF
|
11/4/2024
|
Cloudy
|
Mid-flood
|
Moderate
|
S
|
1
|
8:00:00 AM
|
8.56
|
8.19
|
33.85
|
24.46
|
2.34
|
5.00
|
<0.1
|
<0.01
|
|
CF
|
11/4/2024
|
Cloudy
|
Mid-flood
|
Moderate
|
M
|
10
|
8:01:00 AM
|
8.59
|
8.13
|
33.82
|
24.52
|
2.28
|
7.00
|
<0.1
|
<0.01
|
|
CF
|
11/4/2024
|
Cloudy
|
Mid-flood
|
Moderate
|
M
|
10
|
8:01:00 AM
|
8.57
|
8.20
|
33.84
|
24.59
|
2.25
|
6.00
|
<0.1
|
<0.01
|
|
CF
|
11/4/2024
|
Cloudy
|
Mid-flood
|
Moderate
|
B
|
20
|
8:02:00 AM
|
8.57
|
8.21
|
33.85
|
24.53
|
2.36
|
6.00
|
<0.1
|
<0.01
|
|
CF
|
11/4/2024
|
Cloudy
|
Mid-flood
|
Moderate
|
B
|
20
|
8:02:00 AM
|
8.57
|
8.13
|
33.85
|
24.59
|
2.37
|
4.00
|
<0.1
|
<0.01
|
|
WSR01
|
11/4/2024
|
Cloudy
|
Mid-flood
|
Moderate
|
S
|
1
|
8:20:00 AM
|
8.56
|
8.16
|
32.76
|
24.37
|
1.73
|
2.50
|
<0.1
|
<0.01
|
|
WSR01
|
11/4/2024
|
Cloudy
|
Mid-flood
|
Moderate
|
S
|
1
|
8:20:00 AM
|
8.58
|
8.19
|
32.68
|
24.32
|
1.81
|
2.50
|
<0.1
|
<0.01
|
|
WSR01
|
11/4/2024
|
Cloudy
|
Mid-flood
|
Moderate
|
M
|
4
|
8:21:00 AM
|
8.51
|
8.19
|
32.78
|
24.30
|
1.74
|
2.50
|
<0.1
|
<0.01
|
|
WSR01
|
11/4/2024
|
Cloudy
|
Mid-flood
|
Moderate
|
M
|
4
|
8:21:00 AM
|
8.52
|
8.13
|
32.74
|
24.36
|
1.81
|
3.00
|
<0.1
|
<0.01
|
|
WSR01
|
11/4/2024
|
Cloudy
|
Mid-flood
|
Moderate
|
B
|
7
|
8:22:00 AM
|
8.56
|
8.16
|
32.72
|
24.33
|
1.73
|
2.50
|
<0.1
|
<0.01
|
|
WSR01
|
11/4/2024
|
Cloudy
|
Mid-flood
|
Moderate
|
B
|
7
|
8:22:00 AM
|
8.52
|
8.13
|
32.79
|
24.24
|
1.80
|
2.50
|
<0.1
|
<0.01
|
|
Location
|
Date
|
Weather
|
Tide
|
Sea Condition
|
Water Level
|
Depth (m)
|
Time
|
DO (mg/L)
|
pH
|
Sal (ppt)
|
Temp ((�XC)
|
Turbidty (NTU)
|
SS (mg/L)
|
Iron (mg/L)
|
Total Residual Chlorine (mg/L)
|
|
WSR02
|
11/4/2024
|
Cloudy
|
Mid-flood
|
Moderate
|
S
|
1
|
8:36:00 AM
|
8.03
|
8.33
|
33.72
|
24.29
|
2.14
|
4.00
|
<0.1
|
<0.01
|
|
WSR02
|
11/4/2024
|
Cloudy
|
Mid-flood
|
Moderate
|
S
|
1
|
8:36:00 AM
|
8.06
|
8.34
|
33.83
|
24.38
|
2.18
|
3.00
|
<0.1
|
<0.01
|
|
WSR02
|
11/4/2024
|
Cloudy
|
Mid-flood
|
Moderate
|
M
|
5
|
8:37:00 AM
|
7.97
|
8.32
|
33.82
|
24.29
|
2.23
|
3.00
|
<0.1
|
<0.01
|
|
WSR02
|
11/4/2024
|
Cloudy
|
Mid-flood
|
Moderate
|
M
|
5
|
8:37:00 AM
|
7.98
|
8.33
|
33.81
|
24.28
|
2.23
|
3.00
|
<0.1
|
<0.01
|
|
WSR02
|
11/4/2024
|
Cloudy
|
Mid-flood
|
Moderate
|
B
|
8
|
8:38:00 AM
|
8.04
|
8.31
|
33.82
|
24.29
|
2.21
|
2.50
|
<0.1
|
<0.01
|
|
WSR02
|
11/4/2024
|
Cloudy
|
Mid-flood
|
Moderate
|
B
|
8
|
8:38:00 AM
|
8.04
|
8.28
|
33.75
|
24.31
|
2.17
|
4.00
|
<0.1
|
<0.01
|
|
WSR03
|
11/4/2024
|
Cloudy
|
Mid-flood
|
Moderate
|
S
|
1
|
8:49:00 AM
|
8.10
|
8.20
|
32.23
|
24.47
|
2.15
|
4.00
|
<0.1
|
<0.01
|
|
WSR03
|
11/4/2024
|
Cloudy
|
Mid-flood
|
Moderate
|
S
|
1
|
8:49:00 AM
|
8.18
|
8.21
|
32.27
|
24.51
|
2.10
|
5.00
|
<0.1
|
<0.01
|
|
WSR03
|
11/4/2024
|
Cloudy
|
Mid-flood
|
Moderate
|
M
|
4
|
8:50:00 AM
|
8.13
|
8.18
|
32.19
|
24.40
|
2.09
|
5.00
|
<0.1
|
<0.01
|
|
WSR03
|
11/4/2024
|
Cloudy
|
Mid-flood
|
Moderate
|
M
|
4
|
8:50:00 AM
|
8.09
|
8.13
|
32.28
|
24.45
|
2.15
|
3.00
|
<0.1
|
<0.01
|
|
WSR03
|
11/4/2024
|
Cloudy
|
Mid-flood
|
Moderate
|
B
|
7
|
8:51:00 AM
|
8.16
|
8.20
|
32.22
|
24.50
|
2.14
|
4.00
|
<0.1
|
<0.01
|
|
WSR03
|
11/4/2024
|
Cloudy
|
Mid-flood
|
Moderate
|
B
|
7
|
8:51:00 AM
|
8.12
|
8.20
|
32.28
|
24.42
|
2.11
|
4.00
|
<0.1
|
<0.01
|
|
WSR04
|
11/4/2024
|
Cloudy
|
Mid-flood
|
Moderate
|
S
|
1
|
9:02:00 AM
|
8.88
|
8.17
|
33.31
|
24.30
|
2.18
|
6.00
|
<0.1
|
<0.01
|
|
WSR04
|
11/4/2024
|
Cloudy
|
Mid-flood
|
Moderate
|
S
|
1
|
9:02:00 AM
|
8.80
|
8.18
|
33.27
|
24.20
|
2.13
|
4.00
|
<0.1
|
<0.01
|
|
WSR04
|
11/4/2024
|
Cloudy
|
Mid-flood
|
Moderate
|
M
|
4
|
9:03:00 AM
|
8.88
|
8.16
|
33.28
|
24.30
|
2.15
|
4.00
|
<0.1
|
<0.01
|
|
WSR04
|
11/4/2024
|
Cloudy
|
Mid-flood
|
Moderate
|
M
|
4
|
9:03:00 AM
|
8.86
|
8.15
|
33.31
|
24.21
|
2.15
|
4.00
|
<0.1
|
<0.01
|
|
WSR04
|
11/4/2024
|
Cloudy
|
Mid-flood
|
Moderate
|
B
|
6
|
9:04:00 AM
|
8.84
|
8.18
|
33.24
|
24.26
|
2.21
|
4.00
|
<0.1
|
<0.01
|
|
WSR04
|
11/4/2024
|
Cloudy
|
Mid-flood
|
Moderate
|
B
|
6
|
9:04:00 AM
|
8.81
|
8.14
|
33.27
|
24.19
|
2.17
|
3.00
|
<0.1
|
<0.01
|
|
WSR16
|
11/4/2024
|
Cloudy
|
Mid-flood
|
Moderate
|
S
|
1
|
10:27:00 AM
|
8.59
|
8.18
|
32.25
|
24.14
|
2.02
|
6.00
|
<0.1
|
<0.01
|
|
WSR16
|
11/4/2024
|
Cloudy
|
Mid-flood
|
Moderate
|
S
|
1
|
10:27:00 AM
|
8.59
|
8.21
|
32.32
|
24.24
|
1.97
|
4.00
|
<0.1
|
<0.01
|
|
WSR16
|
11/4/2024
|
Cloudy
|
Mid-flood
|
Moderate
|
M
|
8
|
10:28:00 AM
|
8.61
|
8.19
|
32.30
|
24.22
|
2.01
|
9.00
|
<0.1
|
<0.01
|
|
WSR16
|
11/4/2024
|
Cloudy
|
Mid-flood
|
Moderate
|
M
|
8
|
10:28:00 AM
|
8.61
|
8.15
|
32.36
|
24.24
|
2.00
|
10.00
|
<0.1
|
<0.01
|
|
WSR16
|
11/4/2024
|
Cloudy
|
Mid-flood
|
Moderate
|
B
|
14
|
10:29:00 AM
|
8.56
|
8.22
|
32.27
|
24.17
|
2.05
|
2.50
|
<0.1
|
<0.01
|
|
WSR16
|
11/4/2024
|
Cloudy
|
Mid-flood
|
Moderate
|
B
|
14
|
10:29:00 AM
|
8.58
|
8.22
|
32.35
|
24.24
|
1.97
|
3.00
|
<0.1
|
<0.01
|
|
WSR33
|
11/4/2024
|
Cloudy
|
Mid-flood
|
Moderate
|
S
|
1
|
9:17:00 AM
|
8.87
|
8.25
|
32.60
|
24.28
|
1.59
|
17.00
|
<0.1
|
<0.01
|
|
WSR33
|
11/4/2024
|
Cloudy
|
Mid-flood
|
Moderate
|
S
|
1
|
9:17:00 AM
|
8.86
|
8.26
|
32.59
|
24.28
|
1.54
|
15.00
|
<0.1
|
<0.01
|
|
WSR33
|
11/4/2024
|
Cloudy
|
Mid-flood
|
Moderate
|
M
|
4
|
9:18:00 AM
|
8.79
|
8.29
|
32.59
|
24.32
|
1.63
|
4.00
|
<0.1
|
<0.01
|
|
WSR33
|
11/4/2024
|
Cloudy
|
Mid-flood
|
Moderate
|
M
|
4
|
9:18:00 AM
|
8.84
|
8.27
|
32.59
|
24.36
|
1.54
|
3.00
|
<0.1
|
<0.01
|
|
WSR33
|
11/4/2024
|
Cloudy
|
Mid-flood
|
Moderate
|
B
|
7
|
9:19:00 AM
|
8.81
|
8.32
|
32.60
|
24.34
|
1.60
|
2.50
|
<0.1
|
<0.01
|
|
WSR33
|
11/4/2024
|
Cloudy
|
Mid-flood
|
Moderate
|
B
|
7
|
9:19:00 AM
|
8.84
|
8.27
|
32.59
|
24.31
|
1.60
|
3.00
|
<0.1
|
<0.01
|
|
Location
|
Date
|
Weather
|
Tide
|
Sea Condition
|
Water Level
|
Depth (m)
|
Time
|
DO (mg/L)
|
pH
|
Sal (ppt)
|
Temp ((�XC)
|
Turbidty (NTU)
|
SS (mg/L)
|
Iron (mg/L)
|
Total Residual Chlorine (mg/L)
|
|
WSR36
|
11/4/2024
|
Cloudy
|
Mid-flood
|
Moderate
|
S
|
1
|
9:32:00 AM
|
8.29
|
8.28
|
32.61
|
24.14
|
2.27
|
4.00
|
<0.1
|
<0.01
|
|
WSR36
|
11/4/2024
|
Cloudy
|
Mid-flood
|
Moderate
|
S
|
1
|
9:32:00 AM
|
8.25
|
8.21
|
32.58
|
24.19
|
2.28
|
2.50
|
<0.1
|
<0.01
|
|
WSR36
|
11/4/2024
|
Cloudy
|
Mid-flood
|
Moderate
|
M
|
3
|
9:33:00 AM
|
8.27
|
8.24
|
32.55
|
24.23
|
2.20
|
2.50
|
<0.1
|
<0.01
|
|
WSR36
|
11/4/2024
|
Cloudy
|
Mid-flood
|
Moderate
|
M
|
3
|
9:33:00 AM
|
8.21
|
8.19
|
32.62
|
24.21
|
2.29
|
3.00
|
<0.1
|
<0.01
|
|
WSR36
|
11/4/2024
|
Cloudy
|
Mid-flood
|
Moderate
|
B
|
6
|
9:33:00 AM
|
8.19
|
8.26
|
32.57
|
24.20
|
2.20
|
4.00
|
<0.1
|
<0.01
|
|
WSR36
|
11/4/2024
|
Cloudy
|
Mid-flood
|
Moderate
|
B
|
6
|
9:33:00 AM
|
8.13
|
8.24
|
32.60
|
24.23
|
2.23
|
4.00
|
<0.1
|
<0.01
|
|
WSR37
|
11/4/2024
|
Cloudy
|
Mid-flood
|
Moderate
|
S
|
1
|
9:48:00 AM
|
7.92
|
8.23
|
32.95
|
24.30
|
1.59
|
11.00
|
<0.1
|
<0.01
|
|
WSR37
|
11/4/2024
|
Cloudy
|
Mid-flood
|
Moderate
|
S
|
1
|
9:48:00 AM
|
7.92
|
8.19
|
32.97
|
24.34
|
1.64
|
10.00
|
<0.1
|
<0.01
|
|
WSR37
|
11/4/2024
|
Cloudy
|
Mid-flood
|
Moderate
|
M
|
4
|
9:49:00 AM
|
8.20
|
8.14
|
33.01
|
24.36
|
1.67
|
4.00
|
<0.1
|
<0.01
|
|
WSR37
|
11/4/2024
|
Cloudy
|
Mid-flood
|
Moderate
|
M
|
4
|
9:49:00 AM
|
7.94
|
8.14
|
33.00
|
24.35
|
1.67
|
4.00
|
<0.1
|
<0.01
|
|
WSR37
|
11/4/2024
|
Cloudy
|
Mid-flood
|
Moderate
|
B
|
7
|
9:50:00 AM
|
7.95
|
8.21
|
33.05
|
24.41
|
1.67
|
4.00
|
<0.1
|
<0.01
|
|
WSR37
|
11/4/2024
|
Cloudy
|
Mid-flood
|
Moderate
|
B
|
7
|
9:50:00 AM
|
7.96
|
8.21
|
33.03
|
24.34
|
1.63
|
2.50
|
<0.1
|
<0.01
|
|
NF1
|
11/4/2024
|
Cloudy
|
Mid-flood
|
Moderate
|
S
|
1
|
10:12:00 AM
|
8.60
|
8.19
|
32.46
|
24.46
|
1.68
|
2.50
|
<0.1
|
<0.01
|
|
NF1
|
11/4/2024
|
Cloudy
|
Mid-flood
|
Moderate
|
S
|
1
|
10:12:00 AM
|
8.54
|
8.19
|
32.51
|
24.49
|
1.60
|
2.50
|
<0.1
|
<0.01
|
|
NF1
|
11/4/2024
|
Cloudy
|
Mid-flood
|
Moderate
|
M
|
7
|
10:13:00 AM
|
8.59
|
8.15
|
32.52
|
24.46
|
1.63
|
5.00
|
<0.1
|
<0.01
|
|
NF1
|
11/4/2024
|
Cloudy
|
Mid-flood
|
Moderate
|
M
|
7
|
10:13:00 AM
|
8.52
|
8.16
|
32.45
|
24.47
|
1.55
|
8.00
|
<0.1
|
<0.01
|
|
NF1
|
11/4/2024
|
Cloudy
|
Mid-flood
|
Moderate
|
B
|
12
|
10:14:00 AM
|
8.54
|
8.16
|
32.45
|
24.55
|
1.62
|
3.00
|
<0.1
|
<0.01
|
|
NF1
|
11/4/2024
|
Cloudy
|
Mid-flood
|
Moderate
|
B
|
12
|
10:14:00 AM
|
8.56
|
8.17
|
32.49
|
24.44
|
1.58
|
2.50
|
<0.1
|
<0.01
|
|
NF2
|
11/4/2024
|
Cloudy
|
Mid-flood
|
Moderate
|
S
|
1
|
10:03:00 AM
|
8.27
|
8.21
|
32.69
|
24.44
|
1.56
|
2.50
|
<0.1
|
<0.01
|
|
NF2
|
11/4/2024
|
Cloudy
|
Mid-flood
|
Moderate
|
S
|
1
|
10:03:00 AM
|
8.29
|
8.18
|
32.71
|
24.39
|
1.55
|
4.00
|
<0.1
|
<0.01
|
|
NF2
|
11/4/2024
|
Cloudy
|
Mid-flood
|
Moderate
|
M
|
5
|
10:04:00 AM
|
8.26
|
8.18
|
32.63
|
24.38
|
1.60
|
4.00
|
<0.1
|
<0.01
|
|
NF2
|
11/4/2024
|
Cloudy
|
Mid-flood
|
Moderate
|
M
|
5
|
10:04:00 AM
|
8.26
|
8.20
|
32.61
|
24.45
|
1.61
|
2.50
|
<0.1
|
<0.01
|
|
NF2
|
11/4/2024
|
Cloudy
|
Mid-flood
|
Moderate
|
B
|
9
|
10:05:00 AM
|
8.27
|
8.19
|
32.68
|
24.34
|
1.57
|
13.00
|
<0.1
|
<0.01
|
|
NF2
|
11/4/2024
|
Cloudy
|
Mid-flood
|
Moderate
|
B
|
9
|
10:05:00 AM
|
8.29
|
8.15
|
32.71
|
24.35
|
1.63
|
13.00
|
<0.1
|
<0.01
|
|
NF3
|
11/4/2024
|
Cloudy
|
Mid-flood
|
Moderate
|
S
|
1
|
9:55:00 AM
|
8.20
|
8.25
|
33.61
|
24.17
|
2.24
|
4.00
|
<0.1
|
<0.01
|
|
NF3
|
11/4/2024
|
Cloudy
|
Mid-flood
|
Moderate
|
S
|
1
|
9:55:00 AM
|
8.29
|
8.23
|
33.54
|
24.14
|
2.31
|
2.50
|
<0.1
|
<0.01
|
|
NF3
|
11/4/2024
|
Cloudy
|
Mid-flood
|
Moderate
|
M
|
6
|
9:56:00 AM
|
8.28
|
8.16
|
33.60
|
24.13
|
2.23
|
11.00
|
<0.1
|
<0.01
|
|
NF3
|
11/4/2024
|
Cloudy
|
Mid-flood
|
Moderate
|
M
|
6
|
9:56:00 AM
|
8.22
|
8.20
|
33.54
|
24.19
|
2.22
|
15.00
|
<0.1
|
<0.01
|
|
NF3
|
11/4/2024
|
Cloudy
|
Mid-flood
|
Moderate
|
B
|
11
|
9:57:00 AM
|
8.21
|
8.23
|
33.61
|
24.23
|
2.30
|
3.00
|
<0.1
|
<0.01
|
|
NF3
|
11/4/2024
|
Cloudy
|
Mid-flood
|
Moderate
|
B
|
11
|
9:57:00 AM
|
8.24
|
8.24
|
33.61
|
24.12
|
2.25
|
4.00
|
<0.1
|
<0.01
|
|
Location
|
Date
|
Weather
|
Tide
|
Sea Condition
|
Water Level
|
Depth (m)
|
Time
|
DO (mg/L)
|
pH
|
Sal (ppt)
|
Temp ((�XC)
|
Turbidty (NTU)
|
SS (mg/L)
|
Iron (mg/L)
|
Total Residual Chlorine (mg/L)
|
|
CE
|
13/4/2024
|
Cloudy
|
Mid-flood
|
Moderate
|
S
|
1
|
10:53:00 AM
|
8.22
|
8.21
|
33.21
|
24.49
|
2.04
|
6.00
|
<0.1
|
<0.01
|
|
CE
|
13/4/2024
|
Cloudy
|
Mid-flood
|
Moderate
|
S
|
1
|
10:53:00 AM
|
8.24
|
8.22
|
33.23
|
24.48
|
2.01
|
3.00
|
<0.1
|
<0.01
|
|
CE
|
13/4/2024
|
Cloudy
|
Mid-flood
|
Moderate
|
M
|
12
|
10:54:00 AM
|
8.22
|
8.25
|
33.23
|
24.50
|
2.06
|
5.00
|
<0.1
|
<0.01
|
|
CE
|
13/4/2024
|
Cloudy
|
Mid-flood
|
Moderate
|
M
|
12
|
10:54:00 AM
|
8.23
|
8.24
|
33.28
|
24.46
|
2.04
|
3.00
|
<0.1
|
<0.01
|
|
CE
|
13/4/2024
|
Cloudy
|
Mid-flood
|
Moderate
|
B
|
23
|
10:55:00 AM
|
8.13
|
8.23
|
33.26
|
24.48
|
2.03
|
2.50
|
<0.1
|
<0.01
|
|
CE
|
13/4/2024
|
Cloudy
|
Mid-flood
|
Moderate
|
B
|
23
|
10:55:00 AM
|
8.17
|
8.23
|
33.27
|
24.59
|
2.04
|
3.00
|
<0.1
|
<0.01
|
|
CF
|
13/4/2024
|
Cloudy
|
Mid-flood
|
Moderate
|
S
|
1
|
8:00:00 AM
|
8.01
|
8.20
|
33.80
|
24.45
|
2.21
|
3.00
|
<0.1
|
<0.01
|
|
CF
|
13/4/2024
|
Cloudy
|
Mid-flood
|
Moderate
|
S
|
1
|
8:00:00 AM
|
8.10
|
8.20
|
33.80
|
24.49
|
2.24
|
5.00
|
<0.1
|
<0.01
|
|
CF
|
13/4/2024
|
Cloudy
|
Mid-flood
|
Moderate
|
M
|
11
|
8:01:00 AM
|
8.00
|
8.18
|
33.80
|
24.55
|
2.20
|
4.00
|
<0.1
|
<0.01
|
|
CF
|
13/4/2024
|
Cloudy
|
Mid-flood
|
Moderate
|
M
|
11
|
8:01:00 AM
|
8.07
|
8.18
|
33.79
|
24.52
|
2.22
|
2.50
|
<0.1
|
<0.01
|
|
CF
|
13/4/2024
|
Cloudy
|
Mid-flood
|
Moderate
|
B
|
20
|
8:02:00 AM
|
8.08
|
8.23
|
33.72
|
24.55
|
2.25
|
5.00
|
<0.1
|
<0.01
|
|
CF
|
13/4/2024
|
Cloudy
|
Mid-flood
|
Moderate
|
B
|
20
|
8:02:00 AM
|
8.08
|
8.19
|
33.75
|
24.50
|
2.22
|
3.00
|
<0.1
|
<0.01
|
|
WSR01
|
13/4/2024
|
Cloudy
|
Mid-flood
|
Moderate
|
S
|
1
|
8:22:00 AM
|
8.06
|
8.18
|
33.83
|
24.38
|
2.37
|
3.00
|
<0.1
|
<0.01
|
|
WSR01
|
13/4/2024
|
Cloudy
|
Mid-flood
|
Moderate
|
S
|
1
|
8:22:00 AM
|
8.08
|
8.14
|
33.77
|
24.43
|
2.35
|
4.00
|
<0.1
|
<0.01
|
|
WSR01
|
13/4/2024
|
Cloudy
|
Mid-flood
|
Moderate
|
M
|
5
|
8:23:00 AM
|
8.06
|
8.13
|
33.80
|
24.40
|
2.35
|
7.00
|
<0.1
|
<0.01
|
|
WSR01
|
13/4/2024
|
Cloudy
|
Mid-flood
|
Moderate
|
M
|
5
|
8:23:00 AM
|
8.07
|
8.15
|
33.79
|
24.38
|
2.37
|
5.00
|
<0.1
|
<0.01
|
|
WSR01
|
13/4/2024
|
Cloudy
|
Mid-flood
|
Moderate
|
B
|
8
|
8:24:00 AM
|
8.14
|
8.13
|
33.83
|
24.41
|
2.37
|
4.00
|
<0.1
|
<0.01
|
|
WSR01
|
13/4/2024
|
Cloudy
|
Mid-flood
|
Moderate
|
B
|
8
|
8:24:00 AM
|
8.13
|
8.15
|
33.76
|
24.51
|
2.39
|
4.00
|
<0.1
|
<0.01
|
|
WSR02
|
13/4/2024
|
Cloudy
|
Mid-flood
|
Moderate
|
S
|
1
|
8:41:00 AM
|
7.70
|
8.28
|
33.60
|
24.57
|
1.65
|
6.00
|
<0.1
|
<0.01
|
|
WSR02
|
13/4/2024
|
Cloudy
|
Mid-flood
|
Moderate
|
S
|
1
|
8:41:00 AM
|
7.69
|
8.22
|
33.62
|
24.49
|
1.67
|
4.00
|
<0.1
|
<0.01
|
|
WSR02
|
13/4/2024
|
Cloudy
|
Mid-flood
|
Moderate
|
M
|
5
|
8:42:00 AM
|
7.72
|
8.24
|
33.69
|
24.53
|
1.66
|
3.00
|
<0.1
|
<0.01
|
|
WSR02
|
13/4/2024
|
Cloudy
|
Mid-flood
|
Moderate
|
M
|
5
|
8:42:00 AM
|
7.67
|
8.25
|
33.65
|
24.49
|
1.66
|
2.50
|
<0.1
|
<0.01
|
|
WSR02
|
13/4/2024
|
Cloudy
|
Mid-flood
|
Moderate
|
B
|
9
|
8:43:00 AM
|
7.71
|
8.27
|
33.68
|
24.54
|
1.67
|
6.00
|
<0.1
|
<0.01
|
|
WSR02
|
13/4/2024
|
Cloudy
|
Mid-flood
|
Moderate
|
B
|
9
|
8:43:00 AM
|
7.66
|
8.26
|
33.65
|
24.61
|
1.65
|
6.00
|
<0.1
|
<0.01
|
|
WSR03
|
13/4/2024
|
Cloudy
|
Mid-flood
|
Moderate
|
S
|
1
|
8:53:00 AM
|
8.16
|
8.31
|
33.13
|
24.28
|
1.91
|
5.00
|
<0.1
|
<0.01
|
|
WSR03
|
13/4/2024
|
Cloudy
|
Mid-flood
|
Moderate
|
S
|
1
|
8:53:00 AM
|
8.19
|
8.30
|
33.06
|
24.26
|
1.91
|
4.00
|
<0.1
|
<0.01
|
|
WSR03
|
13/4/2024
|
Cloudy
|
Mid-flood
|
Moderate
|
M
|
4
|
8:54:00 AM
|
8.19
|
8.33
|
33.13
|
24.29
|
1.95
|
6.00
|
<0.1
|
<0.01
|
|
WSR03
|
13/4/2024
|
Cloudy
|
Mid-flood
|
Moderate
|
M
|
4
|
8:54:00 AM
|
8.14
|
8.28
|
33.12
|
24.30
|
1.94
|
3.00
|
<0.1
|
<0.01
|
|
WSR03
|
13/4/2024
|
Cloudy
|
Mid-flood
|
Moderate
|
B
|
7
|
8:55:00 AM
|
8.13
|
8.32
|
33.11
|
24.23
|
1.93
|
3.00
|
<0.1
|
<0.01
|
|
WSR03
|
13/4/2024
|
Cloudy
|
Mid-flood
|
Moderate
|
B
|
7
|
8:55:00 AM
|
8.09
|
8.29
|
33.05
|
24.29
|
1.94
|
5.00
|
<0.1
|
<0.01
|
|
Location
|
Date
|
Weather
|
Tide
|
Sea Condition
|
Water Level
|
Depth (m)
|
Time
|
DO (mg/L)
|
pH
|
Sal (ppt)
|
Temp ((�XC)
|
Turbidty (NTU)
|
SS (mg/L)
|
Iron (mg/L)
|
Total Residual Chlorine (mg/L)
|
|
WSR04
|
13/4/2024
|
Cloudy
|
Mid-flood
|
Moderate
|
S
|
1
|
9:07:00 AM
|
9.10
|
8.34
|
33.19
|
24.34
|
1.91
|
4.00
|
<0.1
|
<0.01
|
|
WSR04
|
13/4/2024
|
Cloudy
|
Mid-flood
|
Moderate
|
S
|
1
|
9:07:00 AM
|
9.11
|
8.34
|
33.18
|
24.39
|
1.88
|
7.00
|
<0.1
|
<0.01
|
|
WSR04
|
13/4/2024
|
Cloudy
|
Mid-flood
|
Moderate
|
M
|
4
|
9:08:00 AM
|
9.14
|
8.30
|
33.19
|
24.37
|
1.90
|
4.00
|
<0.1
|
<0.01
|
|
WSR04
|
13/4/2024
|
Cloudy
|
Mid-flood
|
Moderate
|
M
|
4
|
9:08:00 AM
|
9.04
|
8.30
|
33.12
|
24.43
|
1.91
|
5.00
|
<0.1
|
<0.01
|
|
WSR04
|
13/4/2024
|
Cloudy
|
Mid-flood
|
Moderate
|
B
|
6
|
9:09:00 AM
|
9.13
|
8.33
|
33.13
|
24.39
|
1.86
|
6.00
|
<0.1
|
<0.01
|
|
WSR04
|
13/4/2024
|
Cloudy
|
Mid-flood
|
Moderate
|
B
|
6
|
9:09:00 AM
|
9.06
|
8.28
|
33.10
|
24.42
|
1.90
|
4.00
|
<0.1
|
<0.01
|
|
WSR16
|
13/4/2024
|
Cloudy
|
Mid-flood
|
Moderate
|
S
|
1
|
10:32:00 AM
|
9.08
|
8.16
|
33.11
|
24.67
|
2.16
|
5.00
|
<0.1
|
<0.01
|
|
WSR16
|
13/4/2024
|
Cloudy
|
Mid-flood
|
Moderate
|
S
|
1
|
10:32:00 AM
|
9.17
|
8.16
|
33.16
|
24.53
|
2.19
|
6.00
|
<0.1
|
<0.01
|
|
WSR16
|
13/4/2024
|
Cloudy
|
Mid-flood
|
Moderate
|
M
|
8
|
10:33:00 AM
|
9.13
|
8.17
|
33.10
|
24.55
|
2.18
|
6.00
|
<0.1
|
<0.01
|
|
WSR16
|
13/4/2024
|
Cloudy
|
Mid-flood
|
Moderate
|
M
|
8
|
10:33:00 AM
|
9.13
|
8.15
|
33.14
|
24.55
|
2.20
|
3.00
|
<0.1
|
<0.01
|
|
WSR16
|
13/4/2024
|
Cloudy
|
Mid-flood
|
Moderate
|
B
|
16
|
10:34:00 AM
|
9.11
|
8.17
|
33.16
|
24.61
|
2.19
|
3.00
|
<0.1
|
<0.01
|
|
WSR16
|
13/4/2024
|
Cloudy
|
Mid-flood
|
Moderate
|
B
|
16
|
10:34:00 AM
|
9.06
|
8.19
|
33.17
|
24.62
|
2.21
|
4.00
|
<0.1
|
<0.01
|
|
WSR33
|
13/4/2024
|
Cloudy
|
Mid-flood
|
Moderate
|
S
|
1
|
9:22:00 AM
|
8.64
|
8.28
|
32.47
|
24.31
|
1.49
|
4.00
|
<0.1
|
<0.01
|
|
WSR33
|
13/4/2024
|
Cloudy
|
Mid-flood
|
Moderate
|
S
|
1
|
9:22:00 AM
|
8.68
|
8.28
|
32.46
|
24.39
|
1.50
|
4.00
|
<0.1
|
<0.01
|
|
WSR33
|
13/4/2024
|
Cloudy
|
Mid-flood
|
Moderate
|
M
|
4
|
9:23:00 AM
|
8.69
|
8.25
|
32.47
|
24.41
|
1.54
|
3.00
|
<0.1
|
<0.01
|
|
WSR33
|
13/4/2024
|
Cloudy
|
Mid-flood
|
Moderate
|
M
|
4
|
9:23:00 AM
|
8.60
|
8.28
|
32.41
|
24.28
|
1.50
|
4.00
|
<0.1
|
<0.01
|
|
WSR33
|
13/4/2024
|
Cloudy
|
Mid-flood
|
Moderate
|
B
|
6
|
9:24:00 AM
|
8.69
|
8.22
|
32.48
|
24.34
|
1.54
|
5.00
|
<0.1
|
<0.01
|
|
WSR33
|
13/4/2024
|
Cloudy
|
Mid-flood
|
Moderate
|
B
|
6
|
9:24:00 AM
|
8.68
|
8.27
|
32.40
|
24.40
|
1.48
|
5.00
|
<0.1
|
<0.01
|
|
WSR36
|
13/4/2024
|
Cloudy
|
Mid-flood
|
Moderate
|
S
|
1
|
9:36:00 AM
|
7.77
|
8.16
|
32.63
|
24.37
|
2.29
|
3.00
|
<0.1
|
<0.01
|
|
WSR36
|
13/4/2024
|
Cloudy
|
Mid-flood
|
Moderate
|
S
|
1
|
9:36:00 AM
|
7.78
|
8.17
|
32.61
|
24.47
|
2.24
|
4.00
|
<0.1
|
<0.01
|
|
WSR36
|
13/4/2024
|
Cloudy
|
Mid-flood
|
Moderate
|
M
|
3
|
9:37:00 AM
|
7.85
|
8.17
|
32.63
|
24.47
|
2.26
|
5.00
|
<0.1
|
<0.01
|
|
WSR36
|
13/4/2024
|
Cloudy
|
Mid-flood
|
Moderate
|
M
|
3
|
9:37:00 AM
|
7.84
|
8.18
|
32.55
|
24.42
|
2.24
|
6.00
|
<0.1
|
<0.01
|
|
WSR36
|
13/4/2024
|
Cloudy
|
Mid-flood
|
Moderate
|
B
|
6
|
9:37:00 AM
|
7.78
|
8.18
|
32.59
|
24.46
|
2.27
|
4.00
|
<0.1
|
<0.01
|
|
WSR36
|
13/4/2024
|
Cloudy
|
Mid-flood
|
Moderate
|
B
|
6
|
9:37:00 AM
|
7.87
|
8.18
|
32.57
|
24.48
|
2.25
|
4.00
|
<0.1
|
<0.01
|
|
WSR37
|
13/4/2024
|
Cloudy
|
Mid-flood
|
Moderate
|
S
|
1
|
9:50:00 AM
|
7.92
|
8.30
|
32.90
|
24.58
|
1.91
|
3.00
|
<0.1
|
<0.01
|
|
WSR37
|
13/4/2024
|
Cloudy
|
Mid-flood
|
Moderate
|
S
|
1
|
9:50:00 AM
|
7.85
|
8.27
|
32.93
|
24.54
|
1.92
|
2.50
|
<0.1
|
<0.01
|
|
WSR37
|
13/4/2024
|
Cloudy
|
Mid-flood
|
Moderate
|
M
|
4
|
9:51:00 AM
|
7.93
|
8.31
|
32.92
|
24.49
|
1.96
|
6.00
|
<0.1
|
<0.01
|
|
WSR37
|
13/4/2024
|
Cloudy
|
Mid-flood
|
Moderate
|
M
|
4
|
9:51:00 AM
|
7.86
|
8.27
|
32.88
|
24.51
|
1.96
|
6.00
|
<0.1
|
<0.01
|
|
WSR37
|
13/4/2024
|
Cloudy
|
Mid-flood
|
Moderate
|
B
|
7
|
9:52:00 AM
|
7.93
|
8.30
|
32.89
|
24.58
|
1.91
|
5.00
|
<0.1
|
<0.01
|
|
WSR37
|
13/4/2024
|
Cloudy
|
Mid-flood
|
Moderate
|
B
|
7
|
9:52:00 AM
|
7.90
|
8.30
|
32.95
|
24.46
|
1.97
|
4.00
|
<0.1
|
<0.01
|
|
Location
|
Date
|
Weather
|
Tide
|
Sea Condition
|
Water Level
|
Depth (m)
|
Time
|
DO (mg/L)
|
pH
|
Sal (ppt)
|
Temp ((�XC)
|
Turbidty (NTU)
|
SS (mg/L)
|
Iron (mg/L)
|
Total Residual Chlorine (mg/L)
|
|
NF1
|
13/4/2024
|
Cloudy
|
Mid-flood
|
Moderate
|
S
|
1
|
10:18:00 AM
|
7.96
|
8.35
|
33.57
|
24.28
|
2.37
|
4.00
|
<0.1
|
<0.01
|
|
NF1
|
13/4/2024
|
Cloudy
|
Mid-flood
|
Moderate
|
S
|
1
|
10:18:00 AM
|
7.97
|
8.35
|
33.62
|
24.24
|
2.42
|
6.00
|
<0.1
|
<0.01
|
|
NF1
|
13/4/2024
|
Cloudy
|
Mid-flood
|
Moderate
|
M
|
7
|
10:19:00 AM
|
7.97
|
8.30
|
33.56
|
24.25
|
2.39
|
4.00
|
<0.1
|
<0.01
|
|
NF1
|
13/4/2024
|
Cloudy
|
Mid-flood
|
Moderate
|
M
|
7
|
10:19:00 AM
|
7.92
|
8.32
|
33.59
|
24.26
|
2.40
|
3.00
|
<0.1
|
<0.01
|
|
NF1
|
13/4/2024
|
Cloudy
|
Mid-flood
|
Moderate
|
B
|
12
|
10:20:00 AM
|
7.90
|
8.32
|
33.59
|
24.30
|
2.37
|
4.00
|
<0.1
|
<0.01
|
|
NF1
|
13/4/2024
|
Cloudy
|
Mid-flood
|
Moderate
|
B
|
12
|
10:20:00 AM
|
7.95
|
8.32
|
33.56
|
24.22
|
2.42
|
7.00
|
<0.1
|
<0.01
|
|
NF2
|
13/4/2024
|
Cloudy
|
Mid-flood
|
Moderate
|
S
|
1
|
10:09:00 AM
|
8.21
|
8.30
|
33.41
|
24.39
|
1.79
|
5.00
|
<0.1
|
<0.01
|
|
NF2
|
13/4/2024
|
Cloudy
|
Mid-flood
|
Moderate
|
S
|
1
|
10:09:00 AM
|
8.22
|
8.28
|
33.46
|
24.40
|
1.79
|
6.00
|
<0.1
|
<0.01
|
|
NF2
|
13/4/2024
|
Cloudy
|
Mid-flood
|
Moderate
|
M
|
5
|
10:10:00 AM
|
8.30
|
8.25
|
33.41
|
24.35
|
1.83
|
2.50
|
<0.1
|
<0.01
|
|
NF2
|
13/4/2024
|
Cloudy
|
Mid-flood
|
Moderate
|
M
|
5
|
10:10:00 AM
|
8.22
|
8.25
|
33.40
|
24.43
|
1.77
|
3.00
|
<0.1
|
<0.01
|
|
NF2
|
13/4/2024
|
Cloudy
|
Mid-flood
|
Moderate
|
B
|
10
|
10:11:00 AM
|
8.28
|
8.25
|
33.42
|
24.42
|
1.79
|
2.50
|
<0.1
|
<0.01
|
|
NF2
|
13/4/2024
|
Cloudy
|
Mid-flood
|
Moderate
|
B
|
10
|
10:11:00 AM
|
8.21
|
8.27
|
33.40
|
24.49
|
1.81
|
2.50
|
<0.1
|
<0.01
|
|
NF3
|
13/4/2024
|
Cloudy
|
Mid-flood
|
Moderate
|
S
|
1
|
10:00:00 AM
|
8.52
|
8.37
|
33.76
|
24.71
|
1.77
|
5.00
|
<0.1
|
<0.01
|
|
NF3
|
13/4/2024
|
Cloudy
|
Mid-flood
|
Moderate
|
S
|
1
|
10:00:00 AM
|
8.47
|
8.35
|
33.79
|
24.69
|
1.79
|
3.00
|
<0.1
|
<0.01
|
|
NF3
|
13/4/2024
|
Cloudy
|
Mid-flood
|
Moderate
|
M
|
6
|
10:01:00 AM
|
8.53
|
8.36
|
33.74
|
24.61
|
1.78
|
2.50
|
<0.1
|
<0.01
|
|
NF3
|
13/4/2024
|
Cloudy
|
Mid-flood
|
Moderate
|
M
|
6
|
10:01:00 AM
|
8.51
|
8.35
|
33.79
|
24.67
|
1.79
|
4.00
|
<0.1
|
<0.01
|
|
NF3
|
13/4/2024
|
Cloudy
|
Mid-flood
|
Moderate
|
B
|
11
|
10:02:00 AM
|
8.47
|
8.36
|
33.74
|
24.67
|
1.79
|
7.00
|
<0.1
|
<0.01
|
|
NF3
|
13/4/2024
|
Cloudy
|
Mid-flood
|
Moderate
|
B
|
11
|
10:02:00 AM
|
8.45
|
8.38
|
33.79
|
24.59
|
1.80
|
5.00
|
<0.1
|
<0.01
|
|
CE
|
16/4/2024
|
Cloudy
|
Mid-flood
|
Moderate
|
S
|
1
|
1:30:00 PM
|
8.06
|
8.38
|
34.12
|
24.40
|
2.22
|
3.00
|
<0.1
|
<0.01
|
|
CE
|
16/4/2024
|
Cloudy
|
Mid-flood
|
Moderate
|
S
|
1
|
1:30:00 PM
|
8.02
|
8.39
|
34.15
|
24.44
|
2.27
|
4.00
|
<0.1
|
<0.01
|
|
CE
|
16/4/2024
|
Cloudy
|
Mid-flood
|
Moderate
|
M
|
11
|
1:31:00 PM
|
7.97
|
8.34
|
34.11
|
24.43
|
2.30
|
4.00
|
<0.1
|
<0.01
|
|
CE
|
16/4/2024
|
Cloudy
|
Mid-flood
|
Moderate
|
M
|
11
|
1:31:00 PM
|
7.99
|
8.33
|
34.16
|
24.45
|
2.27
|
3.00
|
<0.1
|
<0.01
|
|
CE
|
16/4/2024
|
Cloudy
|
Mid-flood
|
Moderate
|
B
|
21
|
1:32:00 PM
|
7.98
|
8.34
|
34.17
|
24.42
|
2.29
|
5.00
|
<0.1
|
<0.01
|
|
CE
|
16/4/2024
|
Cloudy
|
Mid-flood
|
Moderate
|
B
|
21
|
1:32:00 PM
|
7.98
|
8.38
|
34.13
|
24.43
|
2.29
|
5.00
|
<0.1
|
<0.01
|
|
CF
|
16/4/2024
|
Cloudy
|
Mid-flood
|
Moderate
|
S
|
1
|
10:39:00 AM
|
8.89
|
8.30
|
33.82
|
24.34
|
2.65
|
4.00
|
<0.1
|
<0.01
|
|
CF
|
16/4/2024
|
Cloudy
|
Mid-flood
|
Moderate
|
S
|
1
|
10:39:00 AM
|
8.82
|
8.25
|
33.89
|
24.32
|
2.62
|
4.00
|
<0.1
|
<0.01
|
|
CF
|
16/4/2024
|
Cloudy
|
Mid-flood
|
Moderate
|
M
|
10
|
10:40:00 AM
|
8.90
|
8.26
|
33.81
|
24.30
|
2.61
|
4.00
|
<0.1
|
<0.01
|
|
CF
|
16/4/2024
|
Cloudy
|
Mid-flood
|
Moderate
|
M
|
10
|
10:40:00 AM
|
8.83
|
8.27
|
33.83
|
24.34
|
2.66
|
5.00
|
<0.1
|
<0.01
|
|
CF
|
16/4/2024
|
Cloudy
|
Mid-flood
|
Moderate
|
B
|
19
|
10:41:00 AM
|
8.91
|
8.28
|
33.90
|
24.37
|
2.64
|
4.00
|
<0.1
|
<0.01
|
|
CF
|
16/4/2024
|
Cloudy
|
Mid-flood
|
Moderate
|
B
|
19
|
10:41:00 AM
|
8.88
|
8.23
|
33.86
|
24.35
|
2.65
|
4.00
|
<0.1
|
<0.01
|
|
Location
|
Date
|
Weather
|
Tide
|
Sea Condition
|
Water Level
|
Depth (m)
|
Time
|
DO (mg/L)
|
pH
|
Sal (ppt)
|
Temp ((�XC)
|
Turbidty (NTU)
|
SS (mg/L)
|
Iron (mg/L)
|
Total Residual Chlorine (mg/L)
|
|
WSR01
|
16/4/2024
|
Cloudy
|
Mid-flood
|
Moderate
|
S
|
1
|
11:02:00 AM
|
8.74
|
8.15
|
33.29
|
24.34
|
1.86
|
4.00
|
<0.1
|
<0.01
|
|
WSR01
|
16/4/2024
|
Cloudy
|
Mid-flood
|
Moderate
|
S
|
1
|
11:02:00 AM
|
8.74
|
8.20
|
33.20
|
24.36
|
1.87
|
4.00
|
<0.1
|
<0.01
|
|
WSR01
|
16/4/2024
|
Cloudy
|
Mid-flood
|
Moderate
|
M
|
4
|
11:03:00 AM
|
8.65
|
8.18
|
33.30
|
24.32
|
1.90
|
7.00
|
<0.1
|
<0.01
|
|
WSR01
|
16/4/2024
|
Cloudy
|
Mid-flood
|
Moderate
|
M
|
4
|
11:03:00 AM
|
8.67
|
8.21
|
33.29
|
24.37
|
1.84
|
5.00
|
<0.1
|
<0.01
|
|
WSR01
|
16/4/2024
|
Cloudy
|
Mid-flood
|
Moderate
|
B
|
8
|
11:04:00 AM
|
8.73
|
8.18
|
33.23
|
24.38
|
1.86
|
4.00
|
<0.1
|
<0.01
|
|
WSR01
|
16/4/2024
|
Cloudy
|
Mid-flood
|
Moderate
|
B
|
8
|
11:04:00 AM
|
8.75
|
8.14
|
33.25
|
24.36
|
1.84
|
5.00
|
<0.1
|
<0.01
|
|
WSR02
|
16/4/2024
|
Cloudy
|
Mid-flood
|
Moderate
|
S
|
1
|
11:20:00 AM
|
8.85
|
8.21
|
32.96
|
24.57
|
1.77
|
5.00
|
<0.1
|
<0.01
|
|
WSR02
|
16/4/2024
|
Cloudy
|
Mid-flood
|
Moderate
|
S
|
1
|
11:20:00 AM
|
8.82
|
8.21
|
32.98
|
24.61
|
1.77
|
3.00
|
<0.1
|
<0.01
|
|
WSR02
|
16/4/2024
|
Cloudy
|
Mid-flood
|
Moderate
|
M
|
5
|
11:21:00 AM
|
8.76
|
8.20
|
32.90
|
24.60
|
1.75
|
3.00
|
<0.1
|
<0.01
|
|
WSR02
|
16/4/2024
|
Cloudy
|
Mid-flood
|
Moderate
|
M
|
5
|
11:21:00 AM
|
8.75
|
8.14
|
32.89
|
24.59
|
1.76
|
4.00
|
<0.1
|
<0.01
|
|
WSR02
|
16/4/2024
|
Cloudy
|
Mid-flood
|
Moderate
|
B
|
8
|
11:22:00 AM
|
8.82
|
8.17
|
32.92
|
24.62
|
1.76
|
4.00
|
<0.1
|
<0.01
|
|
WSR02
|
16/4/2024
|
Cloudy
|
Mid-flood
|
Moderate
|
B
|
8
|
11:22:00 AM
|
8.81
|
8.13
|
32.89
|
24.57
|
1.75
|
3.00
|
<0.1
|
<0.01
|
|
WSR03
|
16/4/2024
|
Cloudy
|
Mid-flood
|
Moderate
|
S
|
1
|
11:36:00 AM
|
7.93
|
8.18
|
33.46
|
24.46
|
1.81
|
3.00
|
<0.1
|
<0.01
|
|
WSR03
|
16/4/2024
|
Cloudy
|
Mid-flood
|
Moderate
|
S
|
1
|
11:36:00 AM
|
7.97
|
8.23
|
33.42
|
24.53
|
1.83
|
4.00
|
<0.1
|
<0.01
|
|
WSR03
|
16/4/2024
|
Cloudy
|
Mid-flood
|
Moderate
|
M
|
4
|
11:37:00 AM
|
7.89
|
8.17
|
33.41
|
24.48
|
1.78
|
7.00
|
<0.1
|
<0.01
|
|
WSR03
|
16/4/2024
|
Cloudy
|
Mid-flood
|
Moderate
|
M
|
4
|
11:37:00 AM
|
7.91
|
8.25
|
33.48
|
24.47
|
1.81
|
4.00
|
<0.1
|
<0.01
|
|
WSR03
|
16/4/2024
|
Cloudy
|
Mid-flood
|
Moderate
|
B
|
7
|
11:38:00 AM
|
7.94
|
8.18
|
33.48
|
24.54
|
1.84
|
5.00
|
<0.1
|
<0.01
|
|
WSR03
|
16/4/2024
|
Cloudy
|
Mid-flood
|
Moderate
|
B
|
7
|
11:38:00 AM
|
7.88
|
8.21
|
33.46
|
24.49
|
1.77
|
3.00
|
<0.1
|
<0.01
|
|
WSR04
|
16/4/2024
|
Cloudy
|
Mid-flood
|
Moderate
|
S
|
1
|
11:50:00 AM
|
8.34
|
8.15
|
33.29
|
24.26
|
2.06
|
3.00
|
<0.1
|
<0.01
|
|
WSR04
|
16/4/2024
|
Cloudy
|
Mid-flood
|
Moderate
|
S
|
1
|
11:50:00 AM
|
8.34
|
8.17
|
33.31
|
24.22
|
2.04
|
5.00
|
<0.1
|
<0.01
|
|
WSR04
|
16/4/2024
|
Cloudy
|
Mid-flood
|
Moderate
|
M
|
4
|
11:51:00 AM
|
8.34
|
8.13
|
33.31
|
24.30
|
2.03
|
6.00
|
<0.1
|
<0.01
|
|
WSR04
|
16/4/2024
|
Cloudy
|
Mid-flood
|
Moderate
|
M
|
4
|
11:51:00 AM
|
8.41
|
8.12
|
33.23
|
24.21
|
2.02
|
5.00
|
<0.1
|
<0.01
|
|
WSR04
|
16/4/2024
|
Cloudy
|
Mid-flood
|
Moderate
|
B
|
6
|
11:52:00 AM
|
8.40
|
8.12
|
33.30
|
24.27
|
2.02
|
6.00
|
<0.1
|
<0.01
|
|
WSR04
|
16/4/2024
|
Cloudy
|
Mid-flood
|
Moderate
|
B
|
6
|
11:52:00 AM
|
8.39
|
8.09
|
33.28
|
24.26
|
1.94
|
5.00
|
<0.1
|
<0.01
|
|
WSR16
|
16/4/2024
|
Cloudy
|
Mid-flood
|
Moderate
|
S
|
1
|
1:09:00 PM
|
8.84
|
8.17
|
32.76
|
24.25
|
2.13
|
4.00
|
<0.1
|
<0.01
|
|
WSR16
|
16/4/2024
|
Cloudy
|
Mid-flood
|
Moderate
|
S
|
1
|
1:09:00 PM
|
8.89
|
8.18
|
32.73
|
24.25
|
2.09
|
4.00
|
<0.1
|
<0.01
|
|
WSR16
|
16/4/2024
|
Cloudy
|
Mid-flood
|
Moderate
|
M
|
8
|
1:10:00 PM
|
8.87
|
8.17
|
32.72
|
24.27
|
2.08
|
8.00
|
<0.1
|
<0.01
|
|
WSR16
|
16/4/2024
|
Cloudy
|
Mid-flood
|
Moderate
|
M
|
8
|
1:10:00 PM
|
8.86
|
8.10
|
32.74
|
24.34
|
2.16
|
6.00
|
<0.1
|
<0.01
|
|
WSR16
|
16/4/2024
|
Cloudy
|
Mid-flood
|
Moderate
|
B
|
14
|
1:11:00 PM
|
8.88
|
8.14
|
32.76
|
24.26
|
2.13
|
6.00
|
<0.1
|
<0.01
|
|
WSR16
|
16/4/2024
|
Cloudy
|
Mid-flood
|
Moderate
|
B
|
14
|
1:11:00 PM
|
8.90
|
8.16
|
32.66
|
24.28
|
2.14
|
4.00
|
<0.1
|
<0.01
|
|
Location
|
Date
|
Weather
|
Tide
|
Sea Condition
|
Water Level
|
Depth (m)
|
Time
|
DO (mg/L)
|
pH
|
Sal (ppt)
|
Temp ((�XC)
|
Turbidty (NTU)
|
SS (mg/L)
|
Iron (mg/L)
|
Total Residual Chlorine (mg/L)
|
|
WSR33
|
16/4/2024
|
Cloudy
|
Mid-flood
|
Moderate
|
S
|
1
|
12:05:00 PM
|
8.64
|
8.36
|
33.91
|
24.29
|
1.97
|
5.00
|
<0.1
|
<0.01
|
|
WSR33
|
16/4/2024
|
Cloudy
|
Mid-flood
|
Moderate
|
S
|
1
|
12:05:00 PM
|
8.70
|
8.41
|
33.89
|
24.24
|
1.98
|
6.00
|
<0.1
|
<0.01
|
|
WSR33
|
16/4/2024
|
Cloudy
|
Mid-flood
|
Moderate
|
M
|
4
|
12:06:00 PM
|
8.66
|
8.34
|
33.86
|
24.28
|
1.99
|
7.00
|
<0.1
|
<0.01
|
|
WSR33
|
16/4/2024
|
Cloudy
|
Mid-flood
|
Moderate
|
M
|
4
|
12:06:00 PM
|
8.69
|
8.42
|
33.91
|
24.21
|
1.93
|
7.00
|
<0.1
|
<0.01
|
|
WSR33
|
16/4/2024
|
Cloudy
|
Mid-flood
|
Moderate
|
B
|
6
|
12:07:00 PM
|
8.72
|
8.41
|
33.92
|
24.22
|
1.99
|
4.00
|
<0.1
|
<0.01
|
|
WSR33
|
16/4/2024
|
Cloudy
|
Mid-flood
|
Moderate
|
B
|
6
|
12:07:00 PM
|
8.69
|
8.38
|
33.87
|
24.25
|
1.94
|
7.00
|
<0.1
|
<0.01
|
|
WSR36
|
16/4/2024
|
Cloudy
|
Mid-flood
|
Moderate
|
S
|
1
|
12:22:00 PM
|
7.94
|
8.31
|
33.08
|
24.31
|
1.44
|
6.00
|
<0.1
|
<0.01
|
|
WSR36
|
16/4/2024
|
Cloudy
|
Mid-flood
|
Moderate
|
S
|
1
|
12:22:00 PM
|
7.96
|
8.32
|
33.13
|
24.30
|
1.46
|
6.00
|
<0.1
|
<0.01
|
|
WSR36
|
16/4/2024
|
Cloudy
|
Mid-flood
|
Moderate
|
M
|
3
|
12:23:00 PM
|
8.02
|
8.25
|
33.16
|
24.29
|
1.44
|
5.00
|
<0.1
|
<0.01
|
|
WSR36
|
16/4/2024
|
Cloudy
|
Mid-flood
|
Moderate
|
M
|
3
|
12:23:00 PM
|
8.02
|
8.33
|
33.14
|
24.30
|
1.41
|
6.00
|
<0.1
|
<0.01
|
|
WSR36
|
16/4/2024
|
Cloudy
|
Mid-flood
|
Moderate
|
B
|
6
|
12:23:00 PM
|
8.01
|
8.30
|
33.09
|
24.36
|
1.46
|
5.00
|
<0.1
|
<0.01
|
|
WSR36
|
16/4/2024
|
Cloudy
|
Mid-flood
|
Moderate
|
B
|
6
|
12:23:00 PM
|
8.00
|
8.33
|
33.08
|
24.36
|
1.40
|
8.00
|
<0.1
|
<0.01
|
|
WSR37
|
16/4/2024
|
Cloudy
|
Mid-flood
|
Moderate
|
S
|
1
|
12:36:00 PM
|
8.65
|
8.20
|
33.61
|
24.22
|
2.14
|
3.00
|
<0.1
|
<0.01
|
|
WSR37
|
16/4/2024
|
Cloudy
|
Mid-flood
|
Moderate
|
S
|
1
|
12:36:00 PM
|
8.74
|
8.21
|
33.55
|
24.26
|
2.18
|
2.50
|
<0.1
|
<0.01
|
|
WSR37
|
16/4/2024
|
Cloudy
|
Mid-flood
|
Moderate
|
M
|
4
|
12:37:00 PM
|
8.68
|
8.22
|
33.61
|
24.22
|
2.18
|
2.50
|
<0.1
|
<0.01
|
|
WSR37
|
16/4/2024
|
Cloudy
|
Mid-flood
|
Moderate
|
M
|
4
|
12:37:00 PM
|
8.71
|
8.22
|
33.59
|
24.23
|
2.11
|
4.00
|
<0.1
|
<0.01
|
|
WSR37
|
16/4/2024
|
Cloudy
|
Mid-flood
|
Moderate
|
B
|
8
|
12:38:00 PM
|
8.69
|
8.25
|
33.59
|
24.19
|
2.18
|
5.00
|
<0.1
|
<0.01
|
|
WSR37
|
16/4/2024
|
Cloudy
|
Mid-flood
|
Moderate
|
B
|
8
|
12:38:00 PM
|
8.69
|
8.18
|
33.65
|
24.22
|
2.11
|
7.00
|
<0.1
|
<0.01
|
|
NF1
|
16/4/2024
|
Cloudy
|
Mid-flood
|
Moderate
|
S
|
1
|
12:57:00 PM
|
8.37
|
8.37
|
33.20
|
24.31
|
1.95
|
3.00
|
<0.1
|
<0.01
|
|
NF1
|
16/4/2024
|
Cloudy
|
Mid-flood
|
Moderate
|
S
|
1
|
12:57:00 PM
|
8.31
|
8.38
|
33.16
|
24.29
|
1.91
|
3.00
|
<0.1
|
<0.01
|
|
NF1
|
16/4/2024
|
Cloudy
|
Mid-flood
|
Moderate
|
M
|
7
|
12:58:00 PM
|
8.30
|
8.31
|
33.11
|
24.35
|
1.93
|
2.50
|
<0.1
|
<0.01
|
|
NF1
|
16/4/2024
|
Cloudy
|
Mid-flood
|
Moderate
|
M
|
7
|
12:58:00 PM
|
8.36
|
8.38
|
33.11
|
24.30
|
1.96
|
3.00
|
<0.1
|
<0.01
|
|
NF1
|
16/4/2024
|
Cloudy
|
Mid-flood
|
Moderate
|
B
|
13
|
12:59:00 PM
|
8.41
|
8.34
|
33.19
|
24.35
|
1.89
|
4.00
|
<0.1
|
<0.01
|
|
NF1
|
16/4/2024
|
Cloudy
|
Mid-flood
|
Moderate
|
B
|
13
|
12:59:00 PM
|
8.36
|
8.39
|
33.12
|
24.33
|
1.96
|
5.00
|
<0.1
|
<0.01
|
|
NF2
|
16/4/2024
|
Cloudy
|
Mid-flood
|
Moderate
|
S
|
1
|
12:49:00 PM
|
8.36
|
8.34
|
33.76
|
24.44
|
2.11
|
2.50
|
<0.1
|
<0.01
|
|
NF2
|
16/4/2024
|
Cloudy
|
Mid-flood
|
Moderate
|
S
|
1
|
12:49:00 PM
|
8.32
|
8.34
|
33.70
|
24.39
|
2.14
|
2.50
|
<0.1
|
<0.01
|
|
NF2
|
16/4/2024
|
Cloudy
|
Mid-flood
|
Moderate
|
M
|
5
|
12:50:00 PM
|
8.31
|
8.35
|
33.79
|
24.43
|
2.14
|
3.00
|
<0.1
|
<0.01
|
|
NF2
|
16/4/2024
|
Cloudy
|
Mid-flood
|
Moderate
|
M
|
5
|
12:50:00 PM
|
8.39
|
8.31
|
33.73
|
24.40
|
2.17
|
3.00
|
<0.1
|
<0.01
|
|
NF2
|
16/4/2024
|
Cloudy
|
Mid-flood
|
Moderate
|
B
|
9
|
12:51:00 PM
|
8.41
|
8.34
|
33.70
|
24.42
|
2.18
|
4.00
|
<0.1
|
<0.01
|
|
NF2
|
16/4/2024
|
Cloudy
|
Mid-flood
|
Moderate
|
B
|
9
|
12:51:00 PM
|
8.33
|
8.35
|
33.78
|
24.36
|
2.10
|
5.00
|
<0.1
|
<0.01
|
|
Location
|
Date
|
Weather
|
Tide
|
Sea Condition
|
Water Level
|
Depth (m)
|
Time
|
DO (mg/L)
|
pH
|
Sal (ppt)
|
Temp ((�XC)
|
Turbidty (NTU)
|
SS (mg/L)
|
Iron (mg/L)
|
Total Residual Chlorine (mg/L)
|
|
NF3
|
16/4/2024
|
Cloudy
|
Mid-flood
|
Moderate
|
S
|
1
|
12:42:00 PM
|
8.52
|
8.22
|
33.22
|
24.44
|
1.68
|
2.50
|
<0.1
|
<0.01
|
|
NF3
|
16/4/2024
|
Cloudy
|
Mid-flood
|
Moderate
|
S
|
1
|
12:42:00 PM
|
8.52
|
8.18
|
33.23
|
24.43
|
1.68
|
4.00
|
<0.1
|
<0.01
|
|
NF3
|
16/4/2024
|
Cloudy
|
Mid-flood
|
Moderate
|
M
|
6
|
12:43:00 PM
|
8.41
|
8.20
|
33.25
|
24.48
|
1.70
|
4.00
|
<0.1
|
<0.01
|
|
NF3
|
16/4/2024
|
Cloudy
|
Mid-flood
|
Moderate
|
M
|
6
|
12:43:00 PM
|
8.44
|
8.19
|
33.19
|
24.46
|
1.67
|
2.50
|
<0.1
|
<0.01
|
|
NF3
|
16/4/2024
|
Cloudy
|
Mid-flood
|
Moderate
|
B
|
11
|
12:44:00 PM
|
8.48
|
8.23
|
33.21
|
24.46
|
1.64
|
7.00
|
<0.1
|
<0.01
|
|
NF3
|
16/4/2024
|
Cloudy
|
Mid-flood
|
Moderate
|
B
|
11
|
12:44:00 PM
|
8.42
|
8.14
|
33.20
|
24.45
|
1.63
|
4.00
|
<0.1
|
<0.01
|
|
CE
|
18/4/2024
|
Cloudy
|
Mid-flood
|
Moderate
|
S
|
1
|
10:49:00 AM
|
8.47
|
8.35
|
32.50
|
24.55
|
2.43
|
4.00
|
<0.1
|
<0.01
|
|
CE
|
18/4/2024
|
Cloudy
|
Mid-flood
|
Moderate
|
S
|
1
|
10:49:00 AM
|
8.43
|
8.39
|
32.57
|
24.59
|
2.46
|
4.00
|
<0.1
|
<0.01
|
|
CE
|
18/4/2024
|
Cloudy
|
Mid-flood
|
Moderate
|
M
|
11
|
10:50:00 AM
|
8.46
|
8.36
|
32.51
|
24.66
|
2.44
|
3.00
|
<0.1
|
<0.01
|
|
CE
|
18/4/2024
|
Cloudy
|
Mid-flood
|
Moderate
|
M
|
11
|
10:50:00 AM
|
8.42
|
8.34
|
32.49
|
24.62
|
2.40
|
3.00
|
<0.1
|
<0.01
|
|
CE
|
18/4/2024
|
Cloudy
|
Mid-flood
|
Moderate
|
B
|
21
|
10:51:00 AM
|
8.36
|
8.37
|
32.45
|
24.56
|
2.46
|
4.00
|
<0.1
|
<0.01
|
|
CE
|
18/4/2024
|
Cloudy
|
Mid-flood
|
Moderate
|
B
|
21
|
10:51:00 AM
|
8.44
|
8.38
|
32.68
|
24.59
|
2.32
|
5.00
|
<0.1
|
<0.01
|
|
CF
|
18/4/2024
|
Cloudy
|
Mid-flood
|
Moderate
|
S
|
1
|
8:00:00 AM
|
8.97
|
8.20
|
32.87
|
24.61
|
2.54
|
4.00
|
<0.1
|
<0.01
|
|
CF
|
18/4/2024
|
Cloudy
|
Mid-flood
|
Moderate
|
S
|
1
|
8:00:00 AM
|
9.01
|
8.20
|
32.69
|
24.60
|
2.56
|
3.00
|
<0.1
|
<0.01
|
|
CF
|
18/4/2024
|
Cloudy
|
Mid-flood
|
Moderate
|
M
|
10
|
8:01:00 AM
|
9.03
|
8.17
|
32.61
|
24.60
|
2.65
|
5.00
|
<0.1
|
<0.01
|
|
CF
|
18/4/2024
|
Cloudy
|
Mid-flood
|
Moderate
|
M
|
10
|
8:01:00 AM
|
9.07
|
8.16
|
32.83
|
24.66
|
2.63
|
4.00
|
<0.1
|
<0.01
|
|
CF
|
18/4/2024
|
Cloudy
|
Mid-flood
|
Moderate
|
B
|
19
|
8:02:00 AM
|
9.05
|
8.18
|
32.76
|
24.55
|
2.63
|
6.00
|
<0.1
|
<0.01
|
|
CF
|
18/4/2024
|
Cloudy
|
Mid-flood
|
Moderate
|
B
|
19
|
8:02:00 AM
|
9.04
|
8.17
|
32.70
|
24.55
|
2.61
|
5.00
|
<0.1
|
<0.01
|
|
WSR01
|
18/4/2024
|
Cloudy
|
Mid-flood
|
Moderate
|
S
|
1
|
8:22:00 AM
|
9.26
|
8.32
|
32.94
|
24.87
|
1.82
|
4.00
|
<0.1
|
<0.01
|
|
WSR01
|
18/4/2024
|
Cloudy
|
Mid-flood
|
Moderate
|
S
|
1
|
8:22:00 AM
|
9.27
|
8.32
|
32.74
|
25.00
|
1.78
|
2.50
|
<0.1
|
<0.01
|
|
WSR01
|
18/4/2024
|
Cloudy
|
Mid-flood
|
Moderate
|
M
|
4
|
8:23:00 AM
|
9.32
|
8.33
|
32.96
|
24.96
|
1.77
|
2.50
|
<0.1
|
<0.01
|
|
WSR01
|
18/4/2024
|
Cloudy
|
Mid-flood
|
Moderate
|
M
|
4
|
8:23:00 AM
|
9.28
|
8.35
|
32.90
|
24.94
|
1.77
|
2.50
|
<0.1
|
<0.01
|
|
WSR01
|
18/4/2024
|
Cloudy
|
Mid-flood
|
Moderate
|
B
|
8
|
8:24:00 AM
|
9.31
|
8.33
|
32.85
|
24.94
|
1.78
|
2.50
|
<0.1
|
<0.01
|
|
WSR01
|
18/4/2024
|
Cloudy
|
Mid-flood
|
Moderate
|
B
|
8
|
8:24:00 AM
|
9.22
|
8.32
|
32.87
|
24.97
|
1.85
|
3.00
|
<0.1
|
<0.01
|
|
WSR02
|
18/4/2024
|
Cloudy
|
Mid-flood
|
Moderate
|
S
|
1
|
8:41:00 AM
|
8.72
|
8.36
|
33.49
|
24.86
|
1.68
|
2.50
|
<0.1
|
<0.01
|
|
WSR02
|
18/4/2024
|
Cloudy
|
Mid-flood
|
Moderate
|
S
|
1
|
8:41:00 AM
|
8.67
|
8.39
|
33.64
|
24.78
|
1.78
|
2.50
|
<0.1
|
<0.01
|
|
WSR02
|
18/4/2024
|
Cloudy
|
Mid-flood
|
Moderate
|
M
|
5
|
8:42:00 AM
|
8.67
|
8.41
|
33.47
|
24.87
|
1.73
|
3.00
|
<0.1
|
<0.01
|
|
WSR02
|
18/4/2024
|
Cloudy
|
Mid-flood
|
Moderate
|
M
|
5
|
8:42:00 AM
|
8.75
|
8.42
|
33.60
|
24.87
|
1.73
|
3.00
|
<0.1
|
<0.01
|
|
WSR02
|
18/4/2024
|
Cloudy
|
Mid-flood
|
Moderate
|
B
|
9
|
8:43:00 AM
|
8.66
|
8.40
|
33.42
|
24.74
|
1.76
|
3.00
|
<0.1
|
<0.01
|
|
WSR02
|
18/4/2024
|
Cloudy
|
Mid-flood
|
Moderate
|
B
|
9
|
8:43:00 AM
|
8.66
|
8.41
|
33.60
|
24.79
|
1.77
|
4.00
|
<0.1
|
<0.01
|
|
Location
|
Date
|
Weather
|
Tide
|
Sea Condition
|
Water Level
|
Depth (m)
|
Time
|
DO (mg/L)
|
pH
|
Sal (ppt)
|
Temp ((�XC)
|
Turbidty (NTU)
|
SS (mg/L)
|
Iron (mg/L)
|
Total Residual Chlorine (mg/L)
|
|
WSR03
|
18/4/2024
|
Cloudy
|
Mid-flood
|
Moderate
|
S
|
1
|
8:55:00 AM
|
8.30
|
8.33
|
33.81
|
24.81
|
1.81
|
3.00
|
<0.1
|
<0.01
|
|
WSR03
|
18/4/2024
|
Cloudy
|
Mid-flood
|
Moderate
|
S
|
1
|
8:55:00 AM
|
8.26
|
8.31
|
33.95
|
24.79
|
1.83
|
4.00
|
<0.1
|
<0.01
|
|
WSR03
|
18/4/2024
|
Cloudy
|
Mid-flood
|
Moderate
|
M
|
4
|
8:56:00 AM
|
8.34
|
8.27
|
33.93
|
24.80
|
1.73
|
5.00
|
<0.1
|
<0.01
|
|
WSR03
|
18/4/2024
|
Cloudy
|
Mid-flood
|
Moderate
|
M
|
4
|
8:56:00 AM
|
8.33
|
8.28
|
33.92
|
24.73
|
1.79
|
3.00
|
<0.1
|
<0.01
|
|
WSR03
|
18/4/2024
|
Cloudy
|
Mid-flood
|
Moderate
|
B
|
8
|
8:57:00 AM
|
8.37
|
8.26
|
33.80
|
24.80
|
1.87
|
6.00
|
<0.1
|
<0.01
|
|
WSR03
|
18/4/2024
|
Cloudy
|
Mid-flood
|
Moderate
|
B
|
8
|
8:57:00 AM
|
8.23
|
8.29
|
33.79
|
24.80
|
1.76
|
5.00
|
<0.1
|
<0.01
|
|
WSR04
|
18/4/2024
|
Cloudy
|
Mid-flood
|
Moderate
|
S
|
1
|
9:09:00 AM
|
7.90
|
8.20
|
32.74
|
24.68
|
1.64
|
4.00
|
<0.1
|
<0.01
|
|
WSR04
|
18/4/2024
|
Cloudy
|
Mid-flood
|
Moderate
|
S
|
1
|
9:09:00 AM
|
7.87
|
8.14
|
32.70
|
24.70
|
1.62
|
5.00
|
<0.1
|
<0.01
|
|
WSR04
|
18/4/2024
|
Cloudy
|
Mid-flood
|
Moderate
|
M
|
4
|
9:10:00 AM
|
7.96
|
8.21
|
32.67
|
24.57
|
1.76
|
4.00
|
<0.1
|
<0.01
|
|
WSR04
|
18/4/2024
|
Cloudy
|
Mid-flood
|
Moderate
|
M
|
4
|
9:10:00 AM
|
7.92
|
8.15
|
32.75
|
24.59
|
1.75
|
3.00
|
<0.1
|
<0.01
|
|
WSR04
|
18/4/2024
|
Cloudy
|
Mid-flood
|
Moderate
|
B
|
6
|
9:11:00 AM
|
7.88
|
8.14
|
32.78
|
24.71
|
1.75
|
3.00
|
<0.1
|
<0.01
|
|
WSR04
|
18/4/2024
|
Cloudy
|
Mid-flood
|
Moderate
|
B
|
6
|
9:11:00 AM
|
7.90
|
8.15
|
32.75
|
24.62
|
1.65
|
4.00
|
<0.1
|
<0.01
|
|
WSR16
|
18/4/2024
|
Cloudy
|
Mid-flood
|
Moderate
|
S
|
1
|
10:29:00 AM
|
8.43
|
8.12
|
33.36
|
24.76
|
1.79
|
3.00
|
<0.1
|
<0.01
|
|
WSR16
|
18/4/2024
|
Cloudy
|
Mid-flood
|
Moderate
|
S
|
1
|
10:29:00 AM
|
8.49
|
8.19
|
33.47
|
24.83
|
1.74
|
5.00
|
<0.1
|
<0.01
|
|
WSR16
|
18/4/2024
|
Cloudy
|
Mid-flood
|
Moderate
|
M
|
8
|
10:30:00 AM
|
8.43
|
8.17
|
33.42
|
24.82
|
1.77
|
3.00
|
<0.1
|
<0.01
|
|
WSR16
|
18/4/2024
|
Cloudy
|
Mid-flood
|
Moderate
|
M
|
8
|
10:30:00 AM
|
8.56
|
8.15
|
33.27
|
24.85
|
1.76
|
5.00
|
<0.1
|
<0.01
|
|
WSR16
|
18/4/2024
|
Cloudy
|
Mid-flood
|
Moderate
|
B
|
15
|
10:31:00 AM
|
8.55
|
8.14
|
33.47
|
24.79
|
1.68
|
4.00
|
<0.1
|
<0.01
|
|
WSR16
|
18/4/2024
|
Cloudy
|
Mid-flood
|
Moderate
|
B
|
15
|
10:31:00 AM
|
8.42
|
8.14
|
33.26
|
24.83
|
1.73
|
5.00
|
<0.1
|
<0.01
|
|
WSR33
|
18/4/2024
|
Cloudy
|
Mid-flood
|
Moderate
|
S
|
1
|
9:24:00 AM
|
9.13
|
8.25
|
33.15
|
25.00
|
1.92
|
4.00
|
<0.1
|
<0.01
|
|
WSR33
|
18/4/2024
|
Cloudy
|
Mid-flood
|
Moderate
|
S
|
1
|
9:24:00 AM
|
9.05
|
8.25
|
32.98
|
25.05
|
2.04
|
4.00
|
<0.1
|
<0.01
|
|
WSR33
|
18/4/2024
|
Cloudy
|
Mid-flood
|
Moderate
|
M
|
4
|
9:25:00 AM
|
9.16
|
8.28
|
32.98
|
24.94
|
2.03
|
6.00
|
<0.1
|
<0.01
|
|
WSR33
|
18/4/2024
|
Cloudy
|
Mid-flood
|
Moderate
|
M
|
4
|
9:25:00 AM
|
9.11
|
8.30
|
33.10
|
24.91
|
2.02
|
5.00
|
<0.1
|
<0.01
|
|
WSR33
|
18/4/2024
|
Cloudy
|
Mid-flood
|
Moderate
|
B
|
6
|
9:26:00 AM
|
9.08
|
8.28
|
32.88
|
24.90
|
1.96
|
4.00
|
<0.1
|
<0.01
|
|
WSR33
|
18/4/2024
|
Cloudy
|
Mid-flood
|
Moderate
|
B
|
6
|
9:26:00 AM
|
9.15
|
8.26
|
33.03
|
24.96
|
1.96
|
5.00
|
<0.1
|
<0.01
|
|
WSR36
|
18/4/2024
|
Cloudy
|
Mid-flood
|
Moderate
|
S
|
1
|
9:39:00 AM
|
9.38
|
8.19
|
32.63
|
24.79
|
1.93
|
3.00
|
<0.1
|
<0.01
|
|
WSR36
|
18/4/2024
|
Cloudy
|
Mid-flood
|
Moderate
|
S
|
1
|
9:39:00 AM
|
9.38
|
8.17
|
32.70
|
24.74
|
1.89
|
6.00
|
<0.1
|
<0.01
|
|
WSR36
|
18/4/2024
|
Cloudy
|
Mid-flood
|
Moderate
|
M
|
3
|
9:40:00 AM
|
9.33
|
8.16
|
32.67
|
24.75
|
1.95
|
4.00
|
<0.1
|
<0.01
|
|
WSR36
|
18/4/2024
|
Cloudy
|
Mid-flood
|
Moderate
|
M
|
3
|
9:40:00 AM
|
9.35
|
8.15
|
32.70
|
24.73
|
1.86
|
4.00
|
<0.1
|
<0.01
|
|
WSR36
|
18/4/2024
|
Cloudy
|
Mid-flood
|
Moderate
|
B
|
6
|
9:40:00 AM
|
9.36
|
8.21
|
32.62
|
24.79
|
1.91
|
4.00
|
<0.1
|
<0.01
|
|
WSR36
|
18/4/2024
|
Cloudy
|
Mid-flood
|
Moderate
|
B
|
6
|
9:40:00 AM
|
9.34
|
8.18
|
32.74
|
24.70
|
1.87
|
2.50
|
<0.1
|
<0.01
|
|
Location
|
Date
|
Weather
|
Tide
|
Sea Condition
|
Water Level
|
Depth (m)
|
Time
|
DO (mg/L)
|
pH
|
Sal (ppt)
|
Temp ((�XC)
|
Turbidty (NTU)
|
SS (mg/L)
|
Iron (mg/L)
|
Total Residual Chlorine (mg/L)
|
|
WSR37
|
18/4/2024
|
Cloudy
|
Mid-flood
|
Moderate
|
S
|
1
|
9:53:00 AM
|
8.68
|
8.32
|
32.70
|
25.00
|
2.00
|
5.00
|
<0.1
|
<0.01
|
|
WSR37
|
18/4/2024
|
Cloudy
|
Mid-flood
|
Moderate
|
S
|
1
|
9:53:00 AM
|
8.55
|
8.25
|
32.46
|
24.96
|
2.08
|
4.00
|
<0.1
|
<0.01
|
|
WSR37
|
18/4/2024
|
Cloudy
|
Mid-flood
|
Moderate
|
M
|
4
|
9:54:00 AM
|
8.54
|
8.31
|
32.50
|
24.93
|
1.97
|
4.00
|
<0.1
|
<0.01
|
|
WSR37
|
18/4/2024
|
Cloudy
|
Mid-flood
|
Moderate
|
M
|
4
|
9:54:00 AM
|
8.63
|
8.27
|
32.54
|
24.99
|
1.95
|
5.00
|
<0.1
|
<0.01
|
|
WSR37
|
18/4/2024
|
Cloudy
|
Mid-flood
|
Moderate
|
B
|
8
|
9:55:00 AM
|
8.65
|
8.29
|
32.71
|
24.90
|
2.08
|
4.00
|
<0.1
|
<0.01
|
|
WSR37
|
18/4/2024
|
Cloudy
|
Mid-flood
|
Moderate
|
B
|
8
|
9:55:00 AM
|
8.65
|
8.29
|
32.52
|
24.87
|
2.00
|
6.00
|
<0.1
|
<0.01
|
|
NF1
|
18/4/2024
|
Cloudy
|
Mid-flood
|
Moderate
|
S
|
1
|
10:17:00 AM
|
8.52
|
8.23
|
32.97
|
24.72
|
2.08
|
4.00
|
<0.1
|
<0.01
|
|
NF1
|
18/4/2024
|
Cloudy
|
Mid-flood
|
Moderate
|
S
|
1
|
10:17:00 AM
|
8.53
|
8.23
|
33.07
|
24.67
|
2.14
|
6.00
|
<0.1
|
<0.01
|
|
NF1
|
18/4/2024
|
Cloudy
|
Mid-flood
|
Moderate
|
M
|
7
|
10:18:00 AM
|
8.42
|
8.22
|
32.93
|
24.69
|
2.18
|
4.00
|
<0.1
|
<0.01
|
|
NF1
|
18/4/2024
|
Cloudy
|
Mid-flood
|
Moderate
|
M
|
7
|
10:18:00 AM
|
8.49
|
8.21
|
33.07
|
24.78
|
2.11
|
2.50
|
<0.1
|
<0.01
|
|
NF1
|
18/4/2024
|
Cloudy
|
Mid-flood
|
Moderate
|
B
|
13
|
10:19:00 AM
|
8.41
|
8.26
|
32.96
|
24.71
|
2.15
|
5.00
|
<0.1
|
<0.01
|
|
NF1
|
18/4/2024
|
Cloudy
|
Mid-flood
|
Moderate
|
B
|
13
|
10:19:00 AM
|
8.43
|
8.20
|
33.04
|
24.75
|
2.08
|
5.00
|
<0.1
|
<0.01
|
|
NF2
|
18/4/2024
|
Cloudy
|
Mid-flood
|
Moderate
|
S
|
1
|
10:09:00 AM
|
8.20
|
8.24
|
33.16
|
24.62
|
1.82
|
8.00
|
<0.1
|
<0.01
|
|
NF2
|
18/4/2024
|
Cloudy
|
Mid-flood
|
Moderate
|
S
|
1
|
10:09:00 AM
|
8.20
|
8.28
|
33.13
|
24.68
|
1.79
|
5.00
|
<0.1
|
<0.01
|
|
NF2
|
18/4/2024
|
Cloudy
|
Mid-flood
|
Moderate
|
M
|
5
|
10:10:00 AM
|
8.25
|
8.28
|
33.05
|
24.63
|
1.91
|
4.00
|
<0.1
|
<0.01
|
|
NF2
|
18/4/2024
|
Cloudy
|
Mid-flood
|
Moderate
|
M
|
5
|
10:10:00 AM
|
8.29
|
8.24
|
32.96
|
24.65
|
1.89
|
4.00
|
<0.1
|
<0.01
|
|
NF2
|
18/4/2024
|
Cloudy
|
Mid-flood
|
Moderate
|
B
|
10
|
10:11:00 AM
|
8.21
|
8.27
|
33.00
|
24.68
|
1.82
|
6.00
|
<0.1
|
<0.01
|
|
NF2
|
18/4/2024
|
Cloudy
|
Mid-flood
|
Moderate
|
B
|
10
|
10:11:00 AM
|
8.23
|
8.29
|
33.11
|
24.69
|
1.79
|
5.00
|
<0.1
|
<0.01
|
|
NF3
|
18/4/2024
|
Cloudy
|
Mid-flood
|
Moderate
|
S
|
1
|
10:02:00 AM
|
8.71
|
8.29
|
33.56
|
24.96
|
2.22
|
4.00
|
<0.1
|
<0.01
|
|
NF3
|
18/4/2024
|
Cloudy
|
Mid-flood
|
Moderate
|
S
|
1
|
10:02:00 AM
|
8.65
|
8.36
|
33.49
|
24.85
|
2.24
|
4.00
|
<0.1
|
<0.01
|
|
NF3
|
18/4/2024
|
Cloudy
|
Mid-flood
|
Moderate
|
M
|
6
|
10:03:00 AM
|
8.75
|
8.31
|
33.63
|
24.88
|
2.24
|
5.00
|
<0.1
|
<0.01
|
|
NF3
|
18/4/2024
|
Cloudy
|
Mid-flood
|
Moderate
|
M
|
6
|
10:03:00 AM
|
8.62
|
8.32
|
33.63
|
24.83
|
2.33
|
5.00
|
<0.1
|
<0.01
|
|
NF3
|
18/4/2024
|
Cloudy
|
Mid-flood
|
Moderate
|
B
|
11
|
10:04:00 AM
|
8.75
|
8.28
|
33.48
|
24.81
|
2.29
|
5.00
|
<0.1
|
<0.01
|
|
NF3
|
18/4/2024
|
Cloudy
|
Mid-flood
|
Moderate
|
B
|
11
|
10:04:00 AM
|
8.66
|
8.32
|
33.65
|
24.82
|
2.26
|
4.00
|
<0.1
|
<0.01
|
|
CE
|
20/4/2024
|
Cloudy
|
Mid-ebb
|
Moderate
|
S
|
1
|
9:00:00 AM
|
9.10
|
8.34
|
32.75
|
24.86
|
2.26
|
2.50
|
<0.1
|
<0.01
|
|
CE
|
20/4/2024
|
Cloudy
|
Mid-ebb
|
Moderate
|
S
|
1
|
9:00:00 AM
|
9.09
|
8.38
|
32.71
|
24.89
|
2.23
|
2.50
|
<0.1
|
<0.01
|
|
CE
|
20/4/2024
|
Cloudy
|
Mid-ebb
|
Moderate
|
M
|
11
|
9:01:00 AM
|
9.12
|
8.30
|
32.81
|
24.89
|
2.22
|
2.50
|
<0.1
|
<0.01
|
|
CE
|
20/4/2024
|
Cloudy
|
Mid-ebb
|
Moderate
|
M
|
11
|
9:01:00 AM
|
9.10
|
8.30
|
32.68
|
24.92
|
2.20
|
2.50
|
<0.1
|
<0.01
|
|
CE
|
20/4/2024
|
Cloudy
|
Mid-ebb
|
Moderate
|
B
|
22
|
9:02:00 AM
|
9.11
|
8.36
|
32.75
|
24.87
|
2.30
|
3.00
|
<0.1
|
<0.01
|
|
CE
|
20/4/2024
|
Cloudy
|
Mid-ebb
|
Moderate
|
B
|
22
|
9:02:00 AM
|
9.10
|
8.38
|
32.66
|
24.92
|
2.20
|
2.50
|
<0.1
|
<0.01
|
|
Location
|
Date
|
Weather
|
Tide
|
Sea Condition
|
Water Level
|
Depth (m)
|
Time
|
DO (mg/L)
|
pH
|
Sal (ppt)
|
Temp ((�XC)
|
Turbidty (NTU)
|
SS (mg/L)
|
Iron (mg/L)
|
Total Residual Chlorine (mg/L)
|
|
CF
|
20/4/2024
|
Cloudy
|
Mid-ebb
|
Moderate
|
S
|
1
|
12:03:00 PM
|
9.05
|
8.34
|
33.28
|
25.10
|
2.49
|
4.00
|
<0.1
|
<0.01
|
|
CF
|
20/4/2024
|
Cloudy
|
Mid-ebb
|
Moderate
|
S
|
1
|
12:03:00 PM
|
9.11
|
8.35
|
33.26
|
25.09
|
2.41
|
2.50
|
<0.1
|
<0.01
|
|
CF
|
20/4/2024
|
Cloudy
|
Mid-ebb
|
Moderate
|
M
|
10
|
12:04:00 PM
|
8.98
|
8.36
|
33.13
|
25.12
|
2.37
|
2.50
|
<0.1
|
<0.01
|
|
CF
|
20/4/2024
|
Cloudy
|
Mid-ebb
|
Moderate
|
M
|
10
|
12:04:00 PM
|
8.99
|
8.36
|
33.15
|
25.10
|
2.36
|
3.00
|
<0.1
|
<0.01
|
|
CF
|
20/4/2024
|
Cloudy
|
Mid-ebb
|
Moderate
|
B
|
20
|
12:05:00 PM
|
9.01
|
8.32
|
33.18
|
25.08
|
2.36
|
2.50
|
<0.1
|
<0.01
|
|
CF
|
20/4/2024
|
Cloudy
|
Mid-ebb
|
Moderate
|
B
|
20
|
12:05:00 PM
|
9.06
|
8.36
|
33.15
|
25.05
|
2.35
|
2.50
|
<0.1
|
<0.01
|
|
WSR01
|
20/4/2024
|
Cloudy
|
Mid-ebb
|
Moderate
|
S
|
1
|
11:39:00 AM
|
8.23
|
8.22
|
33.05
|
24.94
|
1.64
|
4.00
|
<0.1
|
<0.01
|
|
WSR01
|
20/4/2024
|
Cloudy
|
Mid-ebb
|
Moderate
|
S
|
1
|
11:39:00 AM
|
8.23
|
8.20
|
33.06
|
24.97
|
1.57
|
4.00
|
<0.1
|
<0.01
|
|
WSR01
|
20/4/2024
|
Cloudy
|
Mid-ebb
|
Moderate
|
M
|
4
|
11:40:00 AM
|
8.19
|
8.22
|
33.06
|
24.97
|
1.58
|
2.50
|
<0.1
|
<0.01
|
|
WSR01
|
20/4/2024
|
Cloudy
|
Mid-ebb
|
Moderate
|
M
|
4
|
11:40:00 AM
|
8.23
|
8.26
|
32.98
|
24.94
|
1.59
|
2.50
|
<0.1
|
<0.01
|
|
WSR01
|
20/4/2024
|
Cloudy
|
Mid-ebb
|
Moderate
|
B
|
8
|
11:41:00 AM
|
8.33
|
8.19
|
33.05
|
24.98
|
1.61
|
2.50
|
<0.1
|
<0.01
|
|
WSR01
|
20/4/2024
|
Cloudy
|
Mid-ebb
|
Moderate
|
B
|
8
|
11:41:00 AM
|
8.23
|
8.18
|
33.09
|
24.94
|
1.62
|
2.50
|
<0.1
|
<0.01
|
|
WSR02
|
20/4/2024
|
Cloudy
|
Mid-ebb
|
Moderate
|
S
|
1
|
11:20:00 AM
|
9.16
|
8.33
|
33.11
|
24.98
|
1.87
|
2.50
|
<0.1
|
<0.01
|
|
WSR02
|
20/4/2024
|
Cloudy
|
Mid-ebb
|
Moderate
|
S
|
1
|
11:20:00 AM
|
9.18
|
8.32
|
33.09
|
24.99
|
1.81
|
3.00
|
<0.1
|
<0.01
|
|
WSR02
|
20/4/2024
|
Cloudy
|
Mid-ebb
|
Moderate
|
M
|
5
|
11:21:00 AM
|
9.10
|
8.30
|
33.05
|
24.96
|
1.80
|
3.00
|
<0.1
|
<0.01
|
|
WSR02
|
20/4/2024
|
Cloudy
|
Mid-ebb
|
Moderate
|
M
|
5
|
11:21:00 AM
|
9.10
|
8.33
|
33.11
|
25.02
|
1.87
|
2.50
|
<0.1
|
<0.01
|
|
WSR02
|
20/4/2024
|
Cloudy
|
Mid-ebb
|
Moderate
|
B
|
8
|
11:22:00 AM
|
9.15
|
8.33
|
33.06
|
24.95
|
1.87
|
2.50
|
<0.1
|
<0.01
|
|
WSR02
|
20/4/2024
|
Cloudy
|
Mid-ebb
|
Moderate
|
B
|
8
|
11:22:00 AM
|
9.17
|
8.32
|
33.13
|
24.98
|
1.87
|
2.50
|
<0.1
|
<0.01
|
|
WSR03
|
20/4/2024
|
Cloudy
|
Mid-ebb
|
Moderate
|
S
|
1
|
11:05:00 AM
|
8.43
|
8.29
|
32.35
|
25.03
|
1.73
|
3.00
|
<0.1
|
<0.01
|
|
WSR03
|
20/4/2024
|
Cloudy
|
Mid-ebb
|
Moderate
|
S
|
1
|
11:05:00 AM
|
8.44
|
8.32
|
32.38
|
25.00
|
1.84
|
3.00
|
<0.1
|
<0.01
|
|
WSR03
|
20/4/2024
|
Cloudy
|
Mid-ebb
|
Moderate
|
M
|
4
|
11:06:00 AM
|
8.36
|
8.24
|
32.36
|
25.01
|
1.82
|
2.50
|
<0.1
|
<0.01
|
|
WSR03
|
20/4/2024
|
Cloudy
|
Mid-ebb
|
Moderate
|
M
|
4
|
11:06:00 AM
|
8.35
|
8.28
|
32.25
|
25.03
|
1.83
|
4.00
|
<0.1
|
<0.01
|
|
WSR03
|
20/4/2024
|
Cloudy
|
Mid-ebb
|
Moderate
|
B
|
7
|
11:07:00 AM
|
8.39
|
8.25
|
32.34
|
25.00
|
1.83
|
3.00
|
<0.1
|
<0.01
|
|
WSR03
|
20/4/2024
|
Cloudy
|
Mid-ebb
|
Moderate
|
B
|
7
|
11:07:00 AM
|
8.39
|
8.31
|
32.40
|
25.00
|
1.78
|
2.50
|
<0.1
|
<0.01
|
|
WSR04
|
20/4/2024
|
Cloudy
|
Mid-ebb
|
Moderate
|
S
|
1
|
11:50:00 AM
|
9.19
|
8.22
|
32.57
|
25.07
|
2.10
|
2.50
|
<0.1
|
<0.01
|
|
WSR04
|
20/4/2024
|
Cloudy
|
Mid-ebb
|
Moderate
|
S
|
1
|
11:50:00 AM
|
9.17
|
8.23
|
32.53
|
25.10
|
2.10
|
3.00
|
<0.1
|
<0.01
|
|
WSR04
|
20/4/2024
|
Cloudy
|
Mid-ebb
|
Moderate
|
M
|
3
|
11:51:00 AM
|
9.12
|
8.29
|
32.47
|
25.06
|
2.17
|
2.50
|
<0.1
|
<0.01
|
|
WSR04
|
20/4/2024
|
Cloudy
|
Mid-ebb
|
Moderate
|
M
|
3
|
11:51:00 AM
|
9.10
|
8.25
|
32.54
|
25.09
|
2.11
|
2.50
|
<0.1
|
<0.01
|
|
WSR04
|
20/4/2024
|
Cloudy
|
Mid-ebb
|
Moderate
|
B
|
6
|
11:52:00 AM
|
9.14
|
8.27
|
32.62
|
25.07
|
2.19
|
2.50
|
<0.1
|
<0.01
|
|
WSR04
|
20/4/2024
|
Cloudy
|
Mid-ebb
|
Moderate
|
B
|
6
|
11:52:00 AM
|
9.10
|
8.30
|
32.50
|
25.12
|
2.10
|
2.50
|
<0.1
|
<0.01
|
|
Location
|
Date
|
Weather
|
Tide
|
Sea Condition
|
Water Level
|
Depth (m)
|
Time
|
DO (mg/L)
|
pH
|
Sal (ppt)
|
Temp ((�XC)
|
Turbidty (NTU)
|
SS (mg/L)
|
Iron (mg/L)
|
Total Residual Chlorine (mg/L)
|
|
WSR16
|
20/4/2024
|
Cloudy
|
Mid-ebb
|
Moderate
|
S
|
1
|
9:22:00 AM
|
8.65
|
8.30
|
33.75
|
25.06
|
2.19
|
3.00
|
<0.1
|
<0.01
|
|
WSR16
|
20/4/2024
|
Cloudy
|
Mid-ebb
|
Moderate
|
S
|
1
|
9:22:00 AM
|
8.52
|
8.35
|
33.68
|
25.03
|
2.21
|
2.50
|
<0.1
|
<0.01
|
|
WSR16
|
20/4/2024
|
Cloudy
|
Mid-ebb
|
Moderate
|
M
|
9
|
9:23:00 AM
|
8.66
|
8.31
|
33.73
|
25.03
|
2.19
|
2.50
|
<0.1
|
<0.01
|
|
WSR16
|
20/4/2024
|
Cloudy
|
Mid-ebb
|
Moderate
|
M
|
9
|
9:23:00 AM
|
8.66
|
8.35
|
33.73
|
25.02
|
2.15
|
2.50
|
<0.1
|
<0.01
|
|
WSR16
|
20/4/2024
|
Cloudy
|
Mid-ebb
|
Moderate
|
B
|
16
|
9:24:00 AM
|
8.58
|
8.31
|
33.64
|
25.06
|
2.20
|
2.50
|
<0.1
|
<0.01
|
|
WSR16
|
20/4/2024
|
Cloudy
|
Mid-ebb
|
Moderate
|
B
|
16
|
9:24:00 AM
|
8.53
|
8.36
|
33.74
|
25.05
|
2.15
|
4.00
|
<0.1
|
<0.01
|
|
WSR33
|
20/4/2024
|
Cloudy
|
Mid-ebb
|
Moderate
|
S
|
1
|
10:35:00 AM
|
8.80
|
8.39
|
32.87
|
24.83
|
1.70
|
2.50
|
<0.1
|
<0.01
|
|
WSR33
|
20/4/2024
|
Cloudy
|
Mid-ebb
|
Moderate
|
S
|
1
|
10:35:00 AM
|
8.89
|
8.41
|
32.89
|
24.87
|
1.75
|
4.00
|
<0.1
|
<0.01
|
|
WSR33
|
20/4/2024
|
Cloudy
|
Mid-ebb
|
Moderate
|
M
|
4
|
10:36:00 AM
|
8.84
|
8.41
|
32.73
|
24.80
|
1.80
|
2.50
|
<0.1
|
<0.01
|
|
WSR33
|
20/4/2024
|
Cloudy
|
Mid-ebb
|
Moderate
|
M
|
4
|
10:36:00 AM
|
8.90
|
8.42
|
32.76
|
24.83
|
1.79
|
4.00
|
<0.1
|
<0.01
|
|
WSR33
|
20/4/2024
|
Cloudy
|
Mid-ebb
|
Moderate
|
B
|
6
|
10:37:00 AM
|
8.80
|
8.38
|
32.81
|
24.82
|
1.69
|
2.50
|
<0.1
|
<0.01
|
|
WSR33
|
20/4/2024
|
Cloudy
|
Mid-ebb
|
Moderate
|
B
|
6
|
10:37:00 AM
|
8.83
|
8.41
|
32.75
|
24.80
|
1.72
|
2.50
|
<0.1
|
<0.01
|
|
WSR36
|
20/4/2024
|
Cloudy
|
Mid-ebb
|
Moderate
|
S
|
1
|
10:20:00 AM
|
9.13
|
8.23
|
33.34
|
24.89
|
1.83
|
2.50
|
<0.1
|
<0.01
|
|
WSR36
|
20/4/2024
|
Cloudy
|
Mid-ebb
|
Moderate
|
S
|
1
|
10:20:00 AM
|
9.16
|
8.25
|
33.26
|
24.88
|
1.79
|
3.00
|
<0.1
|
<0.01
|
|
WSR36
|
20/4/2024
|
Cloudy
|
Mid-ebb
|
Moderate
|
M
|
3
|
10:21:00 AM
|
9.13
|
8.18
|
33.39
|
24.92
|
1.84
|
2.50
|
<0.1
|
<0.01
|
|
WSR36
|
20/4/2024
|
Cloudy
|
Mid-ebb
|
Moderate
|
M
|
3
|
10:21:00 AM
|
9.16
|
8.20
|
33.29
|
24.88
|
1.83
|
2.50
|
<0.1
|
<0.01
|
|
WSR36
|
20/4/2024
|
Cloudy
|
Mid-ebb
|
Moderate
|
B
|
6
|
10:21:00 AM
|
9.14
|
8.25
|
33.37
|
24.87
|
1.80
|
2.50
|
<0.1
|
<0.01
|
|
WSR36
|
20/4/2024
|
Cloudy
|
Mid-ebb
|
Moderate
|
B
|
6
|
10:21:00 AM
|
9.09
|
8.22
|
33.32
|
24.93
|
1.79
|
2.50
|
<0.1
|
<0.01
|
|
WSR37
|
20/4/2024
|
Cloudy
|
Mid-ebb
|
Moderate
|
S
|
1
|
10:14:00 AM
|
8.27
|
8.35
|
33.01
|
24.86
|
2.00
|
3.00
|
<0.1
|
<0.01
|
|
WSR37
|
20/4/2024
|
Cloudy
|
Mid-ebb
|
Moderate
|
S
|
1
|
10:14:00 AM
|
8.33
|
8.43
|
32.98
|
24.86
|
1.97
|
3.00
|
<0.1
|
<0.01
|
|
WSR37
|
20/4/2024
|
Cloudy
|
Mid-ebb
|
Moderate
|
M
|
4
|
10:15:00 AM
|
8.35
|
8.37
|
32.93
|
24.88
|
2.00
|
2.50
|
<0.1
|
<0.01
|
|
WSR37
|
20/4/2024
|
Cloudy
|
Mid-ebb
|
Moderate
|
M
|
4
|
10:15:00 AM
|
8.28
|
8.43
|
32.94
|
24.84
|
1.99
|
2.50
|
<0.1
|
<0.01
|
|
WSR37
|
20/4/2024
|
Cloudy
|
Mid-ebb
|
Moderate
|
B
|
7
|
10:16:00 AM
|
8.32
|
8.38
|
33.01
|
24.86
|
2.01
|
2.50
|
<0.1
|
<0.01
|
|
WSR37
|
20/4/2024
|
Cloudy
|
Mid-ebb
|
Moderate
|
B
|
7
|
10:16:00 AM
|
8.35
|
8.38
|
33.01
|
24.86
|
1.96
|
3.00
|
<0.1
|
<0.01
|
|
NF1
|
20/4/2024
|
Cloudy
|
Mid-ebb
|
Moderate
|
S
|
1
|
9:42:00 AM
|
8.84
|
8.15
|
33.81
|
24.72
|
1.69
|
2.50
|
<0.1
|
<0.01
|
|
NF1
|
20/4/2024
|
Cloudy
|
Mid-ebb
|
Moderate
|
S
|
1
|
9:42:00 AM
|
8.94
|
8.13
|
33.70
|
24.71
|
1.67
|
2.50
|
<0.1
|
<0.01
|
|
NF1
|
20/4/2024
|
Cloudy
|
Mid-ebb
|
Moderate
|
M
|
7
|
9:43:00 AM
|
8.81
|
8.14
|
33.76
|
24.74
|
1.58
|
2.50
|
<0.1
|
<0.01
|
|
NF1
|
20/4/2024
|
Cloudy
|
Mid-ebb
|
Moderate
|
M
|
7
|
9:43:00 AM
|
8.86
|
8.18
|
33.75
|
24.72
|
1.63
|
2.50
|
<0.1
|
<0.01
|
|
NF1
|
20/4/2024
|
Cloudy
|
Mid-ebb
|
Moderate
|
B
|
13
|
9:44:00 AM
|
8.81
|
8.15
|
33.69
|
24.72
|
1.62
|
2.50
|
<0.1
|
<0.01
|
|
NF1
|
20/4/2024
|
Cloudy
|
Mid-ebb
|
Moderate
|
B
|
13
|
9:44:00 AM
|
8.85
|
8.15
|
33.74
|
24.69
|
1.65
|
2.50
|
<0.1
|
<0.01
|
|
Location
|
Date
|
Weather
|
Tide
|
Sea Condition
|
Water Level
|
Depth (m)
|
Time
|
DO (mg/L)
|
pH
|
Sal (ppt)
|
Temp ((�XC)
|
Turbidty (NTU)
|
SS (mg/L)
|
Iron (mg/L)
|
Total Residual Chlorine (mg/L)
|
|
NF2
|
20/4/2024
|
Cloudy
|
Mid-ebb
|
Moderate
|
S
|
1
|
9:59:00 AM
|
8.86
|
8.29
|
32.82
|
24.87
|
1.82
|
2.50
|
<0.1
|
<0.01
|
|
NF2
|
20/4/2024
|
Cloudy
|
Mid-ebb
|
Moderate
|
S
|
1
|
9:59:00 AM
|
8.87
|
8.32
|
32.87
|
24.83
|
1.81
|
2.50
|
<0.1
|
<0.01
|
|
NF2
|
20/4/2024
|
Cloudy
|
Mid-ebb
|
Moderate
|
M
|
5
|
10:00:00 AM
|
8.85
|
8.32
|
32.79
|
24.86
|
1.86
|
2.50
|
<0.1
|
<0.01
|
|
NF2
|
20/4/2024
|
Cloudy
|
Mid-ebb
|
Moderate
|
M
|
5
|
10:00:00 AM
|
8.82
|
8.34
|
32.89
|
24.89
|
1.84
|
2.50
|
<0.1
|
<0.01
|
|
NF2
|
20/4/2024
|
Cloudy
|
Mid-ebb
|
Moderate
|
B
|
9
|
10:01:00 AM
|
8.86
|
8.32
|
32.88
|
24.88
|
1.90
|
2.50
|
<0.1
|
<0.01
|
|
NF2
|
20/4/2024
|
Cloudy
|
Mid-ebb
|
Moderate
|
B
|
9
|
10:01:00 AM
|
8.79
|
8.27
|
32.83
|
24.85
|
1.82
|
2.50
|
<0.1
|
<0.01
|
|
NF3
|
20/4/2024
|
Cloudy
|
Mid-ebb
|
Moderate
|
S
|
1
|
10:07:00 AM
|
7.99
|
8.35
|
33.61
|
24.87
|
2.09
|
2.50
|
<0.1
|
<0.01
|
|
NF3
|
20/4/2024
|
Cloudy
|
Mid-ebb
|
Moderate
|
S
|
1
|
10:07:00 AM
|
8.05
|
8.40
|
33.67
|
24.94
|
2.11
|
2.50
|
<0.1
|
<0.01
|
|
NF3
|
20/4/2024
|
Cloudy
|
Mid-ebb
|
Moderate
|
M
|
6
|
10:08:00 AM
|
8.02
|
8.41
|
33.74
|
24.90
|
2.15
|
2.50
|
<0.1
|
<0.01
|
|
NF3
|
20/4/2024
|
Cloudy
|
Mid-ebb
|
Moderate
|
M
|
6
|
10:08:00 AM
|
8.12
|
8.41
|
33.76
|
24.92
|
2.09
|
2.50
|
<0.1
|
<0.01
|
|
NF3
|
20/4/2024
|
Cloudy
|
Mid-ebb
|
Moderate
|
B
|
11
|
10:09:00 AM
|
8.10
|
8.42
|
33.74
|
24.90
|
2.14
|
2.50
|
<0.1
|
<0.01
|
|
NF3
|
20/4/2024
|
Cloudy
|
Mid-ebb
|
Moderate
|
B
|
11
|
10:09:00 AM
|
8.09
|
8.40
|
33.72
|
24.92
|
2.09
|
3.00
|
<0.1
|
<0.01
|
|
CE
|
23/4/2024
|
Cloudy
|
Mid-ebb
|
Moderate
|
S
|
1
|
10:16:00 AM
|
8.29
|
8.23
|
33.34
|
25.28
|
2.47
|
8.00
|
<0.1
|
<0.01
|
|
CE
|
23/4/2024
|
Cloudy
|
Mid-ebb
|
Moderate
|
S
|
1
|
10:16:00 AM
|
8.28
|
8.21
|
33.38
|
25.22
|
2.45
|
8.00
|
<0.1
|
<0.01
|
|
CE
|
23/4/2024
|
Cloudy
|
Mid-ebb
|
Moderate
|
M
|
11
|
10:17:00 AM
|
8.35
|
8.22
|
33.16
|
25.20
|
2.41
|
7.00
|
<0.1
|
<0.01
|
|
CE
|
23/4/2024
|
Cloudy
|
Mid-ebb
|
Moderate
|
M
|
11
|
10:17:00 AM
|
8.24
|
8.22
|
33.26
|
25.19
|
2.35
|
6.00
|
<0.1
|
<0.01
|
|
CE
|
23/4/2024
|
Cloudy
|
Mid-ebb
|
Moderate
|
B
|
21
|
10:18:00 AM
|
8.31
|
8.24
|
33.24
|
25.25
|
2.36
|
8.00
|
<0.1
|
<0.01
|
|
CE
|
23/4/2024
|
Cloudy
|
Mid-ebb
|
Moderate
|
B
|
21
|
10:18:00 AM
|
8.36
|
8.17
|
33.31
|
25.20
|
2.10
|
9.00
|
<0.1
|
<0.01
|
|
CF
|
23/4/2024
|
Cloudy
|
Mid-ebb
|
Moderate
|
S
|
1
|
1:21:00 PM
|
8.39
|
8.43
|
33.06
|
25.05
|
2.18
|
7.00
|
<0.1
|
<0.01
|
|
CF
|
23/4/2024
|
Cloudy
|
Mid-ebb
|
Moderate
|
S
|
1
|
1:21:00 PM
|
8.44
|
8.41
|
32.96
|
25.01
|
2.16
|
6.00
|
<0.1
|
<0.01
|
|
CF
|
23/4/2024
|
Cloudy
|
Mid-ebb
|
Moderate
|
M
|
11
|
1:22:00 PM
|
8.40
|
8.41
|
32.93
|
25.02
|
2.19
|
7.00
|
<0.1
|
<0.01
|
|
CF
|
23/4/2024
|
Cloudy
|
Mid-ebb
|
Moderate
|
M
|
11
|
1:22:00 PM
|
8.51
|
8.42
|
33.16
|
25.06
|
2.12
|
9.00
|
<0.1
|
<0.01
|
|
CF
|
23/4/2024
|
Cloudy
|
Mid-ebb
|
Moderate
|
B
|
20
|
1:23:00 PM
|
8.54
|
8.41
|
33.17
|
25.03
|
2.10
|
8.00
|
<0.1
|
<0.01
|
|
CF
|
23/4/2024
|
Cloudy
|
Mid-ebb
|
Moderate
|
B
|
20
|
1:23:00 PM
|
8.45
|
8.42
|
33.16
|
24.97
|
2.18
|
9.00
|
<0.1
|
<0.01
|
|
WSR01
|
23/4/2024
|
Cloudy
|
Mid-ebb
|
Moderate
|
S
|
1
|
12:56:00 PM
|
9.01
|
8.21
|
33.44
|
25.24
|
2.17
|
7.00
|
<0.1
|
<0.01
|
|
WSR01
|
23/4/2024
|
Cloudy
|
Mid-ebb
|
Moderate
|
S
|
1
|
12:56:00 PM
|
9.05
|
8.13
|
33.39
|
25.31
|
2.09
|
6.00
|
<0.1
|
<0.01
|
|
WSR01
|
23/4/2024
|
Cloudy
|
Mid-ebb
|
Moderate
|
M
|
5
|
12:57:00 PM
|
9.05
|
8.19
|
33.45
|
25.26
|
2.15
|
8.00
|
<0.1
|
<0.01
|
|
WSR01
|
23/4/2024
|
Cloudy
|
Mid-ebb
|
Moderate
|
M
|
5
|
12:57:00 PM
|
8.98
|
8.16
|
33.22
|
25.30
|
2.06
|
6.00
|
<0.1
|
<0.01
|
|
WSR01
|
23/4/2024
|
Cloudy
|
Mid-ebb
|
Moderate
|
B
|
8
|
12:58:00 PM
|
8.98
|
8.16
|
33.43
|
25.27
|
2.13
|
7.00
|
<0.1
|
<0.01
|
|
WSR01
|
23/4/2024
|
Cloudy
|
Mid-ebb
|
Moderate
|
B
|
8
|
12:58:00 PM
|
9.01
|
8.14
|
33.21
|
25.33
|
2.15
|
9.00
|
<0.1
|
<0.01
|
|
Location
|
Date
|
Weather
|
Tide
|
Sea Condition
|
Water Level
|
Depth (m)
|
Time
|
DO (mg/L)
|
pH
|
Sal (ppt)
|
Temp ((�XC)
|
Turbidty (NTU)
|
SS (mg/L)
|
Iron (mg/L)
|
Total Residual Chlorine (mg/L)
|
|
WSR02
|
23/4/2024
|
Cloudy
|
Mid-ebb
|
Moderate
|
S
|
1
|
12:36:00 PM
|
8.40
|
8.35
|
32.57
|
25.32
|
1.52
|
5.00
|
<0.1
|
<0.01
|
|
WSR02
|
23/4/2024
|
Cloudy
|
Mid-ebb
|
Moderate
|
S
|
1
|
12:36:00 PM
|
8.41
|
8.38
|
32.42
|
25.31
|
1.63
|
8.00
|
<0.1
|
<0.01
|
|
WSR02
|
23/4/2024
|
Cloudy
|
Mid-ebb
|
Moderate
|
M
|
5
|
12:37:00 PM
|
8.46
|
8.35
|
32.46
|
25.33
|
1.58
|
8.00
|
<0.1
|
<0.01
|
|
WSR02
|
23/4/2024
|
Cloudy
|
Mid-ebb
|
Moderate
|
M
|
5
|
12:37:00 PM
|
8.51
|
8.36
|
32.47
|
25.28
|
1.62
|
7.00
|
<0.1
|
<0.01
|
|
WSR02
|
23/4/2024
|
Cloudy
|
Mid-ebb
|
Moderate
|
B
|
9
|
12:38:00 PM
|
8.45
|
8.35
|
32.45
|
25.31
|
1.62
|
6.00
|
<0.1
|
<0.01
|
|
WSR02
|
23/4/2024
|
Cloudy
|
Mid-ebb
|
Moderate
|
B
|
9
|
12:38:00 PM
|
8.54
|
8.38
|
32.47
|
25.31
|
1.64
|
7.00
|
<0.1
|
<0.01
|
|
WSR03
|
23/4/2024
|
Cloudy
|
Mid-ebb
|
Moderate
|
S
|
1
|
12:20:00 PM
|
8.59
|
8.21
|
33.05
|
25.25
|
1.57
|
5.00
|
<0.1
|
<0.01
|
|
WSR03
|
23/4/2024
|
Cloudy
|
Mid-ebb
|
Moderate
|
S
|
1
|
12:20:00 PM
|
8.49
|
8.21
|
32.98
|
25.17
|
1.57
|
6.00
|
<0.1
|
<0.01
|
|
WSR03
|
23/4/2024
|
Cloudy
|
Mid-ebb
|
Moderate
|
M
|
4
|
12:21:00 PM
|
8.54
|
8.21
|
33.20
|
25.19
|
1.68
|
6.00
|
<0.1
|
<0.01
|
|
WSR03
|
23/4/2024
|
Cloudy
|
Mid-ebb
|
Moderate
|
M
|
4
|
12:21:00 PM
|
8.63
|
8.25
|
33.19
|
25.26
|
1.68
|
8.00
|
<0.1
|
<0.01
|
|
WSR03
|
23/4/2024
|
Cloudy
|
Mid-ebb
|
Moderate
|
B
|
7
|
12:22:00 PM
|
8.59
|
8.27
|
33.09
|
25.23
|
1.57
|
8.00
|
<0.1
|
<0.01
|
|
WSR03
|
23/4/2024
|
Cloudy
|
Mid-ebb
|
Moderate
|
B
|
7
|
12:22:00 PM
|
8.61
|
8.25
|
33.10
|
25.26
|
1.64
|
7.00
|
<0.1
|
<0.01
|
|
WSR04
|
23/4/2024
|
Cloudy
|
Mid-ebb
|
Moderate
|
S
|
1
|
12:08:00 PM
|
8.32
|
8.24
|
32.61
|
25.29
|
2.18
|
8.00
|
<0.1
|
<0.01
|
|
WSR04
|
23/4/2024
|
Cloudy
|
Mid-ebb
|
Moderate
|
S
|
1
|
12:08:00 PM
|
8.30
|
8.21
|
32.55
|
25.28
|
2.12
|
6.00
|
<0.1
|
<0.01
|
|
WSR04
|
23/4/2024
|
Cloudy
|
Mid-ebb
|
Moderate
|
M
|
4
|
12:09:00 PM
|
8.21
|
8.22
|
32.74
|
25.29
|
2.10
|
9.00
|
<0.1
|
<0.01
|
|
WSR04
|
23/4/2024
|
Cloudy
|
Mid-ebb
|
Moderate
|
M
|
4
|
12:09:00 PM
|
8.27
|
8.21
|
32.58
|
25.31
|
2.12
|
8.00
|
<0.1
|
<0.01
|
|
WSR04
|
23/4/2024
|
Cloudy
|
Mid-ebb
|
Moderate
|
B
|
7
|
12:10:00 PM
|
8.17
|
8.22
|
32.75
|
25.34
|
2.10
|
10.00
|
<0.1
|
<0.01
|
|
WSR04
|
23/4/2024
|
Cloudy
|
Mid-ebb
|
Moderate
|
B
|
7
|
12:10:00 PM
|
8.21
|
8.22
|
32.61
|
25.30
|
2.21
|
7.00
|
<0.1
|
<0.01
|
|
WSR16
|
23/4/2024
|
Cloudy
|
Mid-ebb
|
Moderate
|
S
|
1
|
10:38:00 AM
|
8.74
|
8.18
|
32.70
|
24.93
|
1.86
|
7.00
|
<0.1
|
<0.01
|
|
WSR16
|
23/4/2024
|
Cloudy
|
Mid-ebb
|
Moderate
|
S
|
1
|
10:38:00 AM
|
8.76
|
8.12
|
32.81
|
24.95
|
1.95
|
6.00
|
<0.1
|
<0.01
|
|
WSR16
|
23/4/2024
|
Cloudy
|
Mid-ebb
|
Moderate
|
M
|
8
|
10:39:00 AM
|
8.79
|
8.15
|
32.88
|
24.98
|
1.89
|
5.00
|
<0.1
|
<0.01
|
|
WSR16
|
23/4/2024
|
Cloudy
|
Mid-ebb
|
Moderate
|
M
|
8
|
10:39:00 AM
|
8.77
|
8.16
|
32.81
|
24.99
|
1.93
|
9.00
|
<0.1
|
<0.01
|
|
WSR16
|
23/4/2024
|
Cloudy
|
Mid-ebb
|
Moderate
|
B
|
14
|
10:40:00 AM
|
8.85
|
8.17
|
32.73
|
25.00
|
1.89
|
3.00
|
<0.1
|
<0.01
|
|
WSR16
|
23/4/2024
|
Cloudy
|
Mid-ebb
|
Moderate
|
B
|
14
|
10:40:00 AM
|
8.79
|
8.15
|
32.73
|
24.98
|
1.88
|
2.50
|
<0.1
|
<0.01
|
|
WSR33
|
23/4/2024
|
Cloudy
|
Mid-ebb
|
Moderate
|
S
|
1
|
11:51:00 AM
|
8.61
|
8.18
|
33.69
|
25.32
|
1.67
|
3.00
|
<0.1
|
<0.01
|
|
WSR33
|
23/4/2024
|
Cloudy
|
Mid-ebb
|
Moderate
|
S
|
1
|
11:51:00 AM
|
8.55
|
8.18
|
33.80
|
25.33
|
1.65
|
2.50
|
<0.1
|
<0.01
|
|
WSR33
|
23/4/2024
|
Cloudy
|
Mid-ebb
|
Moderate
|
M
|
4
|
11:52:00 AM
|
8.62
|
8.20
|
33.66
|
25.27
|
1.73
|
3.00
|
<0.1
|
<0.01
|
|
WSR33
|
23/4/2024
|
Cloudy
|
Mid-ebb
|
Moderate
|
M
|
4
|
11:52:00 AM
|
8.61
|
8.14
|
33.78
|
25.31
|
1.67
|
5.00
|
<0.1
|
<0.01
|
|
WSR33
|
23/4/2024
|
Cloudy
|
Mid-ebb
|
Moderate
|
B
|
6
|
11:53:00 AM
|
8.57
|
8.15
|
33.72
|
25.34
|
1.67
|
2.50
|
<0.1
|
<0.01
|
|
WSR33
|
23/4/2024
|
Cloudy
|
Mid-ebb
|
Moderate
|
B
|
6
|
11:53:00 AM
|
8.63
|
8.13
|
33.73
|
25.26
|
1.71
|
4.00
|
<0.1
|
<0.01
|
|
Location
|
Date
|
Weather
|
Tide
|
Sea Condition
|
Water Level
|
Depth (m)
|
Time
|
DO (mg/L)
|
pH
|
Sal (ppt)
|
Temp ((�XC)
|
Turbidty (NTU)
|
SS (mg/L)
|
Iron (mg/L)
|
Total Residual Chlorine (mg/L)
|
|
WSR36
|
23/4/2024
|
Cloudy
|
Mid-ebb
|
Moderate
|
S
|
1
|
11:35:00 AM
|
8.00
|
8.22
|
32.42
|
25.12
|
1.89
|
2.50
|
<0.1
|
<0.01
|
|
WSR36
|
23/4/2024
|
Cloudy
|
Mid-ebb
|
Moderate
|
S
|
1
|
11:35:00 AM
|
8.06
|
8.20
|
32.57
|
25.12
|
1.88
|
2.50
|
<0.1
|
<0.01
|
|
WSR36
|
23/4/2024
|
Cloudy
|
Mid-ebb
|
Moderate
|
M
|
4
|
11:36:00 AM
|
8.09
|
8.22
|
32.64
|
25.13
|
1.90
|
4.00
|
<0.1
|
<0.01
|
|
WSR36
|
23/4/2024
|
Cloudy
|
Mid-ebb
|
Moderate
|
M
|
4
|
11:36:00 AM
|
8.01
|
8.14
|
32.49
|
25.12
|
1.81
|
4.00
|
<0.1
|
<0.01
|
|
WSR36
|
23/4/2024
|
Cloudy
|
Mid-ebb
|
Moderate
|
B
|
6
|
11:36:00 AM
|
8.02
|
8.17
|
32.47
|
25.15
|
1.79
|
3.00
|
<0.1
|
<0.01
|
|
WSR36
|
23/4/2024
|
Cloudy
|
Mid-ebb
|
Moderate
|
B
|
6
|
11:36:00 AM
|
8.01
|
8.16
|
32.50
|
25.19
|
1.87
|
5.00
|
<0.1
|
<0.01
|
|
WSR37
|
23/4/2024
|
Cloudy
|
Mid-ebb
|
Moderate
|
S
|
1
|
11:29:00 AM
|
8.36
|
8.22
|
33.48
|
25.16
|
1.57
|
4.00
|
<0.1
|
<0.01
|
|
WSR37
|
23/4/2024
|
Cloudy
|
Mid-ebb
|
Moderate
|
S
|
1
|
11:29:00 AM
|
8.34
|
8.28
|
33.49
|
25.16
|
1.56
|
4.00
|
<0.1
|
<0.01
|
|
WSR37
|
23/4/2024
|
Cloudy
|
Mid-ebb
|
Moderate
|
M
|
4
|
11:30:00 AM
|
8.40
|
8.28
|
33.46
|
25.18
|
1.56
|
2.50
|
<0.1
|
<0.01
|
|
WSR37
|
23/4/2024
|
Cloudy
|
Mid-ebb
|
Moderate
|
M
|
4
|
11:30:00 AM
|
8.37
|
8.24
|
33.65
|
25.21
|
1.55
|
4.00
|
<0.1
|
<0.01
|
|
WSR37
|
23/4/2024
|
Cloudy
|
Mid-ebb
|
Moderate
|
B
|
7
|
11:31:00 AM
|
8.30
|
8.24
|
33.57
|
25.22
|
1.54
|
2.50
|
<0.1
|
<0.01
|
|
WSR37
|
23/4/2024
|
Cloudy
|
Mid-ebb
|
Moderate
|
B
|
7
|
11:31:00 AM
|
8.32
|
8.22
|
33.60
|
25.16
|
1.52
|
3.00
|
<0.1
|
<0.01
|
|
NF1
|
23/4/2024
|
Cloudy
|
Mid-ebb
|
Moderate
|
S
|
1
|
11:00:00 AM
|
8.50
|
8.13
|
32.76
|
25.23
|
1.65
|
6.00
|
<0.1
|
<0.01
|
|
NF1
|
23/4/2024
|
Cloudy
|
Mid-ebb
|
Moderate
|
S
|
1
|
11:00:00 AM
|
8.54
|
8.07
|
32.79
|
25.23
|
1.73
|
9.00
|
<0.1
|
<0.01
|
|
NF1
|
23/4/2024
|
Cloudy
|
Mid-ebb
|
Moderate
|
M
|
7
|
11:01:00 AM
|
8.51
|
8.09
|
32.78
|
25.23
|
1.70
|
8.00
|
<0.1
|
<0.01
|
|
NF1
|
23/4/2024
|
Cloudy
|
Mid-ebb
|
Moderate
|
M
|
7
|
11:01:00 AM
|
8.58
|
8.10
|
32.69
|
25.26
|
1.68
|
6.00
|
<0.1
|
<0.01
|
|
NF1
|
23/4/2024
|
Cloudy
|
Mid-ebb
|
Moderate
|
B
|
12
|
11:02:00 AM
|
8.54
|
8.09
|
32.59
|
25.29
|
1.75
|
9.00
|
<0.1
|
<0.01
|
|
NF1
|
23/4/2024
|
Cloudy
|
Mid-ebb
|
Moderate
|
B
|
12
|
11:02:00 AM
|
8.53
|
8.06
|
32.66
|
25.30
|
1.68
|
7.00
|
<0.1
|
<0.01
|
|
NF2
|
23/4/2024
|
Cloudy
|
Mid-ebb
|
Moderate
|
S
|
1
|
11:15:00 AM
|
8.06
|
8.15
|
33.60
|
25.24
|
2.19
|
6.00
|
<0.1
|
<0.01
|
|
NF2
|
23/4/2024
|
Cloudy
|
Mid-ebb
|
Moderate
|
S
|
1
|
11:15:00 AM
|
8.15
|
8.19
|
33.68
|
25.20
|
2.24
|
6.00
|
<0.1
|
<0.01
|
|
NF2
|
23/4/2024
|
Cloudy
|
Mid-ebb
|
Moderate
|
M
|
5
|
11:16:00 AM
|
8.10
|
8.16
|
33.65
|
25.15
|
2.15
|
5.00
|
<0.1
|
<0.01
|
|
NF2
|
23/4/2024
|
Cloudy
|
Mid-ebb
|
Moderate
|
M
|
5
|
11:16:00 AM
|
8.18
|
8.20
|
33.73
|
25.15
|
2.15
|
5.00
|
<0.1
|
<0.01
|
|
NF2
|
23/4/2024
|
Cloudy
|
Mid-ebb
|
Moderate
|
B
|
10
|
11:17:00 AM
|
8.17
|
8.20
|
33.60
|
25.15
|
2.24
|
8.00
|
<0.1
|
<0.01
|
|
NF2
|
23/4/2024
|
Cloudy
|
Mid-ebb
|
Moderate
|
B
|
10
|
11:17:00 AM
|
8.13
|
8.17
|
33.62
|
25.20
|
2.13
|
7.00
|
<0.1
|
<0.01
|
|
NF3
|
23/4/2024
|
Cloudy
|
Mid-ebb
|
Moderate
|
S
|
1
|
11:22:00 AM
|
8.43
|
8.17
|
32.21
|
25.31
|
1.51
|
9.00
|
<0.1
|
<0.01
|
|
NF3
|
23/4/2024
|
Cloudy
|
Mid-ebb
|
Moderate
|
S
|
1
|
11:22:00 AM
|
8.39
|
8.20
|
32.13
|
25.30
|
1.53
|
7.00
|
<0.1
|
<0.01
|
|
NF3
|
23/4/2024
|
Cloudy
|
Mid-ebb
|
Moderate
|
M
|
6
|
11:23:00 AM
|
8.40
|
8.18
|
32.32
|
25.33
|
1.48
|
8.00
|
<0.1
|
<0.01
|
|
NF3
|
23/4/2024
|
Cloudy
|
Mid-ebb
|
Moderate
|
M
|
6
|
11:23:00 AM
|
8.37
|
8.18
|
32.20
|
25.28
|
1.48
|
7.00
|
<0.1
|
<0.01
|
|
NF3
|
23/4/2024
|
Cloudy
|
Mid-ebb
|
Moderate
|
B
|
11
|
11:24:00 AM
|
8.38
|
8.15
|
32.20
|
25.33
|
1.46
|
8.00
|
<0.1
|
<0.01
|
|
NF3
|
23/4/2024
|
Cloudy
|
Mid-ebb
|
Moderate
|
B
|
11
|
11:24:00 AM
|
8.42
|
8.17
|
32.21
|
25.33
|
1.51
|
7.00
|
<0.1
|
<0.01
|
|
Location
|
Date
|
Weather
|
Tide
|
Sea Condition
|
Water Level
|
Depth (m)
|
Time
|
DO (mg/L)
|
pH
|
Sal (ppt)
|
Temp ((�XC)
|
Turbidty (NTU)
|
SS (mg/L)
|
Iron (mg/L)
|
Total Residual Chlorine (mg/L)
|
|
CE
|
25/4/2024
|
Cloudy
|
Mid-ebb
|
Moderate
|
S
|
1
|
11:14:00 AM
|
8.38
|
8.42
|
32.88
|
25.23
|
2.56
|
2.50
|
<0.1
|
<0.01
|
|
CE
|
25/4/2024
|
Cloudy
|
Mid-ebb
|
Moderate
|
S
|
1
|
11:14:00 AM
|
8.44
|
8.40
|
33.03
|
25.28
|
2.48
|
3.00
|
<0.1
|
<0.01
|
|
CE
|
25/4/2024
|
Cloudy
|
Mid-ebb
|
Moderate
|
M
|
12
|
11:15:00 AM
|
8.49
|
8.45
|
32.85
|
25.26
|
2.38
|
2.50
|
<0.1
|
<0.01
|
|
CE
|
25/4/2024
|
Cloudy
|
Mid-ebb
|
Moderate
|
M
|
12
|
11:15:00 AM
|
8.43
|
|
32.85
|
25.22
|
2.37
|
2.50
|
<0.1
|
<0.01
|
|
CE
|
25/4/2024
|
Cloudy
|
Mid-ebb
|
Moderate
|
B
|
22
|
11:16:00 AM
|
8.53
|
8.45
|
32.99
|
25.24
|
2.24
|
2.50
|
<0.1
|
<0.01
|
|
CE
|
25/4/2024
|
Cloudy
|
Mid-ebb
|
Moderate
|
B
|
22
|
11:16:00 AM
|
8.55
|
8.43
|
32.89
|
25.28
|
2.37
|
3.00
|
<0.1
|
<0.01
|
|
CF
|
25/4/2024
|
Cloudy
|
Mid-ebb
|
Moderate
|
S
|
1
|
2:19:00 PM
|
8.89
|
8.13
|
32.85
|
25.42
|
2.38
|
4.00
|
<0.1
|
<0.01
|
|
CF
|
25/4/2024
|
Cloudy
|
Mid-ebb
|
Moderate
|
S
|
1
|
2:19:00 PM
|
8.98
|
8.13
|
32.80
|
25.41
|
2.22
|
4.00
|
<0.1
|
<0.01
|
|
CF
|
25/4/2024
|
Cloudy
|
Mid-ebb
|
Moderate
|
M
|
10
|
2:20:00 PM
|
9.03
|
8.13
|
32.72
|
25.38
|
2.19
|
2.50
|
<0.1
|
<0.01
|
|
CF
|
25/4/2024
|
Cloudy
|
Mid-ebb
|
Moderate
|
M
|
10
|
2:20:00 PM
|
9.05
|
8.14
|
32.80
|
25.37
|
2.13
|
2.50
|
<0.1
|
<0.01
|
|
CF
|
25/4/2024
|
Cloudy
|
Mid-ebb
|
Moderate
|
B
|
19
|
2:21:00 PM
|
9.03
|
8.15
|
32.80
|
25.43
|
2.12
|
2.50
|
<0.1
|
<0.01
|
|
CF
|
25/4/2024
|
Cloudy
|
Mid-ebb
|
Moderate
|
B
|
19
|
2:21:00 PM
|
9.04
|
8.16
|
32.79
|
25.41
|
2.11
|
2.50
|
<0.1
|
<0.01
|
|
WSR01
|
25/4/2024
|
Cloudy
|
Mid-ebb
|
Moderate
|
S
|
1
|
1:55:00 PM
|
8.34
|
8.29
|
32.66
|
25.21
|
1.60
|
2.50
|
<0.1
|
<0.01
|
|
WSR01
|
25/4/2024
|
Cloudy
|
Mid-ebb
|
Moderate
|
S
|
1
|
1:55:00 PM
|
8.46
|
8.27
|
32.64
|
25.22
|
1.56
|
2.50
|
<0.1
|
<0.01
|
|
WSR01
|
25/4/2024
|
Cloudy
|
Mid-ebb
|
Moderate
|
M
|
5
|
1:56:00 PM
|
8.31
|
8.33
|
32.76
|
25.23
|
1.59
|
2.50
|
<0.1
|
<0.01
|
|
WSR01
|
25/4/2024
|
Cloudy
|
Mid-ebb
|
Moderate
|
M
|
5
|
1:56:00 PM
|
8.45
|
8.33
|
32.66
|
25.29
|
1.60
|
3.00
|
<0.1
|
<0.01
|
|
WSR01
|
25/4/2024
|
Cloudy
|
Mid-ebb
|
Moderate
|
B
|
9
|
1:57:00 PM
|
8.37
|
8.31
|
32.77
|
25.27
|
1.66
|
2.50
|
<0.1
|
<0.01
|
|
WSR01
|
25/4/2024
|
Cloudy
|
Mid-ebb
|
Moderate
|
B
|
9
|
1:57:00 PM
|
8.42
|
8.32
|
32.57
|
25.27
|
1.64
|
2.50
|
<0.1
|
<0.01
|
|
WSR02
|
25/4/2024
|
Cloudy
|
Mid-ebb
|
Moderate
|
S
|
1
|
1:36:00 PM
|
8.99
|
8.31
|
33.35
|
25.21
|
1.83
|
2.50
|
<0.1
|
<0.01
|
|
WSR02
|
25/4/2024
|
Cloudy
|
Mid-ebb
|
Moderate
|
S
|
1
|
1:36:00 PM
|
9.09
|
8.34
|
33.22
|
25.23
|
1.92
|
2.50
|
<0.1
|
<0.01
|
|
WSR02
|
25/4/2024
|
Cloudy
|
Mid-ebb
|
Moderate
|
M
|
5
|
1:37:00 PM
|
9.22
|
8.34
|
33.23
|
25.30
|
1.81
|
2.50
|
<0.1
|
<0.01
|
|
WSR02
|
25/4/2024
|
Cloudy
|
Mid-ebb
|
Moderate
|
M
|
5
|
1:37:00 PM
|
9.22
|
8.30
|
33.18
|
25.29
|
1.86
|
2.50
|
<0.1
|
<0.01
|
|
WSR02
|
25/4/2024
|
Cloudy
|
Mid-ebb
|
Moderate
|
B
|
9
|
1:38:00 PM
|
9.18
|
8.35
|
33.21
|
25.26
|
1.81
|
2.50
|
<0.1
|
<0.01
|
|
WSR02
|
25/4/2024
|
Cloudy
|
Mid-ebb
|
Moderate
|
B
|
9
|
1:38:00 PM
|
9.17
|
8.32
|
33.14
|
25.28
|
1.91
|
4.00
|
<0.1
|
<0.01
|
|
WSR03
|
25/4/2024
|
Cloudy
|
Mid-ebb
|
Moderate
|
S
|
1
|
1:18:00 PM
|
8.90
|
8.13
|
33.21
|
25.25
|
2.03
|
5.00
|
<0.1
|
<0.01
|
|
WSR03
|
25/4/2024
|
Cloudy
|
Mid-ebb
|
Moderate
|
S
|
1
|
1:18:00 PM
|
9.04
|
8.07
|
33.35
|
25.29
|
2.09
|
3.00
|
<0.1
|
<0.01
|
|
WSR03
|
25/4/2024
|
Cloudy
|
Mid-ebb
|
Moderate
|
M
|
4
|
1:19:00 PM
|
8.95
|
8.09
|
33.23
|
25.28
|
1.99
|
3.00
|
<0.1
|
<0.01
|
|
WSR03
|
25/4/2024
|
Cloudy
|
Mid-ebb
|
Moderate
|
M
|
4
|
1:19:00 PM
|
8.94
|
8.11
|
33.15
|
25.30
|
2.00
|
2.50
|
<0.1
|
<0.01
|
|
WSR03
|
25/4/2024
|
Cloudy
|
Mid-ebb
|
Moderate
|
B
|
6
|
1:20:00 PM
|
8.95
|
8.12
|
33.26
|
25.25
|
2.10
|
3.00
|
<0.1
|
<0.01
|
|
WSR03
|
25/4/2024
|
Cloudy
|
Mid-ebb
|
Moderate
|
B
|
6
|
1:20:00 PM
|
9.00
|
8.07
|
33.22
|
25.29
|
2.06
|
4.00
|
<0.1
|
<0.01
|
|
Location
|
Date
|
Weather
|
Tide
|
Sea Condition
|
Water Level
|
Depth (m)
|
Time
|
DO (mg/L)
|
pH
|
Sal (ppt)
|
Temp ((�XC)
|
Turbidty (NTU)
|
SS (mg/L)
|
Iron (mg/L)
|
Total Residual Chlorine (mg/L)
|
|
WSR04
|
25/4/2024
|
Cloudy
|
Mid-ebb
|
Moderate
|
S
|
1
|
1:05:00 PM
|
8.17
|
8.17
|
32.65
|
25.22
|
2.18
|
2.50
|
<0.1
|
<0.01
|
|
WSR04
|
25/4/2024
|
Cloudy
|
Mid-ebb
|
Moderate
|
S
|
1
|
1:05:00 PM
|
8.08
|
8.19
|
32.61
|
25.24
|
2.17
|
2.50
|
<0.1
|
<0.01
|
|
WSR04
|
25/4/2024
|
Cloudy
|
Mid-ebb
|
Moderate
|
M
|
4
|
1:06:00 PM
|
8.03
|
8.19
|
32.68
|
25.15
|
2.16
|
3.00
|
<0.1
|
<0.01
|
|
WSR04
|
25/4/2024
|
Cloudy
|
Mid-ebb
|
Moderate
|
M
|
4
|
1:06:00 PM
|
8.04
|
8.15
|
32.59
|
25.23
|
2.18
|
3.00
|
<0.1
|
<0.01
|
|
WSR04
|
25/4/2024
|
Cloudy
|
Mid-ebb
|
Moderate
|
B
|
6
|
1:07:00 PM
|
8.17
|
8.18
|
32.65
|
25.24
|
2.16
|
2.50
|
<0.1
|
<0.01
|
|
WSR04
|
25/4/2024
|
Cloudy
|
Mid-ebb
|
Moderate
|
B
|
6
|
1:07:00 PM
|
7.99
|
8.19
|
32.73
|
25.23
|
2.25
|
2.50
|
<0.1
|
<0.01
|
|
WSR16
|
25/4/2024
|
Cloudy
|
Mid-ebb
|
Moderate
|
S
|
1
|
11:36:00 AM
|
8.10
|
8.15
|
32.65
|
25.22
|
2.21
|
2.50
|
<0.1
|
<0.01
|
|
WSR16
|
25/4/2024
|
Cloudy
|
Mid-ebb
|
Moderate
|
S
|
1
|
11:36:00 AM
|
8.18
|
8.18
|
32.53
|
25.23
|
2.24
|
2.50
|
<0.1
|
<0.01
|
|
WSR16
|
25/4/2024
|
Cloudy
|
Mid-ebb
|
Moderate
|
M
|
9
|
11:37:00 AM
|
8.11
|
8.16
|
32.57
|
25.16
|
2.24
|
3.00
|
<0.1
|
<0.01
|
|
WSR16
|
25/4/2024
|
Cloudy
|
Mid-ebb
|
Moderate
|
M
|
9
|
11:37:00 AM
|
8.30
|
8.14
|
32.58
|
25.19
|
2.18
|
4.00
|
<0.1
|
<0.01
|
|
WSR16
|
25/4/2024
|
Cloudy
|
Mid-ebb
|
Moderate
|
B
|
16
|
11:38:00 AM
|
8.22
|
8.18
|
32.62
|
25.17
|
2.21
|
2.50
|
<0.1
|
<0.01
|
|
WSR16
|
25/4/2024
|
Cloudy
|
Mid-ebb
|
Moderate
|
B
|
16
|
11:38:00 AM
|
8.27
|
8.19
|
32.55
|
25.19
|
2.13
|
2.50
|
<0.1
|
<0.01
|
|
WSR33
|
25/4/2024
|
Cloudy
|
Mid-ebb
|
Moderate
|
S
|
1
|
12:48:00 PM
|
8.56
|
8.25
|
33.54
|
25.12
|
2.20
|
6.00
|
<0.1
|
<0.01
|
|
WSR33
|
25/4/2024
|
Cloudy
|
Mid-ebb
|
Moderate
|
S
|
1
|
12:48:00 PM
|
8.66
|
8.28
|
33.49
|
25.18
|
2.23
|
4.00
|
<0.1
|
<0.01
|
|
WSR33
|
25/4/2024
|
Cloudy
|
Mid-ebb
|
Moderate
|
M
|
4
|
12:49:00 PM
|
8.60
|
8.29
|
33.32
|
25.17
|
2.27
|
2.50
|
<0.1
|
<0.01
|
|
WSR33
|
25/4/2024
|
Cloudy
|
Mid-ebb
|
Moderate
|
M
|
4
|
12:49:00 PM
|
8.58
|
8.25
|
33.47
|
25.11
|
2.19
|
3.00
|
<0.1
|
<0.01
|
|
WSR33
|
25/4/2024
|
Cloudy
|
Mid-ebb
|
Moderate
|
B
|
7
|
12:50:00 PM
|
8.51
|
8.28
|
33.32
|
25.19
|
2.18
|
3.00
|
<0.1
|
<0.01
|
|
WSR33
|
25/4/2024
|
Cloudy
|
Mid-ebb
|
Moderate
|
B
|
7
|
12:50:00 PM
|
8.52
|
8.25
|
33.53
|
25.12
|
2.23
|
3.00
|
<0.1
|
<0.01
|
|
WSR36
|
25/4/2024
|
Cloudy
|
Mid-ebb
|
Moderate
|
S
|
1
|
12:34:00 PM
|
8.48
|
8.25
|
33.03
|
25.21
|
1.85
|
2.50
|
<0.1
|
<0.01
|
|
WSR36
|
25/4/2024
|
Cloudy
|
Mid-ebb
|
Moderate
|
S
|
1
|
12:34:00 PM
|
8.35
|
8.23
|
32.89
|
25.23
|
1.79
|
2.50
|
<0.1
|
<0.01
|
|
WSR36
|
25/4/2024
|
Cloudy
|
Mid-ebb
|
Moderate
|
M
|
4
|
12:35:00 PM
|
8.35
|
8.26
|
32.95
|
25.21
|
1.80
|
2.50
|
<0.1
|
<0.01
|
|
WSR36
|
25/4/2024
|
Cloudy
|
Mid-ebb
|
Moderate
|
M
|
4
|
12:35:00 PM
|
8.36
|
8.25
|
32.95
|
25.21
|
1.77
|
2.50
|
<0.1
|
<0.01
|
|
WSR36
|
25/4/2024
|
Cloudy
|
Mid-ebb
|
Moderate
|
B
|
7
|
12:35:00 PM
|
8.55
|
8.25
|
32.86
|
25.17
|
1.71
|
3.00
|
<0.1
|
<0.01
|
|
WSR36
|
25/4/2024
|
Cloudy
|
Mid-ebb
|
Moderate
|
B
|
7
|
12:35:00 PM
|
8.37
|
8.26
|
32.96
|
25.23
|
1.74
|
2.50
|
<0.1
|
<0.01
|
|
WSR37
|
25/4/2024
|
Cloudy
|
Mid-ebb
|
Moderate
|
S
|
1
|
12:28:00 PM
|
8.09
|
8.39
|
33.76
|
25.15
|
2.09
|
2.50
|
<0.1
|
<0.01
|
|
WSR37
|
25/4/2024
|
Cloudy
|
Mid-ebb
|
Moderate
|
S
|
1
|
12:28:00 PM
|
8.19
|
8.36
|
33.81
|
25.09
|
2.17
|
2.50
|
<0.1
|
<0.01
|
|
WSR37
|
25/4/2024
|
Cloudy
|
Mid-ebb
|
Moderate
|
M
|
4
|
12:29:00 PM
|
8.14
|
8.36
|
33.67
|
25.10
|
2.10
|
2.50
|
<0.1
|
<0.01
|
|
WSR37
|
25/4/2024
|
Cloudy
|
Mid-ebb
|
Moderate
|
M
|
4
|
12:29:00 PM
|
8.21
|
8.37
|
33.76
|
25.11
|
2.17
|
2.50
|
<0.1
|
<0.01
|
|
WSR37
|
25/4/2024
|
Cloudy
|
Mid-ebb
|
Moderate
|
B
|
7
|
12:30:00 PM
|
8.21
|
8.41
|
33.69
|
25.13
|
2.17
|
3.00
|
<0.1
|
<0.01
|
|
WSR37
|
25/4/2024
|
Cloudy
|
Mid-ebb
|
Moderate
|
B
|
7
|
12:30:00 PM
|
8.08
|
8.39
|
33.64
|
25.09
|
2.15
|
4.00
|
<0.1
|
<0.01
|
|
Location
|
Date
|
Weather
|
Tide
|
Sea Condition
|
Water Level
|
Depth (m)
|
Time
|
DO (mg/L)
|
pH
|
Sal (ppt)
|
Temp ((�XC)
|
Turbidty (NTU)
|
SS (mg/L)
|
Iron (mg/L)
|
Total Residual Chlorine (mg/L)
|
|
NF1
|
25/4/2024
|
Cloudy
|
Mid-ebb
|
Moderate
|
S
|
1
|
11:58:00 AM
|
8.31
|
8.23
|
33.47
|
25.16
|
1.87
|
3.00
|
<0.1
|
<0.01
|
|
NF1
|
25/4/2024
|
Cloudy
|
Mid-ebb
|
Moderate
|
S
|
1
|
11:58:00 AM
|
8.35
|
8.25
|
33.26
|
25.19
|
1.78
|
3.00
|
<0.1
|
<0.01
|
|
NF1
|
25/4/2024
|
Cloudy
|
Mid-ebb
|
Moderate
|
M
|
7
|
11:59:00 AM
|
8.36
|
8.25
|
33.38
|
25.20
|
1.76
|
2.50
|
<0.1
|
<0.01
|
|
NF1
|
25/4/2024
|
Cloudy
|
Mid-ebb
|
Moderate
|
M
|
7
|
11:59:00 AM
|
8.21
|
8.21
|
33.26
|
25.23
|
1.80
|
2.50
|
<0.1
|
<0.01
|
|
NF1
|
25/4/2024
|
Cloudy
|
Mid-ebb
|
Moderate
|
B
|
13
|
12:00:00 PM
|
8.27
|
8.21
|
33.47
|
25.17
|
1.78
|
2.50
|
<0.1
|
<0.01
|
|
NF1
|
25/4/2024
|
Cloudy
|
Mid-ebb
|
Moderate
|
B
|
13
|
12:00:00 PM
|
8.38
|
8.23
|
33.30
|
25.20
|
1.85
|
2.50
|
<0.1
|
<0.01
|
|
NF2
|
25/4/2024
|
Cloudy
|
Mid-ebb
|
Moderate
|
S
|
1
|
12:13:00 PM
|
8.29
|
8.24
|
32.58
|
25.39
|
2.05
|
3.00
|
<0.1
|
<0.01
|
|
NF2
|
25/4/2024
|
Cloudy
|
Mid-ebb
|
Moderate
|
S
|
1
|
12:13:00 PM
|
8.23
|
8.22
|
32.65
|
25.36
|
2.09
|
4.00
|
<0.1
|
<0.01
|
|
NF2
|
25/4/2024
|
Cloudy
|
Mid-ebb
|
Moderate
|
M
|
5
|
12:14:00 PM
|
8.29
|
8.25
|
32.77
|
25.40
|
2.12
|
3.00
|
<0.1
|
<0.01
|
|
NF2
|
25/4/2024
|
Cloudy
|
Mid-ebb
|
Moderate
|
M
|
5
|
12:14:00 PM
|
8.39
|
8.26
|
32.68
|
25.44
|
2.07
|
2.50
|
<0.1
|
<0.01
|
|
NF2
|
25/4/2024
|
Cloudy
|
Mid-ebb
|
Moderate
|
B
|
9
|
12:15:00 PM
|
8.35
|
8.23
|
32.73
|
25.37
|
2.04
|
2.50
|
<0.1
|
<0.01
|
|
NF2
|
25/4/2024
|
Cloudy
|
Mid-ebb
|
Moderate
|
B
|
9
|
12:15:00 PM
|
8.35
|
8.27
|
32.76
|
25.38
|
2.05
|
3.00
|
<0.1
|
<0.01
|
|
NF3
|
25/4/2024
|
Cloudy
|
Mid-ebb
|
Moderate
|
S
|
1
|
12:21:00 PM
|
8.33
|
8.23
|
32.51
|
25.34
|
1.85
|
2.50
|
<0.1
|
<0.01
|
|
NF3
|
25/4/2024
|
Cloudy
|
Mid-ebb
|
Moderate
|
S
|
1
|
12:21:00 PM
|
8.31
|
8.23
|
32.33
|
25.34
|
1.85
|
2.50
|
<0.1
|
<0.01
|
|
NF3
|
25/4/2024
|
Cloudy
|
Mid-ebb
|
Moderate
|
M
|
6
|
12:22:00 PM
|
8.26
|
8.25
|
32.49
|
25.32
|
1.87
|
3.00
|
<0.1
|
<0.01
|
|
NF3
|
25/4/2024
|
Cloudy
|
Mid-ebb
|
Moderate
|
M
|
6
|
12:22:00 PM
|
8.17
|
8.27
|
32.40
|
25.33
|
1.82
|
4.00
|
<0.1
|
<0.01
|
|
NF3
|
25/4/2024
|
Cloudy
|
Mid-ebb
|
Moderate
|
B
|
11
|
12:23:00 PM
|
8.11
|
8.27
|
32.41
|
25.30
|
1.79
|
4.00
|
<0.1
|
<0.01
|
|
NF3
|
25/4/2024
|
Cloudy
|
Mid-ebb
|
Moderate
|
B
|
11
|
12:23:00 PM
|
8.33
|
8.24
|
32.49
|
25.38
|
1.83
|
3.00
|
<0.1
|
<0.01
|
|
CE
|
27/4/2024
|
Cloudy
|
Mid-ebb
|
Moderate
|
S
|
1
|
11:51:00 AM
|
9.41
|
8.32
|
34.00
|
25.46
|
2.65
|
2.50
|
<0.1
|
<0.01
|
|
CE
|
27/4/2024
|
Cloudy
|
Mid-ebb
|
Moderate
|
S
|
1
|
11:51:00 AM
|
9.42
|
8.37
|
34.15
|
25.34
|
2.68
|
2.50
|
<0.1
|
<0.01
|
|
CE
|
27/4/2024
|
Cloudy
|
Mid-ebb
|
Moderate
|
M
|
11
|
11:52:00 AM
|
9.41
|
8.37
|
34.17
|
25.47
|
2.62
|
2.50
|
<0.1
|
<0.01
|
|
CE
|
27/4/2024
|
Cloudy
|
Mid-ebb
|
Moderate
|
M
|
11
|
11:52:00 AM
|
9.55
|
8.31
|
33.99
|
25.43
|
2.54
|
2.50
|
<0.1
|
<0.01
|
|
CE
|
27/4/2024
|
Cloudy
|
Mid-ebb
|
Moderate
|
B
|
20
|
11:53:00 AM
|
9.55
|
8.31
|
34.01
|
25.40
|
2.58
|
2.50
|
<0.1
|
<0.01
|
|
CE
|
27/4/2024
|
Cloudy
|
Mid-ebb
|
Moderate
|
B
|
20
|
11:53:00 AM
|
9.44
|
8.33
|
34.13
|
25.35
|
2.57
|
2.50
|
<0.1
|
<0.01
|
|
CF
|
27/4/2024
|
Cloudy
|
Mid-ebb
|
Moderate
|
S
|
1
|
2:55:00 PM
|
8.27
|
8.34
|
33.61
|
25.67
|
2.38
|
2.50
|
<0.1
|
<0.01
|
|
CF
|
27/4/2024
|
Cloudy
|
Mid-ebb
|
Moderate
|
S
|
1
|
2:55:00 PM
|
8.18
|
8.36
|
33.51
|
25.73
|
2.44
|
2.50
|
<0.1
|
<0.01
|
|
CF
|
27/4/2024
|
Cloudy
|
Mid-ebb
|
Moderate
|
M
|
11
|
2:56:00 PM
|
8.33
|
8.35
|
33.71
|
25.61
|
2.33
|
2.50
|
<0.1
|
<0.01
|
|
CF
|
27/4/2024
|
Cloudy
|
Mid-ebb
|
Moderate
|
M
|
11
|
2:56:00 PM
|
8.23
|
8.38
|
33.59
|
25.69
|
2.37
|
2.50
|
<0.1
|
<0.01
|
|
CF
|
27/4/2024
|
Cloudy
|
Mid-ebb
|
Moderate
|
B
|
20
|
2:57:00 PM
|
8.25
|
8.36
|
33.55
|
25.73
|
2.22
|
2.50
|
<0.1
|
<0.01
|
|
CF
|
27/4/2024
|
Cloudy
|
Mid-ebb
|
Moderate
|
B
|
20
|
2:57:00 PM
|
8.20
|
8.38
|
33.73
|
25.71
|
2.35
|
2.50
|
<0.1
|
<0.01
|
|
Location
|
Date
|
Weather
|
Tide
|
Sea Condition
|
Water Level
|
Depth (m)
|
Time
|
DO (mg/L)
|
pH
|
Sal (ppt)
|
Temp ((�XC)
|
Turbidty (NTU)
|
SS (mg/L)
|
Iron (mg/L)
|
Total Residual Chlorine (mg/L)
|
|
WSR01
|
27/4/2024
|
Cloudy
|
Mid-ebb
|
Moderate
|
S
|
1
|
2:32:00 PM
|
9.50
|
8.41
|
32.58
|
25.65
|
1.91
|
3.00
|
<0.1
|
<0.01
|
|
WSR01
|
27/4/2024
|
Cloudy
|
Mid-ebb
|
Moderate
|
S
|
1
|
2:32:00 PM
|
9.38
|
8.38
|
32.52
|
25.59
|
1.93
|
3.00
|
<0.1
|
<0.01
|
|
WSR01
|
27/4/2024
|
Cloudy
|
Mid-ebb
|
Moderate
|
M
|
5
|
2:33:00 PM
|
9.52
|
8.45
|
32.56
|
25.61
|
1.89
|
2.50
|
<0.1
|
<0.01
|
|
WSR01
|
27/4/2024
|
Cloudy
|
Mid-ebb
|
Moderate
|
M
|
5
|
2:33:00 PM
|
9.39
|
8.45
|
32.60
|
25.73
|
1.96
|
3.00
|
<0.1
|
<0.01
|
|
WSR01
|
27/4/2024
|
Cloudy
|
Mid-ebb
|
Moderate
|
B
|
8
|
2:34:00 PM
|
9.61
|
8.45
|
32.61
|
25.59
|
1.79
|
2.50
|
<0.1
|
<0.01
|
|
WSR01
|
27/4/2024
|
Cloudy
|
Mid-ebb
|
Moderate
|
B
|
8
|
2:34:00 PM
|
9.62
|
8.45
|
32.61
|
25.64
|
1.79
|
2.50
|
<0.1
|
<0.01
|
|
WSR02
|
27/4/2024
|
Cloudy
|
Mid-ebb
|
Moderate
|
S
|
1
|
2:13:00 PM
|
8.69
|
8.38
|
33.46
|
25.61
|
1.59
|
2.50
|
<0.1
|
<0.01
|
|
WSR02
|
27/4/2024
|
Cloudy
|
Mid-ebb
|
Moderate
|
S
|
1
|
2:13:00 PM
|
8.89
|
8.34
|
33.36
|
25.77
|
1.58
|
2.50
|
<0.1
|
<0.01
|
|
WSR02
|
27/4/2024
|
Cloudy
|
Mid-ebb
|
Moderate
|
M
|
5
|
2:14:00 PM
|
8.85
|
8.35
|
33.52
|
25.74
|
1.54
|
3.00
|
<0.1
|
<0.01
|
|
WSR02
|
27/4/2024
|
Cloudy
|
Mid-ebb
|
Moderate
|
M
|
5
|
2:14:00 PM
|
8.68
|
8.37
|
33.36
|
25.76
|
1.59
|
3.00
|
<0.1
|
<0.01
|
|
WSR02
|
27/4/2024
|
Cloudy
|
Mid-ebb
|
Moderate
|
B
|
8
|
2:15:00 PM
|
8.69
|
8.39
|
33.44
|
25.72
|
1.55
|
4.00
|
<0.1
|
<0.01
|
|
WSR02
|
27/4/2024
|
Cloudy
|
Mid-ebb
|
Moderate
|
B
|
8
|
2:15:00 PM
|
8.83
|
8.36
|
33.31
|
25.66
|
1.51
|
4.00
|
<0.1
|
<0.01
|
|
WSR03
|
27/4/2024
|
Cloudy
|
Mid-ebb
|
Moderate
|
S
|
1
|
1:55:00 PM
|
8.70
|
8.42
|
32.63
|
25.28
|
2.14
|
2.50
|
<0.1
|
<0.01
|
|
WSR03
|
27/4/2024
|
Cloudy
|
Mid-ebb
|
Moderate
|
S
|
1
|
1:55:00 PM
|
8.58
|
8.43
|
32.71
|
25.46
|
2.06
|
2.50
|
<0.1
|
<0.01
|
|
WSR03
|
27/4/2024
|
Cloudy
|
Mid-ebb
|
Moderate
|
M
|
4
|
1:56:00 PM
|
8.54
|
8.43
|
32.75
|
25.35
|
2.17
|
3.00
|
<0.1
|
<0.01
|
|
WSR03
|
27/4/2024
|
Cloudy
|
Mid-ebb
|
Moderate
|
M
|
4
|
1:56:00 PM
|
8.58
|
8.40
|
32.71
|
25.45
|
2.15
|
2.50
|
<0.1
|
<0.01
|
|
WSR03
|
27/4/2024
|
Cloudy
|
Mid-ebb
|
Moderate
|
B
|
7
|
1:57:00 PM
|
8.65
|
8.40
|
32.74
|
25.37
|
2.11
|
2.50
|
<0.1
|
<0.01
|
|
WSR03
|
27/4/2024
|
Cloudy
|
Mid-ebb
|
Moderate
|
B
|
7
|
1:57:00 PM
|
8.52
|
8.42
|
32.81
|
25.33
|
2.13
|
2.50
|
<0.1
|
<0.01
|
|
WSR04
|
27/4/2024
|
Cloudy
|
Mid-ebb
|
Moderate
|
S
|
1
|
1:42:00 PM
|
8.92
|
8.28
|
33.61
|
25.38
|
1.62
|
4.00
|
<0.1
|
<0.01
|
|
WSR04
|
27/4/2024
|
Cloudy
|
Mid-ebb
|
Moderate
|
S
|
1
|
1:42:00 PM
|
8.80
|
8.24
|
33.58
|
25.45
|
1.56
|
2.50
|
<0.1
|
<0.01
|
|
WSR04
|
27/4/2024
|
Cloudy
|
Mid-ebb
|
Moderate
|
M
|
4
|
1:43:00 PM
|
8.85
|
8.27
|
33.69
|
25.42
|
1.55
|
2.50
|
<0.1
|
<0.01
|
|
WSR04
|
27/4/2024
|
Cloudy
|
Mid-ebb
|
Moderate
|
M
|
4
|
1:43:00 PM
|
8.79
|
8.25
|
33.71
|
25.37
|
1.57
|
3.00
|
<0.1
|
<0.01
|
|
WSR04
|
27/4/2024
|
Cloudy
|
Mid-ebb
|
Moderate
|
B
|
6
|
1:44:00 PM
|
8.74
|
8.29
|
33.51
|
25.45
|
1.57
|
2.50
|
<0.1
|
<0.01
|
|
WSR04
|
27/4/2024
|
Cloudy
|
Mid-ebb
|
Moderate
|
B
|
6
|
1:44:00 PM
|
8.91
|
8.29
|
33.63
|
25.39
|
1.49
|
2.50
|
<0.1
|
<0.01
|
|
WSR16
|
27/4/2024
|
Cloudy
|
Mid-ebb
|
Moderate
|
S
|
1
|
12:14:00 PM
|
9.01
|
8.31
|
33.27
|
25.60
|
2.22
|
2.50
|
<0.1
|
<0.01
|
|
WSR16
|
27/4/2024
|
Cloudy
|
Mid-ebb
|
Moderate
|
S
|
1
|
12:14:00 PM
|
9.00
|
8.26
|
33.20
|
25.58
|
2.24
|
2.50
|
<0.1
|
<0.01
|
|
WSR16
|
27/4/2024
|
Cloudy
|
Mid-ebb
|
Moderate
|
M
|
9
|
12:15:00 PM
|
8.97
|
8.32
|
33.15
|
25.44
|
2.23
|
3.00
|
<0.1
|
<0.01
|
|
WSR16
|
27/4/2024
|
Cloudy
|
Mid-ebb
|
Moderate
|
M
|
9
|
12:15:00 PM
|
8.97
|
8.25
|
33.12
|
25.60
|
2.13
|
2.50
|
<0.1
|
<0.01
|
|
WSR16
|
27/4/2024
|
Cloudy
|
Mid-ebb
|
Moderate
|
B
|
16
|
12:16:00 PM
|
8.96
|
8.28
|
33.10
|
25.50
|
2.16
|
2.50
|
<0.1
|
<0.01
|
|
WSR16
|
27/4/2024
|
Cloudy
|
Mid-ebb
|
Moderate
|
B
|
16
|
12:16:00 PM
|
9.13
|
8.30
|
33.19
|
25.49
|
2.26
|
2.50
|
<0.1
|
<0.01
|
|
Location
|
Date
|
Weather
|
Tide
|
Sea Condition
|
Water Level
|
Depth (m)
|
Time
|
DO (mg/L)
|
pH
|
Sal (ppt)
|
Temp ((�XC)
|
Turbidty (NTU)
|
SS (mg/L)
|
Iron (mg/L)
|
Total Residual Chlorine (mg/L)
|
|
WSR33
|
27/4/2024
|
Cloudy
|
Mid-ebb
|
Moderate
|
S
|
1
|
1:27:00 PM
|
9.04
|
8.39
|
32.89
|
25.60
|
1.66
|
2.50
|
<0.1
|
<0.01
|
|
WSR33
|
27/4/2024
|
Cloudy
|
Mid-ebb
|
Moderate
|
S
|
1
|
1:27:00 PM
|
9.00
|
8.32
|
32.85
|
25.64
|
1.60
|
2.50
|
<0.1
|
<0.01
|
|
WSR33
|
27/4/2024
|
Cloudy
|
Mid-ebb
|
Moderate
|
M
|
4
|
1:28:00 PM
|
9.13
|
8.37
|
32.85
|
25.63
|
1.66
|
2.50
|
<0.1
|
<0.01
|
|
WSR33
|
27/4/2024
|
Cloudy
|
Mid-ebb
|
Moderate
|
M
|
4
|
1:28:00 PM
|
9.10
|
8.34
|
32.81
|
25.75
|
1.69
|
2.50
|
<0.1
|
<0.01
|
|
WSR33
|
27/4/2024
|
Cloudy
|
Mid-ebb
|
Moderate
|
B
|
7
|
1:29:00 PM
|
9.13
|
8.37
|
32.94
|
25.74
|
1.63
|
3.00
|
<0.1
|
<0.01
|
|
WSR33
|
27/4/2024
|
Cloudy
|
Mid-ebb
|
Moderate
|
B
|
7
|
1:29:00 PM
|
9.09
|
8.39
|
32.80
|
25.60
|
1.62
|
2.50
|
<0.1
|
<0.01
|
|
WSR36
|
27/4/2024
|
Cloudy
|
Mid-ebb
|
Moderate
|
S
|
1
|
1:11:00 PM
|
9.20
|
8.38
|
33.32
|
25.53
|
2.09
|
2.50
|
<0.1
|
<0.01
|
|
WSR36
|
27/4/2024
|
Cloudy
|
Mid-ebb
|
Moderate
|
S
|
1
|
1:11:00 PM
|
9.26
|
8.33
|
33.25
|
25.57
|
2.04
|
3.00
|
<0.1
|
<0.01
|
|
WSR36
|
27/4/2024
|
Cloudy
|
Mid-ebb
|
Moderate
|
M
|
4
|
1:12:00 PM
|
9.25
|
8.36
|
33.38
|
25.45
|
2.07
|
2.50
|
<0.1
|
<0.01
|
|
WSR36
|
27/4/2024
|
Cloudy
|
Mid-ebb
|
Moderate
|
M
|
4
|
1:12:00 PM
|
9.26
|
8.35
|
33.39
|
25.53
|
2.16
|
2.50
|
<0.1
|
<0.01
|
|
WSR36
|
27/4/2024
|
Cloudy
|
Mid-ebb
|
Moderate
|
B
|
7
|
1:12:00 PM
|
9.17
|
8.40
|
33.44
|
25.54
|
2.08
|
2.50
|
<0.1
|
<0.01
|
|
WSR36
|
27/4/2024
|
Cloudy
|
Mid-ebb
|
Moderate
|
B
|
7
|
1:12:00 PM
|
9.16
|
8.34
|
33.42
|
25.42
|
2.07
|
3.00
|
<0.1
|
<0.01
|
|
WSR37
|
27/4/2024
|
Cloudy
|
Mid-ebb
|
Moderate
|
S
|
1
|
1:05:00 PM
|
9.46
|
8.38
|
33.24
|
25.53
|
2.02
|
3.00
|
<0.1
|
<0.01
|
|
WSR37
|
27/4/2024
|
Cloudy
|
Mid-ebb
|
Moderate
|
S
|
1
|
1:05:00 PM
|
9.67
|
8.32
|
33.35
|
25.54
|
2.13
|
6.00
|
<0.1
|
<0.01
|
|
WSR37
|
27/4/2024
|
Cloudy
|
Mid-ebb
|
Moderate
|
M
|
4
|
1:06:00 PM
|
9.56
|
8.37
|
33.44
|
25.44
|
2.14
|
3.00
|
<0.1
|
<0.01
|
|
WSR37
|
27/4/2024
|
Cloudy
|
Mid-ebb
|
Moderate
|
M
|
4
|
1:06:00 PM
|
9.46
|
8.37
|
33.39
|
25.52
|
1.98
|
2.50
|
<0.1
|
<0.01
|
|
WSR37
|
27/4/2024
|
Cloudy
|
Mid-ebb
|
Moderate
|
B
|
8
|
1:07:00 PM
|
9.58
|
8.35
|
33.38
|
25.49
|
2.02
|
3.00
|
<0.1
|
<0.01
|
|
WSR37
|
27/4/2024
|
Cloudy
|
Mid-ebb
|
Moderate
|
B
|
8
|
1:07:00 PM
|
9.62
|
8.36
|
33.37
|
25.40
|
2.12
|
3.00
|
<0.1
|
<0.01
|
|
NF1
|
27/4/2024
|
Cloudy
|
Mid-ebb
|
Moderate
|
S
|
1
|
12:35:00 PM
|
9.34
|
8.27
|
33.33
|
25.80
|
2.11
|
3.00
|
<0.1
|
<0.01
|
|
NF1
|
27/4/2024
|
Cloudy
|
Mid-ebb
|
Moderate
|
S
|
1
|
12:35:00 PM
|
9.37
|
8.34
|
33.45
|
25.75
|
2.18
|
2.50
|
<0.1
|
<0.01
|
|
NF1
|
27/4/2024
|
Cloudy
|
Mid-ebb
|
Moderate
|
M
|
7
|
12:36:00 PM
|
9.44
|
8.32
|
33.50
|
25.76
|
2.22
|
2.50
|
<0.1
|
<0.01
|
|
NF1
|
27/4/2024
|
Cloudy
|
Mid-ebb
|
Moderate
|
M
|
7
|
12:36:00 PM
|
9.38
|
8.32
|
33.39
|
25.89
|
2.20
|
2.50
|
<0.1
|
<0.01
|
|
NF1
|
27/4/2024
|
Cloudy
|
Mid-ebb
|
Moderate
|
B
|
13
|
12:37:00 PM
|
9.33
|
8.27
|
33.36
|
25.82
|
2.19
|
2.50
|
<0.1
|
<0.01
|
|
NF1
|
27/4/2024
|
Cloudy
|
Mid-ebb
|
Moderate
|
B
|
13
|
12:37:00 PM
|
9.39
|
8.34
|
33.51
|
25.83
|
2.20
|
2.50
|
<0.1
|
<0.01
|
|
NF2
|
27/4/2024
|
Cloudy
|
Mid-ebb
|
Moderate
|
S
|
1
|
12:50:00 PM
|
9.25
|
8.12
|
33.47
|
25.58
|
2.16
|
2.50
|
<0.1
|
<0.01
|
|
NF2
|
27/4/2024
|
Cloudy
|
Mid-ebb
|
Moderate
|
S
|
1
|
12:50:00 PM
|
9.19
|
8.13
|
33.62
|
25.61
|
2.20
|
3.00
|
<0.1
|
<0.01
|
|
NF2
|
27/4/2024
|
Cloudy
|
Mid-ebb
|
Moderate
|
M
|
5
|
12:51:00 PM
|
9.06
|
8.13
|
33.42
|
25.56
|
2.09
|
2.50
|
<0.1
|
<0.01
|
|
NF2
|
27/4/2024
|
Cloudy
|
Mid-ebb
|
Moderate
|
M
|
5
|
12:51:00 PM
|
9.13
|
8.12
|
33.62
|
25.69
|
2.09
|
2.50
|
<0.1
|
<0.01
|
|
NF2
|
27/4/2024
|
Cloudy
|
Mid-ebb
|
Moderate
|
B
|
10
|
12:52:00 PM
|
9.08
|
8.11
|
33.50
|
25.61
|
2.12
|
3.00
|
<0.1
|
<0.01
|
|
NF2
|
27/4/2024
|
Cloudy
|
Mid-ebb
|
Moderate
|
B
|
10
|
12:52:00 PM
|
9.10
|
8.12
|
33.53
|
25.52
|
2.18
|
2.50
|
<0.1
|
<0.01
|
|
Location
|
Date
|
Weather
|
Tide
|
Sea Condition
|
Water Level
|
Depth (m)
|
Time
|
DO (mg/L)
|
pH
|
Sal (ppt)
|
Temp ((�XC)
|
Turbidty (NTU)
|
SS (mg/L)
|
Iron (mg/L)
|
Total Residual Chlorine (mg/L)
|
|
NF3
|
27/4/2024
|
Cloudy
|
Mid-ebb
|
Moderate
|
S
|
1
|
12:58:00 PM
|
9.51
|
8.29
|
32.63
|
25.28
|
1.80
|
2.50
|
<0.1
|
<0.01
|
|
NF3
|
27/4/2024
|
Cloudy
|
Mid-ebb
|
Moderate
|
S
|
1
|
12:58:00 PM
|
9.54
|
8.31
|
32.55
|
25.38
|
1.94
|
2.50
|
<0.1
|
<0.01
|
|
NF3
|
27/4/2024
|
Cloudy
|
Mid-ebb
|
Moderate
|
M
|
6
|
12:59:00 PM
|
9.56
|
8.28
|
32.64
|
25.31
|
1.84
|
2.50
|
<0.1
|
<0.01
|
|
NF3
|
27/4/2024
|
Cloudy
|
Mid-ebb
|
Moderate
|
M
|
6
|
12:59:00 PM
|
9.49
|
8.26
|
32.60
|
25.32
|
1.78
|
4.00
|
<0.1
|
<0.01
|
|
NF3
|
27/4/2024
|
Cloudy
|
Mid-ebb
|
Moderate
|
B
|
11
|
1:00:00 PM
|
9.35
|
8.30
|
32.59
|
25.26
|
1.89
|
4.00
|
<0.1
|
<0.01
|
|
NF3
|
27/4/2024
|
Cloudy
|
Mid-ebb
|
Moderate
|
B
|
11
|
1:00:00 PM
|
9.55
|
8.28
|
32.59
|
25.34
|
1.79
|
2.50
|
<0.1
|
<0.01
|
|
CE
|
30/4/2024
|
Cloudy
|
Mid-flood
|
Moderate
|
S
|
1
|
11:00:00 AM
|
8.75
|
8.18
|
32.89
|
25.93
|
1.84
|
2.50
|
<0.1
|
<0.01
|
|
CE
|
30/4/2024
|
Cloudy
|
Mid-flood
|
Moderate
|
S
|
1
|
11:00:00 AM
|
8.86
|
8.19
|
32.83
|
25.98
|
1.70
|
2.50
|
<0.1
|
<0.01
|
|
CE
|
30/4/2024
|
Cloudy
|
Mid-flood
|
Moderate
|
M
|
11
|
11:01:00 AM
|
8.75
|
8.19
|
32.93
|
25.96
|
1.77
|
2.50
|
<0.1
|
<0.01
|
|
CE
|
30/4/2024
|
Cloudy
|
Mid-flood
|
Moderate
|
M
|
11
|
11:01:00 AM
|
8.83
|
8.19
|
32.90
|
25.96
|
1.75
|
2.50
|
<0.1
|
<0.01
|
|
CE
|
30/4/2024
|
Cloudy
|
Mid-flood
|
Moderate
|
B
|
21
|
11:02:00 AM
|
8.74
|
8.23
|
32.91
|
25.95
|
1.70
|
2.50
|
<0.1
|
<0.01
|
|
CE
|
30/4/2024
|
Cloudy
|
Mid-flood
|
Moderate
|
B
|
21
|
11:02:00 AM
|
8.80
|
8.20
|
32.88
|
25.93
|
1.81
|
2.50
|
<0.1
|
<0.01
|
|
CF
|
30/4/2024
|
Cloudy
|
Mid-flood
|
Moderate
|
S
|
1
|
8:00:00 AM
|
8.16
|
8.36
|
32.68
|
25.98
|
2.37
|
2.50
|
<0.1
|
<0.01
|
|
CF
|
30/4/2024
|
Cloudy
|
Mid-flood
|
Moderate
|
S
|
1
|
8:00:00 AM
|
8.16
|
8.28
|
32.55
|
26.02
|
2.37
|
2.50
|
<0.1
|
<0.01
|
|
CF
|
30/4/2024
|
Cloudy
|
Mid-flood
|
Moderate
|
M
|
10
|
8:01:00 AM
|
8.25
|
8.31
|
32.53
|
26.02
|
2.36
|
2.50
|
<0.1
|
<0.01
|
|
CF
|
30/4/2024
|
Cloudy
|
Mid-flood
|
Moderate
|
M
|
10
|
8:01:00 AM
|
8.12
|
8.32
|
32.59
|
25.98
|
2.40
|
2.50
|
<0.1
|
<0.01
|
|
CF
|
30/4/2024
|
Cloudy
|
Mid-flood
|
Moderate
|
B
|
19
|
8:02:00 AM
|
8.18
|
8.29
|
32.61
|
25.98
|
2.34
|
3.00
|
<0.1
|
<0.01
|
|
CF
|
30/4/2024
|
Cloudy
|
Mid-flood
|
Moderate
|
B
|
19
|
8:02:00 AM
|
8.16
|
8.31
|
32.53
|
25.99
|
2.42
|
2.50
|
<0.1
|
<0.01
|
|
WSR01
|
30/4/2024
|
Cloudy
|
Mid-flood
|
Moderate
|
S
|
1
|
8:23:00 AM
|
9.40
|
8.28
|
31.92
|
25.87
|
1.24
|
2.50
|
<0.1
|
<0.01
|
|
WSR01
|
30/4/2024
|
Cloudy
|
Mid-flood
|
Moderate
|
S
|
1
|
8:23:00 AM
|
9.40
|
8.29
|
32.04
|
25.84
|
1.33
|
2.50
|
<0.1
|
<0.01
|
|
WSR01
|
30/4/2024
|
Cloudy
|
Mid-flood
|
Moderate
|
M
|
5
|
8:24:00 AM
|
9.49
|
8.28
|
31.88
|
25.87
|
1.32
|
3.00
|
<0.1
|
<0.01
|
|
WSR01
|
30/4/2024
|
Cloudy
|
Mid-flood
|
Moderate
|
M
|
5
|
8:24:00 AM
|
9.44
|
8.32
|
31.93
|
25.86
|
1.24
|
2.50
|
<0.1
|
<0.01
|
|
WSR01
|
30/4/2024
|
Cloudy
|
Mid-flood
|
Moderate
|
B
|
8
|
8:25:00 AM
|
9.42
|
8.26
|
31.86
|
25.82
|
1.34
|
2.50
|
<0.1
|
<0.01
|
|
WSR01
|
30/4/2024
|
Cloudy
|
Mid-flood
|
Moderate
|
B
|
8
|
8:25:00 AM
|
9.47
|
8.28
|
31.93
|
25.82
|
1.31
|
2.50
|
<0.1
|
<0.01
|
|
WSR02
|
30/4/2024
|
Cloudy
|
Mid-flood
|
Moderate
|
S
|
1
|
8:42:00 AM
|
8.77
|
8.28
|
33.39
|
25.97
|
2.34
|
2.50
|
<0.1
|
<0.01
|
|
WSR02
|
30/4/2024
|
Cloudy
|
Mid-flood
|
Moderate
|
S
|
1
|
8:42:00 AM
|
8.78
|
8.23
|
33.34
|
25.94
|
2.21
|
2.50
|
<0.1
|
<0.01
|
|
WSR02
|
30/4/2024
|
Cloudy
|
Mid-flood
|
Moderate
|
M
|
5
|
8:43:00 AM
|
8.79
|
8.25
|
33.23
|
25.98
|
2.26
|
2.50
|
<0.1
|
<0.01
|
|
WSR02
|
30/4/2024
|
Cloudy
|
Mid-flood
|
Moderate
|
M
|
5
|
8:43:00 AM
|
8.73
|
8.21
|
33.40
|
25.99
|
2.27
|
3.00
|
<0.1
|
<0.01
|
|
WSR02
|
30/4/2024
|
Cloudy
|
Mid-flood
|
Moderate
|
B
|
8
|
8:44:00 AM
|
8.74
|
8.22
|
33.33
|
26.00
|
2.34
|
2.50
|
<0.1
|
<0.01
|
|
WSR02
|
30/4/2024
|
Cloudy
|
Mid-flood
|
Moderate
|
B
|
8
|
8:44:00 AM
|
8.85
|
8.24
|
33.33
|
26.00
|
2.30
|
4.00
|
<0.1
|
<0.01
|
|
Location
|
Date
|
Weather
|
Tide
|
Sea Condition
|
Water Level
|
Depth (m)
|
Time
|
DO (mg/L)
|
pH
|
Sal (ppt)
|
Temp ((�XC)
|
Turbidty (NTU)
|
SS (mg/L)
|
Iron (mg/L)
|
Total Residual Chlorine (mg/L)
|
|
WSR03
|
30/4/2024
|
Cloudy
|
Mid-flood
|
Moderate
|
S
|
1
|
8:56:00 AM
|
8.96
|
8.23
|
32.26
|
25.77
|
1.83
|
2.50
|
<0.1
|
<0.01
|
|
WSR03
|
30/4/2024
|
Cloudy
|
Mid-flood
|
Moderate
|
S
|
1
|
8:56:00 AM
|
9.07
|
8.19
|
32.32
|
25.72
|
1.80
|
3.00
|
<0.1
|
<0.01
|
|
WSR03
|
30/4/2024
|
Cloudy
|
Mid-flood
|
Moderate
|
M
|
4
|
8:57:00 AM
|
9.04
|
8.19
|
32.32
|
25.72
|
1.78
|
2.50
|
<0.1
|
<0.01
|
|
WSR03
|
30/4/2024
|
Cloudy
|
Mid-flood
|
Moderate
|
M
|
4
|
8:57:00 AM
|
9.02
|
8.21
|
32.17
|
25.72
|
1.74
|
3.00
|
<0.1
|
<0.01
|
|
WSR03
|
30/4/2024
|
Cloudy
|
Mid-flood
|
Moderate
|
B
|
7
|
8:58:00 AM
|
9.01
|
8.21
|
32.27
|
25.73
|
1.73
|
2.50
|
<0.1
|
<0.01
|
|
WSR03
|
30/4/2024
|
Cloudy
|
Mid-flood
|
Moderate
|
B
|
7
|
8:58:00 AM
|
9.02
|
8.18
|
32.16
|
25.76
|
1.82
|
2.50
|
<0.1
|
<0.01
|
|
WSR04
|
30/4/2024
|
Cloudy
|
Mid-flood
|
Moderate
|
S
|
1
|
9:11:00 AM
|
8.98
|
8.22
|
32.74
|
26.10
|
1.95
|
3.00
|
<0.1
|
<0.01
|
|
WSR04
|
30/4/2024
|
Cloudy
|
Mid-flood
|
Moderate
|
S
|
1
|
9:11:00 AM
|
9.00
|
8.28
|
32.92
|
26.07
|
1.98
|
2.50
|
<0.1
|
<0.01
|
|
WSR04
|
30/4/2024
|
Cloudy
|
Mid-flood
|
Moderate
|
M
|
3
|
9:12:00 AM
|
8.91
|
8.27
|
32.86
|
26.04
|
2.05
|
2.50
|
<0.1
|
<0.01
|
|
WSR04
|
30/4/2024
|
Cloudy
|
Mid-flood
|
Moderate
|
M
|
3
|
9:12:00 AM
|
8.88
|
8.22
|
32.84
|
26.10
|
2.01
|
2.50
|
<0.1
|
<0.01
|
|
WSR04
|
30/4/2024
|
Cloudy
|
Mid-flood
|
Moderate
|
B
|
6
|
9:13:00 AM
|
8.89
|
8.23
|
32.82
|
26.03
|
2.01
|
2.50
|
<0.1
|
<0.01
|
|
WSR04
|
30/4/2024
|
Cloudy
|
Mid-flood
|
Moderate
|
B
|
6
|
9:13:00 AM
|
8.97
|
8.19
|
32.84
|
26.05
|
2.05
|
2.50
|
<0.1
|
<0.01
|
|
WSR16
|
30/4/2024
|
Cloudy
|
Mid-flood
|
Moderate
|
S
|
1
|
10:38:00 AM
|
8.87
|
8.18
|
32.71
|
25.93
|
1.90
|
2.50
|
<0.1
|
<0.01
|
|
WSR16
|
30/4/2024
|
Cloudy
|
Mid-flood
|
Moderate
|
S
|
1
|
10:38:00 AM
|
8.81
|
8.25
|
32.74
|
25.97
|
2.00
|
2.50
|
<0.1
|
<0.01
|
|
WSR16
|
30/4/2024
|
Cloudy
|
Mid-flood
|
Moderate
|
M
|
8
|
10:39:00 AM
|
8.92
|
8.25
|
32.69
|
25.93
|
1.96
|
3.00
|
<0.1
|
<0.01
|
|
WSR16
|
30/4/2024
|
Cloudy
|
Mid-flood
|
Moderate
|
M
|
8
|
10:39:00 AM
|
8.93
|
8.18
|
32.73
|
25.93
|
2.03
|
3.00
|
<0.1
|
<0.01
|
|
WSR16
|
30/4/2024
|
Cloudy
|
Mid-flood
|
Moderate
|
B
|
15
|
10:40:00 AM
|
8.93
|
8.19
|
32.76
|
25.98
|
1.96
|
2.50
|
<0.1
|
<0.01
|
|
WSR16
|
30/4/2024
|
Cloudy
|
Mid-flood
|
Moderate
|
B
|
15
|
10:40:00 AM
|
8.87
|
8.24
|
32.63
|
25.94
|
1.96
|
2.50
|
<0.1
|
<0.01
|
|
WSR33
|
30/4/2024
|
Cloudy
|
Mid-flood
|
Moderate
|
S
|
1
|
9:27:00 AM
|
9.40
|
8.26
|
32.36
|
25.81
|
2.06
|
2.50
|
<0.1
|
<0.01
|
|
WSR33
|
30/4/2024
|
Cloudy
|
Mid-flood
|
Moderate
|
S
|
1
|
9:27:00 AM
|
9.39
|
8.26
|
32.30
|
25.80
|
2.11
|
2.50
|
<0.1
|
<0.01
|
|
WSR33
|
30/4/2024
|
Cloudy
|
Mid-flood
|
Moderate
|
M
|
4
|
9:28:00 AM
|
9.42
|
8.30
|
32.29
|
25.82
|
2.14
|
2.50
|
<0.1
|
<0.01
|
|
WSR33
|
30/4/2024
|
Cloudy
|
Mid-flood
|
Moderate
|
M
|
4
|
9:28:00 AM
|
9.47
|
8.27
|
32.37
|
25.87
|
2.13
|
4.00
|
<0.1
|
<0.01
|
|
WSR33
|
30/4/2024
|
Cloudy
|
Mid-flood
|
Moderate
|
B
|
7
|
9:29:00 AM
|
9.35
|
8.30
|
32.36
|
25.82
|
2.14
|
2.50
|
<0.1
|
<0.01
|
|
WSR33
|
30/4/2024
|
Cloudy
|
Mid-flood
|
Moderate
|
B
|
7
|
9:29:00 AM
|
9.48
|
8.32
|
32.43
|
25.84
|
2.14
|
2.50
|
<0.1
|
<0.01
|
|
WSR36
|
30/4/2024
|
Cloudy
|
Mid-flood
|
Moderate
|
S
|
1
|
9:44:00 AM
|
8.21
|
8.24
|
33.38
|
25.99
|
1.37
|
3.00
|
<0.1
|
<0.01
|
|
WSR36
|
30/4/2024
|
Cloudy
|
Mid-flood
|
Moderate
|
S
|
1
|
9:44:00 AM
|
8.19
|
8.28
|
33.42
|
25.97
|
1.47
|
2.50
|
<0.1
|
<0.01
|
|
WSR36
|
30/4/2024
|
Cloudy
|
Mid-flood
|
Moderate
|
M
|
4
|
9:45:00 AM
|
8.22
|
8.26
|
33.49
|
26.01
|
1.36
|
2.50
|
<0.1
|
<0.01
|
|
WSR36
|
30/4/2024
|
Cloudy
|
Mid-flood
|
Moderate
|
M
|
4
|
9:45:00 AM
|
8.22
|
8.30
|
33.31
|
25.99
|
1.48
|
2.50
|
<0.1
|
<0.01
|
|
WSR36
|
30/4/2024
|
Cloudy
|
Mid-flood
|
Moderate
|
B
|
6
|
9:45:00 AM
|
8.17
|
8.25
|
33.33
|
26.02
|
1.42
|
2.50
|
<0.1
|
<0.01
|
|
WSR36
|
30/4/2024
|
Cloudy
|
Mid-flood
|
Moderate
|
B
|
6
|
9:45:00 AM
|
8.16
|
8.30
|
33.32
|
26.01
|
1.47
|
2.50
|
<0.1
|
<0.01
|
|
Location
|
Date
|
Weather
|
Tide
|
Sea Condition
|
Water Level
|
Depth (m)
|
Time
|
DO (mg/L)
|
pH
|
Sal (ppt)
|
Temp ((�XC)
|
Turbidty (NTU)
|
SS (mg/L)
|
Iron (mg/L)
|
Total Residual Chlorine (mg/L)
|
|
WSR37
|
30/4/2024
|
Cloudy
|
Mid-flood
|
Moderate
|
S
|
1
|
10:01:00 AM
|
8.81
|
8.38
|
33.21
|
25.84
|
1.95
|
2.50
|
<0.1
|
<0.01
|
|
WSR37
|
30/4/2024
|
Cloudy
|
Mid-flood
|
Moderate
|
S
|
1
|
10:01:00 AM
|
8.69
|
8.33
|
33.35
|
25.80
|
1.97
|
2.50
|
<0.1
|
<0.01
|
|
WSR37
|
30/4/2024
|
Cloudy
|
Mid-flood
|
Moderate
|
M
|
4
|
10:02:00 AM
|
8.74
|
8.35
|
33.19
|
25.78
|
1.97
|
3.00
|
<0.1
|
<0.01
|
|
WSR37
|
30/4/2024
|
Cloudy
|
Mid-flood
|
Moderate
|
M
|
4
|
10:02:00 AM
|
8.81
|
8.39
|
33.18
|
25.79
|
2.00
|
2.50
|
<0.1
|
<0.01
|
|
WSR37
|
30/4/2024
|
Cloudy
|
Mid-flood
|
Moderate
|
B
|
7
|
10:03:00 AM
|
8.74
|
8.40
|
33.22
|
25.83
|
2.04
|
3.00
|
<0.1
|
<0.01
|
|
WSR37
|
30/4/2024
|
Cloudy
|
Mid-flood
|
Moderate
|
B
|
7
|
10:03:00 AM
|
8.73
|
8.32
|
33.21
|
25.79
|
1.98
|
2.50
|
<0.1
|
<0.01
|
|
NF1
|
30/4/2024
|
Cloudy
|
Mid-flood
|
Moderate
|
S
|
1
|
10:25:00 AM
|
8.56
|
8.17
|
32.93
|
25.87
|
1.75
|
2.50
|
<0.1
|
<0.01
|
|
NF1
|
30/4/2024
|
Cloudy
|
Mid-flood
|
Moderate
|
S
|
1
|
10:25:00 AM
|
8.46
|
8.20
|
32.94
|
25.92
|
1.85
|
2.50
|
<0.1
|
<0.01
|
|
NF1
|
30/4/2024
|
Cloudy
|
Mid-flood
|
Moderate
|
M
|
7
|
10:26:00 AM
|
8.45
|
8.20
|
32.87
|
25.86
|
1.78
|
2.50
|
<0.1
|
<0.01
|
|
NF1
|
30/4/2024
|
Cloudy
|
Mid-flood
|
Moderate
|
M
|
7
|
10:26:00 AM
|
8.45
|
8.23
|
32.85
|
25.85
|
1.74
|
4.00
|
<0.1
|
<0.01
|
|
NF1
|
30/4/2024
|
Cloudy
|
Mid-flood
|
Moderate
|
B
|
12
|
10:27:00 AM
|
8.45
|
8.18
|
32.87
|
25.91
|
1.85
|
2.50
|
<0.1
|
<0.01
|
|
NF1
|
30/4/2024
|
Cloudy
|
Mid-flood
|
Moderate
|
B
|
12
|
10:27:00 AM
|
8.52
|
8.17
|
32.91
|
25.90
|
1.74
|
2.50
|
<0.1
|
<0.01
|
|
NF2
|
30/4/2024
|
Cloudy
|
Mid-flood
|
Moderate
|
S
|
1
|
10:17:00 AM
|
9.16
|
8.21
|
32.94
|
25.87
|
1.60
|
2.50
|
<0.1
|
<0.01
|
|
NF2
|
30/4/2024
|
Cloudy
|
Mid-flood
|
Moderate
|
S
|
1
|
10:17:00 AM
|
9.19
|
8.21
|
33.02
|
25.90
|
1.68
|
2.50
|
<0.1
|
<0.01
|
|
NF2
|
30/4/2024
|
Cloudy
|
Mid-flood
|
Moderate
|
M
|
5
|
10:18:00 AM
|
9.12
|
8.17
|
33.01
|
25.89
|
1.61
|
4.00
|
<0.1
|
<0.01
|
|
NF2
|
30/4/2024
|
Cloudy
|
Mid-flood
|
Moderate
|
M
|
5
|
10:18:00 AM
|
9.10
|
8.18
|
32.93
|
25.90
|
1.69
|
2.50
|
<0.1
|
<0.01
|
|
NF2
|
30/4/2024
|
Cloudy
|
Mid-flood
|
Moderate
|
B
|
9
|
10:19:00 AM
|
9.09
|
8.19
|
32.88
|
25.91
|
1.73
|
2.50
|
<0.1
|
<0.01
|
|
NF2
|
30/4/2024
|
Cloudy
|
Mid-flood
|
Moderate
|
B
|
9
|
10:19:00 AM
|
9.16
|
8.19
|
32.99
|
25.86
|
1.61
|
2.50
|
<0.1
|
<0.01
|
|
NF3
|
30/4/2024
|
Cloudy
|
Mid-flood
|
Moderate
|
S
|
1
|
10:10:00 AM
|
9.11
|
8.21
|
32.95
|
26.00
|
2.37
|
3.00
|
<0.1
|
<0.01
|
|
NF3
|
30/4/2024
|
Cloudy
|
Mid-flood
|
Moderate
|
S
|
1
|
10:10:00 AM
|
9.05
|
8.19
|
32.84
|
25.98
|
2.44
|
2.50
|
<0.1
|
<0.01
|
|
NF3
|
30/4/2024
|
Cloudy
|
Mid-flood
|
Moderate
|
M
|
6
|
10:11:00 AM
|
9.02
|
8.23
|
32.88
|
25.98
|
2.42
|
3.00
|
<0.1
|
<0.01
|
|
NF3
|
30/4/2024
|
Cloudy
|
Mid-flood
|
Moderate
|
M
|
6
|
10:11:00 AM
|
9.14
|
8.19
|
32.87
|
25.99
|
2.37
|
2.50
|
<0.1
|
<0.01
|
|
NF3
|
30/4/2024
|
Cloudy
|
Mid-flood
|
Moderate
|
B
|
11
|
10:12:00 AM
|
9.05
|
8.17
|
32.94
|
25.93
|
2.42
|
2.50
|
<0.1
|
<0.01
|
|
NF3
|
30/4/2024
|
Cloudy
|
Mid-flood
|
Moderate
|
B
|
11
|
10:12:00 AM
|
9.09
|
8.17
|
32.97
|
25.95
|
2.39
|
2.50
|
<0.1
|
<0.01
|
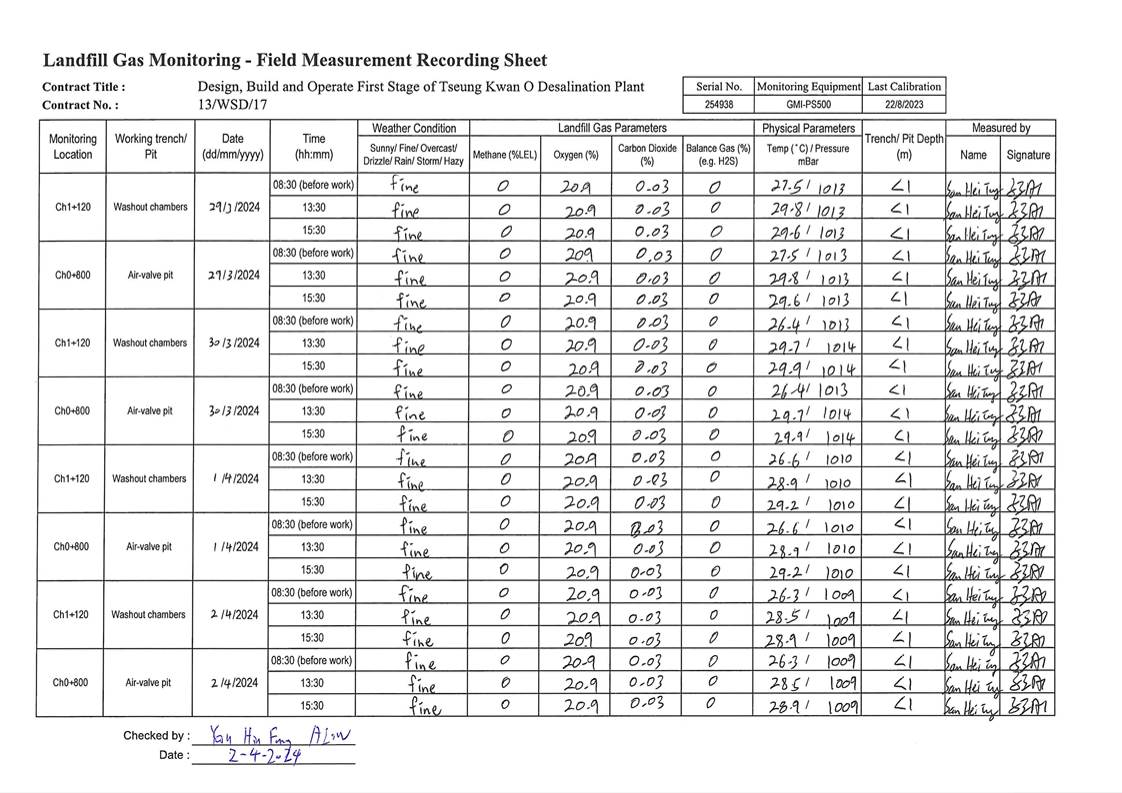
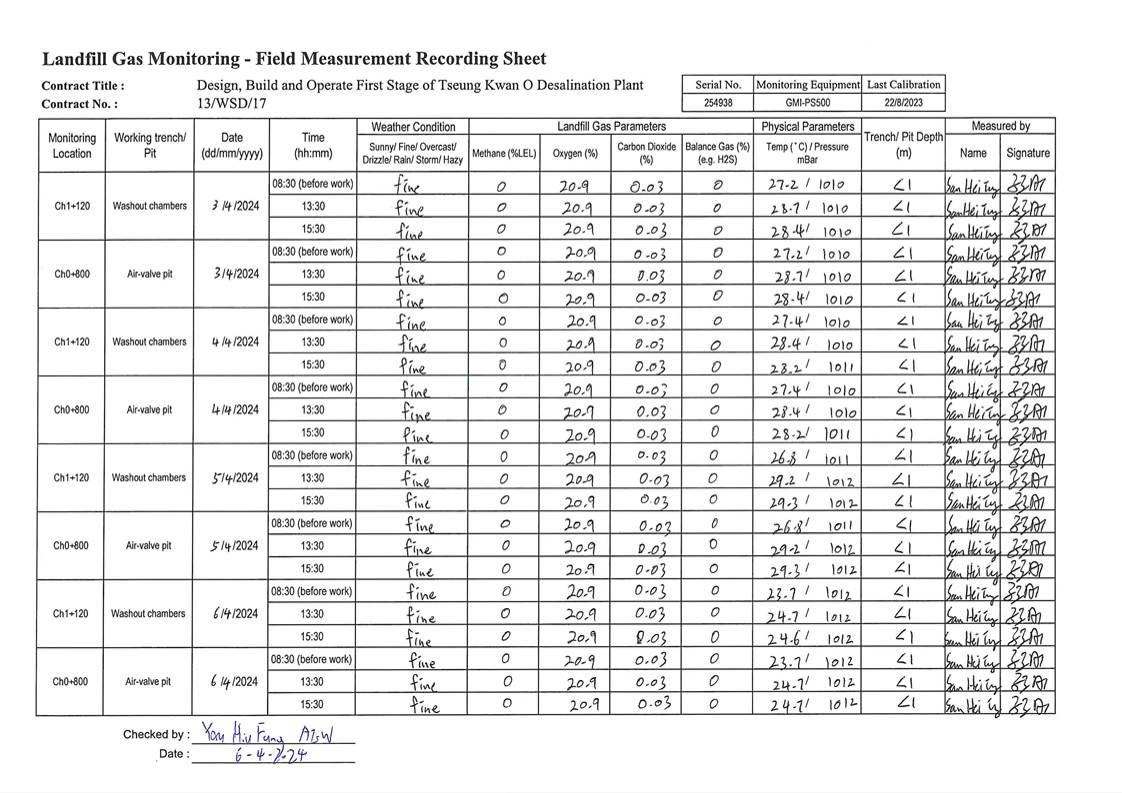

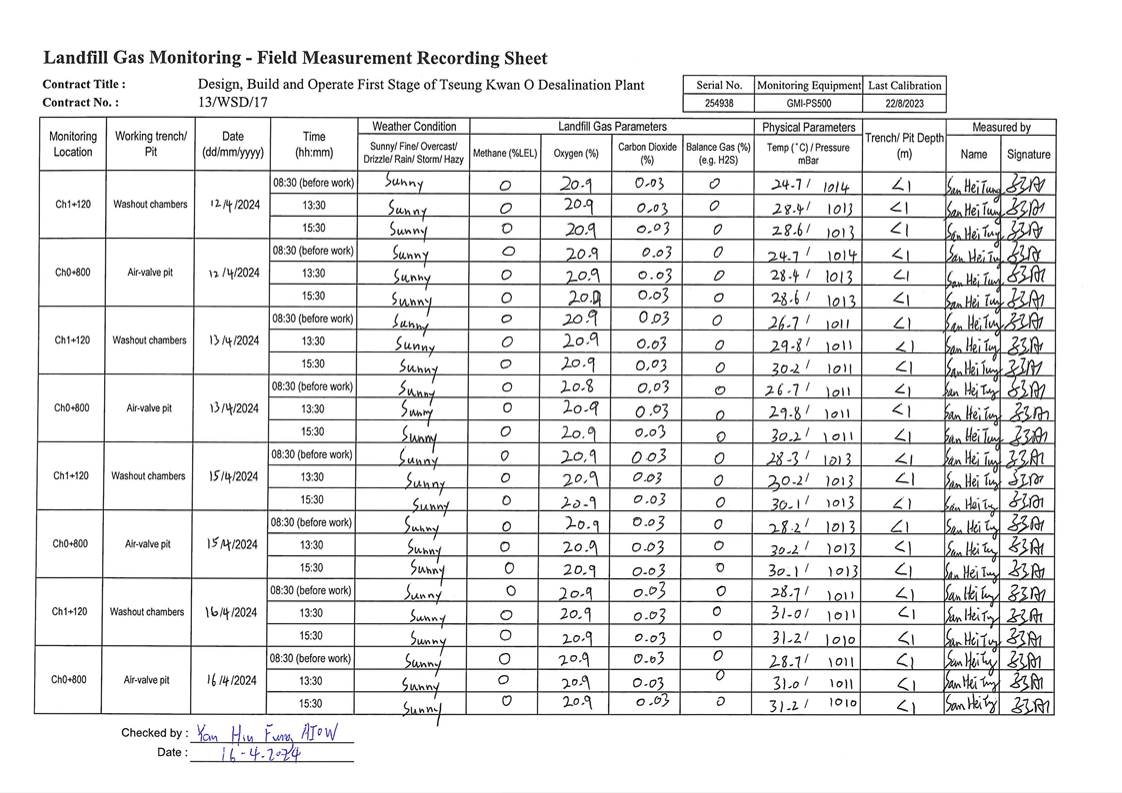
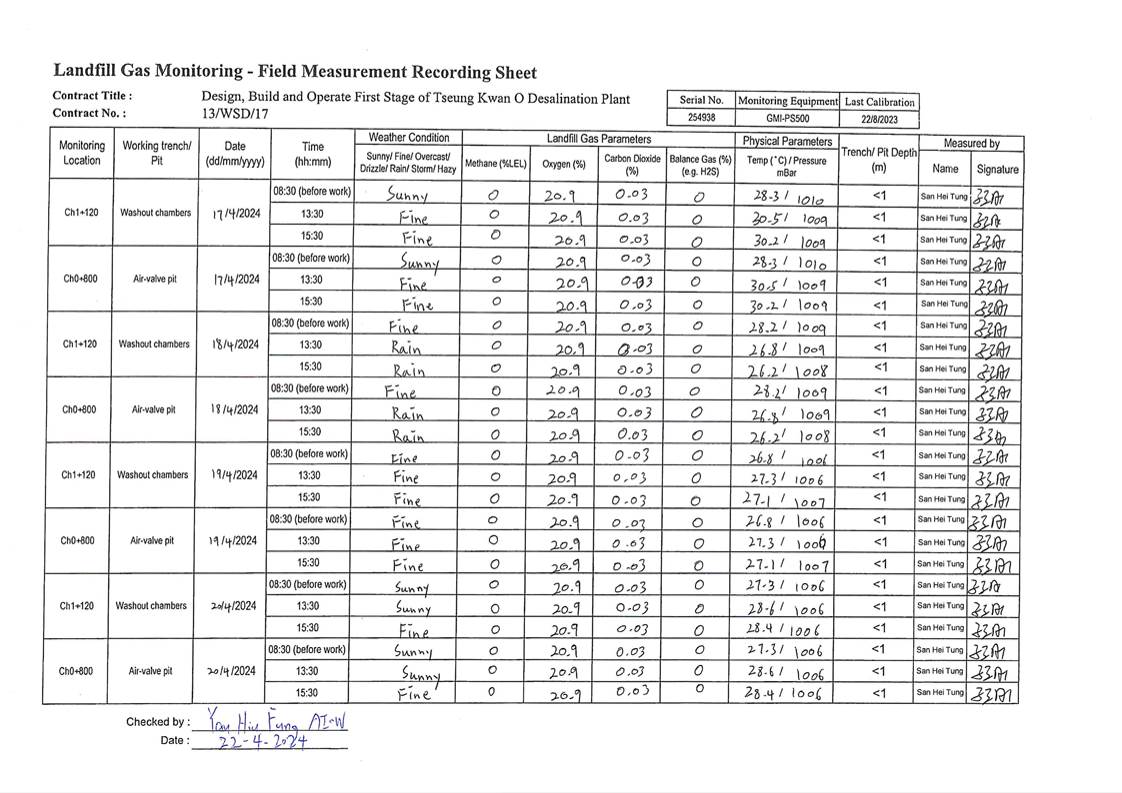
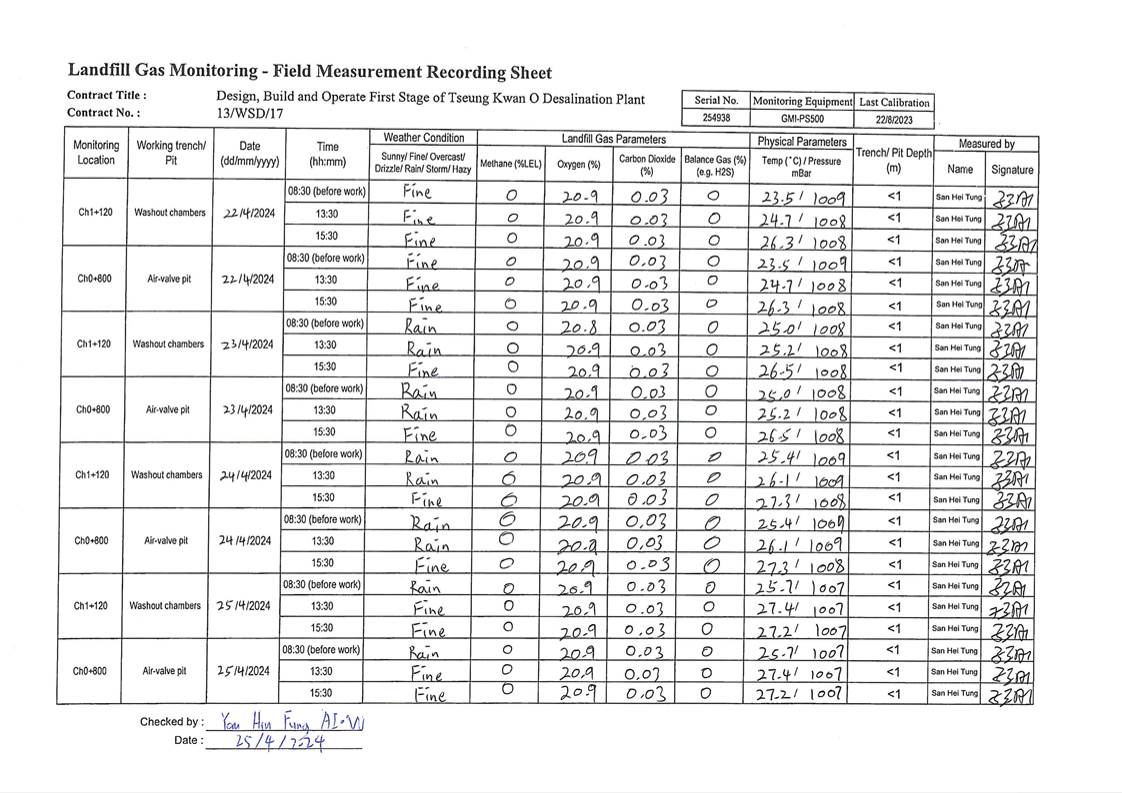
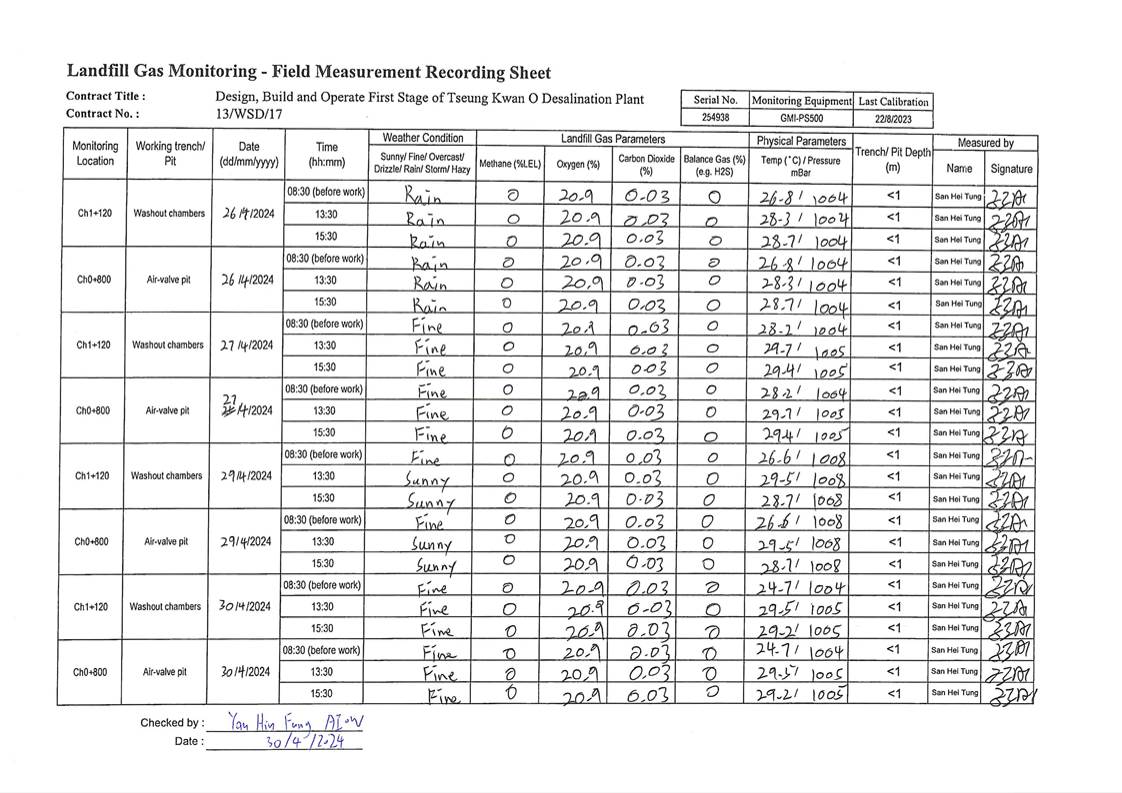
Appendix H
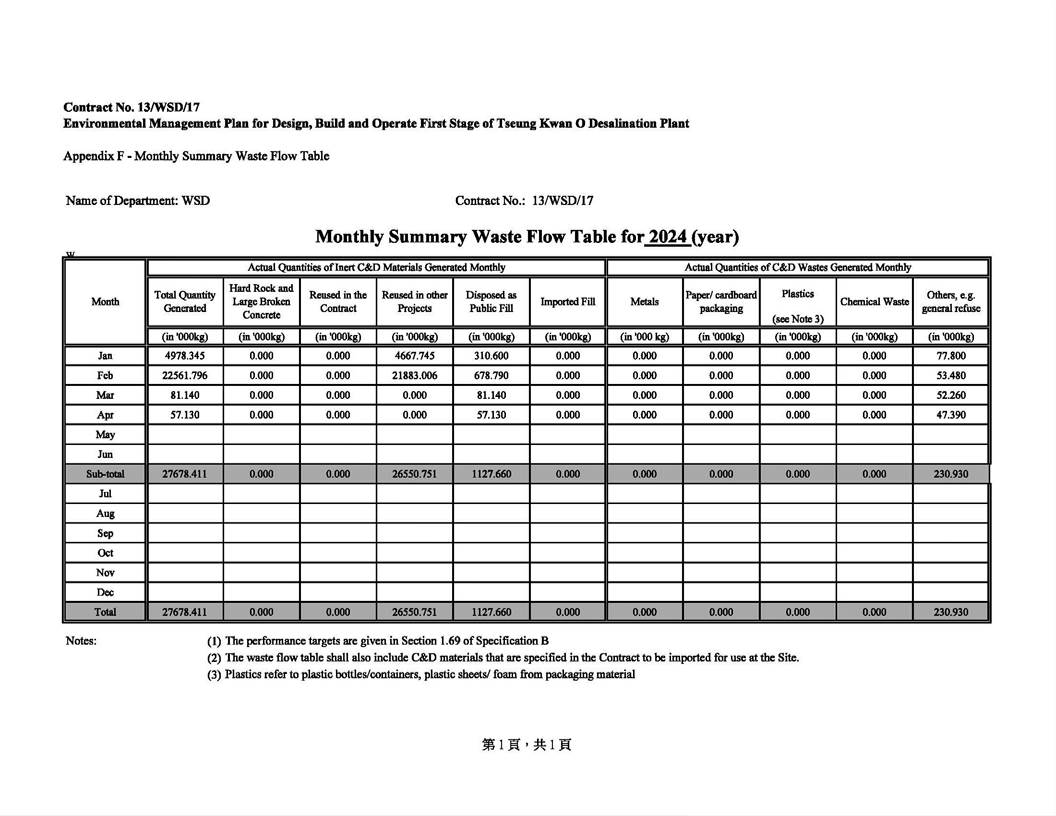
Appendix I
Ecology (Coral
& Fishery) Survey Report
Pre- Operation
Phase Coral Monitoring Report
1
INTRODUCTION
1.1
Background
1.1.1
The Project, Design, Build and Operate First
Stage of Tseung Kwan O Desalination Plant (TKODP), is a Designated Project
under the Environmental Impact Assessment Ordinance (Cap. 499) (EIAO) and is
currently governed by a Further Environmental Permit (EP No. FEP - 01/503/2015/B) for the pre-operation and operation of the Project.
1.1.2
The Jardine
Engineering Corporation, Limited, China State Construction Engineering (Hong Kong) Limited and Acciona Agua,
S.A. Trading As AJC Joint Venture (AJCJV) is contracted to carry out the Design,
Build and Operate First Stage of Tseung Kwan O
Desalination Plant (DPTKO) under Contract No. 13/WSD/17 (the Project).
1.1.3
Acuity Sustainability Consulting Limited (ASCL)
is commissioned by AJCJV to undertake the Environmental Team (ET) services as
required and/or implied, both explicitly and implicitly, in the Environmental
Permit (EP), Environmental Impact Assessment Report (EIA Report) (Register No.
AEIAR-192/2015) and Environmental Monitoring and Audit Manual (EM&A Manual)
for the Project; and to carry out the Environmental Monitoring and Audit
(EM&A) programme in fulfillment of the EIA Report��s EM&A requirements and Contract No. 13/WSD/17 Specification requirements.
1.1.4
The proposed
Desalination Plant at Tseung Kwan O (DPTKO) will produce potable water with an
initial capacity of 135 million litres per day (MLD), expandable to an ultimate
capacity of 270 MLD in the future to provide a secure and alternative fresh
water resource complying with the World Health Organization (WHO) standards.
The plant will adopt the Seawater Reverse Osmosis (SWRO) technology, which
dominates the market due to its reliability and progressive reduction in cost
as the technology advances.
1.1.5
A baseline coral
survey was conducted in 13 October 2023 to verify the validity of the
pervious EIA findings as well as to provide updated coral data for impact
monitoring during the pre-operation and operational phases. Two indirect impact
sites and one control site were identified during the baseline coral survey for
impact monitoring.
2
Methodology
2.1 All tagged coral colonies in C2, C3 and C8 will
be monitored monthly
during the first-year operation of TKODP. The
monitoring team will record the following parameters (using the same methodology adopted during the pre-construction phase
survey): size, presence, survival, health conditions (percentage of
mortality) and percentage of sediment of each tagged coral colonies. The
general environmental conditions during the survey date will also be monitored.
2.2 Photographic records of the tagged coral
colonies will be taken as far as possible maintaining the same aspect
and orientation as photographs taken for the pre-translocation
surveys. All the tags for marking
coral colonies will be removed / retrieved once the monitoring programme is
completed.
2.3 The results of the pre-operation phase
monitoring surveys should be reviewed with reference to findings of the
baseline survey.
2.4 If, during the pre-operation monitoring,
observations of any die-off / abnormal conditions of the tagged corals are
made, the ET will inform the Contractor, Independent Environmental Checker
(IEC)/ Environmental Project Office (ENPO), Agriculture, Fisheries and Conservation Department (AFCD) and in liaison with AFCD investigate any measures needed.
2.5 Monitoring result will be reviewed and be
compared against the Action Level and Limit Level (AL/LL) as set out in Table 2-1. Actions specified
on Table 2-2 will be taken by ET,
IEC, SOR and Contractor shall there be exceedance of AL/LL
Table
2-1 Action and Limit Levels
for Pre-Operation Coral Monitoring
|
Parameter
|
Action Level
Definition
|
Limit Level Definition
|
|
Mortality
|
If during
Impact Monitoring a 15% increase in the percentage of partial mortality on the corals occurs at
more than 20% of the tagged indirect impact site coral colonies that is not
recorded on the tagged corals
at the control
site,
then the Action
Level is exceeded
|
If during
Impact Monitoring a 25% increase in the percentage of partial mortality on the corals occurs at
more than 20% of the tagged indirect impact site coral colonies that is not
recorded on the tagged corals
at the control
site,
then the Limit Level is exceeded
|
Note: If the
defined Action Level or Limit Level for
coral monitoring is exceeded, the actions as set out in Table 5-4 will be implemented.
Table 2-2 Event and Action
Plan for Pre-Operation Monitoring
|
Event
|
Action
|
|
ET Leader
|
IEC
|
SOR
|
Contractor
|
|
Action Level Exceedance
|
1.
Check monitoring data
2.
Inform the IEC, SOR and
Contractor of the findings;
3.
Increase the monitoring to at least once a month
to confirm findings;
4.
Propose mitigation measures for
consideration
|
1.
Discuss monitoring with the ET and the
Contractor;
2.
Review proposals for additional monitoring and any
other measures submitted by the Contractor and advise the SOR accordingly.
|
1.
Discuss with the
IEC additional monitoring requirements and any other
measures proposed by the ET;
2.
Make agreement on the
measures to be implemented.
|
1.
Inform the SOR and confirm notification of the
non-compliance in writing;
2.
Discuss with the
ET and the IEC and propose measures to the IEC and the
SOR;
3.
Implement the
agreed measures.
|
Remark: ** The ��SOR�� is equivalent to the ��ER�� as defined
in the EM&A Manual of the Project
3. Result
3.1 3.1 The April 2024 pre-operation phase monitoring were performed
on 17th April 2024 for both
Indirect Impact Sites and Control
Site (Figure 3 and 4); and
the weather conditions were summarized in Table 3.1.
Table
3.1 Weather Condition for the April 2024 Pre-Operation Monitoring
|
Date
|
Condition
|
Average Underwater Visibility
|
|
17th April 2024
|
-
Southeast force 5,
-
Cloudy
|
Less
than 0.5 to 1 m
|
3.2 Ten (10) hard
coral colonies in C2, C3 and C8 were monitored at each site of Control and Indirect Impact sites as
suggested in the Operation Phase Monitoring Plan. The general health conditions (size,
mortality, bleaching and sediment) were recorded and summarized
in Table 3.2, Table 3.3 and Table 3.4 Photos
of each tagged coral colonies were taken during the monitoring activities and
shown in Appendix A (Photo Plate A, B and C)..
3.3 All tagged
coral colonies showed good health condition during the April 2024 Monitoring
survey. There was not increased
level of mortality, bleaching and sediment
in other tagged coral colonies when compared with
the baseline results.
Table 3.2 Sizes, Condition, Mortality, Bleaching and Sediment
of 10 Natural Coral Colonies
at Control Site C8 during April 2024 Coral Monitoring Survey
|
Tag #
|
Species
|
Size (cm) - Max.
Diameter
|
Condition
|
Mortality (%)
|
Bleaching (%)
|
Sediment (%)
|
|
|
|
|
|
Baseline
|
17-Apr
|
Baseline
|
17-Apr
|
Baseline
|
17-Apr
|
|
1
|
Favites pentagona
|
66
|
Good
|
0
|
0
|
0
|
0
|
0
|
0
|
|
2
|
Porites lutea
|
58
|
Good
|
0
|
0
|
0
|
0
|
0
|
0
|
|
3
|
Plesiastrea versipora
|
31
|
Good
|
0
|
0
|
0
|
0
|
0
|
0
|
|
4
|
Platygyra carnosus
|
30
|
Good
|
0
|
0
|
0
|
0
|
0
|
0
|
|
5
|
Acropora solitaryensis
|
32
|
Good
|
0
|
0
|
0
|
0
|
0
|
0
|
|
6
|
Plesiastrea versipora
|
27
|
Good
|
0
|
0
|
0
|
0
|
0
|
0
|
|
7
|
Porites lutea
|
39
|
Good
|
0
|
0
|
0
|
0
|
0
|
0
|
|
8
|
Favites pentagona
|
20
|
Good
|
0
|
0
|
0
|
0
|
0
|
0
|
|
9
|
Platygyra carnosus
|
26
|
Good
|
0
|
0
|
0
|
0
|
0
|
0
|
|
10
|
Acropora solitaryensis
|
28
|
Good
|
0
|
0
|
0
|
0
|
0
|
0
|
Table 3.3 Sizes, Condition, Mortality, Bleaching and Sediment of 10 Natural
Coral Colonies at Indirect Impact Site C2 during April 2024 Coral
Monitoring Survey
|
Tag #
|
Species
|
Size (cm)
- Max. Diameter
|
Condition
|
Mortality (%)
|
Bleaching (%)
|
Sediment (%)
|
|
|
|
|
|
Baseline
|
17-Apr
|
Baseline
|
17-Apr
|
Baseline
|
17-Apr
|
|
1
|
Porites lutea
|
21
|
Good
|
0
|
0
|
0
|
0
|
0
|
0
|
|
2
|
Favites abdita
|
43
|
Good
|
0
|
0
|
0
|
0
|
0
|
0
|
|
3
|
Duncanopsammia peltata
|
45
|
Good
|
0
|
0
|
0
|
0
|
0
|
0
|
|
4
|
Dipsastraea veroni
|
20
|
Good
|
0
|
0
|
0
|
0
|
0
|
0
|
|
5
|
Favites pentagona
|
19
|
Good
|
0
|
0
|
0
|
0
|
0
|
0
|
|
6
|
Plesiastrea versipora
|
21
|
Good
|
0
|
0
|
0
|
0
|
0
|
0
|
|
7
|
Dipsastraea rotumana
|
21
|
Good
|
0
|
0
|
0
|
0
|
0
|
0
|
|
8
|
Dipsastraea speciosa
|
20
|
Good
|
0
|
0
|
0
|
0
|
0
|
0
|
|
9
|
Porites lutea
|
37
|
Good
|
0
|
0
|
0
|
0
|
0
|
0
|
|
10
|
Porites lutea
|
38
|
Good
|
0
|
0
|
0
|
0
|
0
|
0
|
Table 3.4 Sizes, Condition, Mortality, Bleaching and Sediment of 10 Natural
Coral Colonies at Indirect Impact Site C3 during April 2024 Coral
Monitoring Survey
|
Tag #
|
Species
|
Size (cm) - Max.
Diameter
|
Condition
|
Mortality (%)
|
Bleaching (%)
|
Sediment (%)
|
|
|
|
|
|
Baseline
|
17-Apr
|
Baseline
|
17-Apr
|
Baseline
|
17-Apr
|
|
11
|
Acropora solitaryensis
|
37
|
Good
|
0
|
0
|
0
|
0
|
0
|
0
|
|
12
|
Platygyra carnosa
|
30
|
Good
|
0
|
0
|
0
|
0
|
0
|
0
|
|
13
|
Favites pentagona
|
33
|
Good
|
0
|
0
|
0
|
0
|
0
|
0
|
|
14
|
Platygyra carnosa
|
22
|
Good
|
0
|
0
|
0
|
0
|
0
|
0
|
|
15
|
Dipsastraea veroni
|
20
|
Fair
|
0
|
0
|
0
|
0
|
0
|
0
|
|
16#
|
Favites
flexuosa
|
20
|
Good
|
0
|
0
|
0
|
0
|
0
|
0
|
|
17
|
Favites chinensis
|
51
|
Good
|
0
|
0
|
0
|
0
|
0
|
0
|
|
18
|
Plesiastrea versipora
|
22
|
Good
|
0
|
0
|
0
|
0
|
0
|
0
|
|
|
19
|
Duncanopsammia peltata
|
29
|
Good
|
0
|
0
|
0
|
0
|
0
|
0
|
|
20
|
Platygyra carnosus
|
23
|
Good
|
0
|
0
|
0
|
0
|
0
|
0
|
#newly
tagged coral colony
4.
Discussion and Conclusion
4.1
The April 2024
coral monitoring survey were carried out in the indirect impact area (C2 and
C3) and control site (C8) on 17th April 2024. A total of 30 tagged coral colonies (10 at
control site and 20 and two indirect impact sites) were monitored. All coral colonies
were good in general.
4.2
No sediment,
bleaching or increased mortality in the general condition of all other tagged
coral colonies were observed during
the monthly pre operation phase monitoring period. No deterioration
of the coral community was observed
in the ecological monitoring results
when compared with the baseline
ecological monitoring results.
There is no AL/LL exceedance during the monitoring period. Photos of each tagged corals colonies were taken and
shown in Appendix A (Photo Plates A, B and C).
Figure 1 Two Proposed Indirect
Impact Sites (C2 and C3) during Pre-Operation Phase
Figure 2 Proposed
Control Site (C8) during Pre-Operation Phase
APPENDIX A TAGGED CORAL
PHOTO
Photo Plate A Tagged
Corals at Control Site C8
|
Tag #
|
17th April 2024
|
|
#1
|
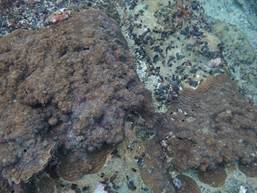
|
|
 #2 #2
|
|
|
#3
|
|
|
#4
|
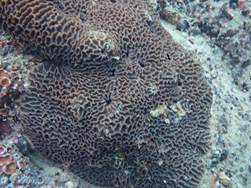
|
|
 #5 #5
|
|
|
#6
|
|
|
#7
|
|
|
#8
|
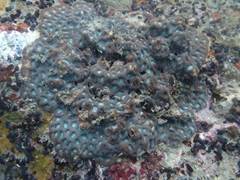
|
|
 #9 #9
|
|
|
#10
|
|
Photo
Plate B Tagged
Corals at Indirect
Impact Site C2
|
Tag #
|
 17th April
2024 17th April
2024
|
|
#1
|
|
|
#2
|
|
|
#3
|
|
|
#4
|
|
|
#5
|
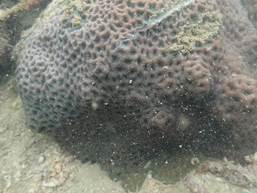
|
|
 #6 #6
|
|
|
#7
|
|
|
#8
|
|
|
#9
|
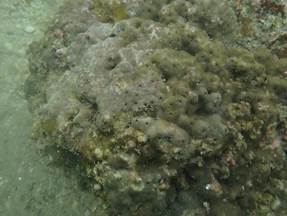
|
|
#10
|
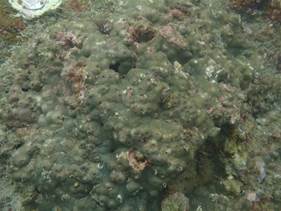
|
Photo Plate C Tagged
Corals at Indirect Impact Site C3
|
Tag #
|
 17th April
2024 17th April
2024
|
|
#11
|
|
|
#12
|
|
|
#13
|
|
|
#14
|
|
|
 #19 #19
|
|
|
#20
|
|
Pre- Operation Phase Fishery Monitoring Report
1
Introduction
1.1
Background
1.1.1
Water Supplies
Department (WSD) appointed Black & Veatch Hong Kong Limited (B&V) to
undertake the consultancy ��Agreement No. CE 8/2015 (WS) First Stage of
Desalination Plant at Tseung Kwan O �V Investigation, Design, and Construction��
on 16 November 2015. The purpose
of the Project is to construct a sea water reverse osmosis
(SWRO) desalination plant at Tseung Kwan O (TKO) Area 137,
together with all ancillary facilities and the slope mitigation works in the
adjoining Clear Water Bay Country Park.
1.1.2
The purpose of the
Project is to construct a sea water reverse osmosis (SWRO) desalination plant
at Tseung Kwan O (TKO) Area 137, together with all ancillary facilities and the
slope mitigation works in the adjoining Clear Water Bay Country Park.
1.1.3
The first stage of
the proposed SWRO desalination plant will have a water production capacity of
135,000 cubic meters (m3) per day with provision for future expansion to the
ultimate capacity up to 270,000 m3 per day when necessary.
1.1.4
The Project is
classified as a Designated Project (DP) under the Environmental Impact
Assessment Ordinance (EIAO). An Environmental Impact Assessment (EIA) was
completed in accordance with the EIAO under the Feasibility Study (FS) stage of
the Project. The EIA Report for the Project (Register No.: AEIAR-192/2015) was
approved with conditions on 4 November 2015 under the EIAO. Following the
approval of the EIA Report, the Environmental Permit (EP) (No: EP- 503/2015),
covering the construction and operation of Project, was granted on 4 December
2015. The EP for this Project was subsequently amended and the amended EP (No.
EP-503/2015/B) was granted on 3 April 2024 under the EIAO. Baseline fisheries
monitoring was conduction in September 2018 to February 2019
1.2
Purpose of this Report
1.2.1
An Environmental
Monitoring and Audit (EM&A) programme of regular fisheries monitoring is
recommended under the approval conditions of the EIA Report for the Project.
The purpose of the EM&A programme is to monitor the fisheries impact of the
Project. Pursuant to these EIA approval conditions, details of the regular
fisheries monitoring programme shall be submitted to the Director of
Environmental Protection (DEP) for prior approval.
1.2.2
The regular
fisheries monitoring programme including the methodologies for carrying out
adult fish survey, juvenile fish survey, ichthyoplankton survey and
supplementary water quality monitoring during the pre-construction (or baseline
period), construction, pre-operation and operational stages of the Project are
presented in the ?�Final Methodology Paper on Regular Fisheries Monitoring??issued by
B&V on 31 August 2018. The dry season of the pre-operation phase of TKODP
were subsequently carried out in 17th and 24th February 2024. This Report is
prepared to present the progress of the regular pre-operation phase fisheries
monitoring.
2
Summary of EIA Findings and Updated Fisheries Survey
2.1.1
This Project
comprises submarine utilities including a seawater intake and a submarine
outfall in Joss House Bay. The approved EIA Report predicted that the potential
impacts on fisheries resources would be confined within close proximity of
these submarine utilities. No important fish spawning and nursery grounds were
identified near the proposed submarine utilities with reference to the findings
of literature review undertaken during the EIA stage. The EIA Report concluded
that no significant fisheries impact would arise from construction and
operation of the proposed submarine utilities.
2.1.2
In accordance with
Condition 2.9 of the EP, an Updated Fisheries Survey was carried out in 2015 to
2016 to verify if any significant fish spawning and nursery grounds in the
vicinity of the proposed submarine utilities. The Updated Fisheries Survey
revealed no important fish spawning and nursery grounds near the proposed
submarine utilities and affirmed the conclusion made in the approved EIA
Report. The results of the Updated Fisheries Survey are presented in the ?�Consultancy Services for Updated Fisheries Survey for Tseung Kwan O
Desalination Plant Final Report??issued by ERM on 6 June 2017.
3
Monitoring Methodology
3.1
Monitoring Parameters and Programme
 The
purpose of this baseline fisheries monitoring programme is to update the
information onfisheries resources in Joss House Bay and nearby water before
commencement of the Project construction.
Under the baseline monitoring programme, survey on adult fish, juvenile fish and ichtyoplankton were carried out 2 times in wet season and 2 times in dry season to examine the following:
The
purpose of this baseline fisheries monitoring programme is to update the
information onfisheries resources in Joss House Bay and nearby water before
commencement of the Project construction.
Under the baseline monitoring programme, survey on adult fish, juvenile fish and ichtyoplankton were carried out 2 times in wet season and 2 times in dry season to examine the following:
- Fish species composition;
- Abundance: number of fish captured;
- Diversity of fish resources: species diversity and evenness;
- Size: range of total length;
- Biomass in weight; and
- Values of catches
of commercial species:
catch per unit effort (CPUE)
and yield per unit
effort (YPUE).
3.1.2 A
summary of the baseline fisheries monitoring programme is provided in table
below.
Table 3-1: Pre-Operation Phase Fisheries Monitoring Programme
|
Monitoring
|
Method
|
Pre-Operation Phase Fisheries Monitoring Dates
|
|
Dry Season
|
|
Event
1
|
Event 2
|
|
Adult Fish
Survey
|
Gill Netting and Cage Trapping
|
17 February 2024
|
24 February 2024
|
|
Juvenile Fish
Survey
|
Purse-seining
|
17 February 2024
|
24 February 2024
|
|
Ichtyoplankton Survey
|
PlanktonTowing
|
17 February 2024
|
24 February 2024
|
3.2
Fisheries Resource Sampling Locations
 Six
(6) fisheries sampling locations were set up in Joss House Bay and its vicinity
to monitor the baseline fisheries resources.
Six
(6) fisheries sampling locations were set up in Joss House Bay and its vicinity
to monitor the baseline fisheries resources.
 Two
(2) sampling locations were set up in the Impact Area (IPA) in close proximity
of the direct footprint of the proposed
submarine utilities around
TKO Area 137.
Two
(2) sampling locations were set up in the Impact Area (IPA) in close proximity
of the direct footprint of the proposed
submarine utilities around
TKO Area 137.
 Two (2) sampling locations
were set up in the Gradient Area (GDA) between
the proposed submarine utilities and Tung Lung Chau Fish
Culture Zone (FCZ).
Two (2) sampling locations
were set up in the Gradient Area (GDA) between
the proposed submarine utilities and Tung Lung Chau Fish
Culture Zone (FCZ).
 Two
(2) reference locations were set up in the Control Area (CLA) in outer Joss
House Bay between the waters of Tung Lung Chau and
Fat Tong Mun. These reference locations are further away from the Project discharge
(based on the EIA prediction) and will serve as control stations.
Two
(2) reference locations were set up in the Control Area (CLA) in outer Joss
House Bay between the waters of Tung Lung Chau and
Fat Tong Mun. These reference locations are further away from the Project discharge
(based on the EIA prediction) and will serve as control stations.
3.2.5 The
baseline fisheries resource sampling locations are summarized in Table 3-2 and shown in Figure 3.1.
Table 3-2: Baseline Fisheries Resource Sampling Locations
|
Monitoring
|
Sampling Location or Transect ID (see Figure 2.1)
|
|
Impact Area (IPA)
|
Gradient Area (GDA)
|
Control Area (CLA)
|
|
Adult Fish Survey
|
P1, P2
|
G1, G2
|
R1, R2
|
|
Juvenile Fish Survey
|
P1, P2
|
G1, G2
|
R1, R2
|
|
Ichtyoplankton Survey
|
T1, T2
|
T5, T6
|
T3, T4
|
Figure 3.1 Fisheries Resources
Monitoring Locations
3.3
Adult Fish Survey Methodology
 Two
fishing methods, gill netting and cage trapping, were used to sample pelagic
and demersal adult fish resources at each sampling
location. These methods
are also commonly
used by local fishermen in Hong Kong waters.
Two
fishing methods, gill netting and cage trapping, were used to sample pelagic
and demersal adult fish resources at each sampling
location. These methods
are also commonly
used by local fishermen in Hong Kong waters.
Pelagic Fish Survey - Gill Netting
 Under each sampling event,
a pair of trammel (gill)
nets was deployed
for one (1) hour at each sampling location. The nets were 1 m deep, 30 m in length and comprised of three
(3) layers, with two 20 cm mesh
stretches sandwiching a 5 cm mesh stretch. All fish species captured were
recorded and identified to species level as far as practicable. Each gill
netting survey was analysed for species composition, abundance, size (total length), biomass
in weight and diversity of adult fish.
Under each sampling event,
a pair of trammel (gill)
nets was deployed
for one (1) hour at each sampling location. The nets were 1 m deep, 30 m in length and comprised of three
(3) layers, with two 20 cm mesh
stretches sandwiching a 5 cm mesh stretch. All fish species captured were
recorded and identified to species level as far as practicable. Each gill
netting survey was analysed for species composition, abundance, size (total length), biomass
in weight and diversity of adult fish.
Demersal Fish Survey - Cage Trapping
 Two sets of four metal wire cage traps, each ranged from 0.8 to 0.9 m3 in volume and mesh size of 25 mm, were deployed for one (1) hour
at each sampling location. Distance between the traps was about 10 m, and the
distance between each set of traps was about 100 m. Breador other suitable fish
bait was used as bait for cage trapping. All species caught in the cage trapping
survey were identified to
species level as far as practical. Each cage trapping surveywas analysed for
species composition, abundance, size (total length),
biomass in weight and
diversity of adult fish.
Two sets of four metal wire cage traps, each ranged from 0.8 to 0.9 m3 in volume and mesh size of 25 mm, were deployed for one (1) hour
at each sampling location. Distance between the traps was about 10 m, and the
distance between each set of traps was about 100 m. Breador other suitable fish
bait was used as bait for cage trapping. All species caught in the cage trapping
survey were identified to
species level as far as practical. Each cage trapping surveywas analysed for
species composition, abundance, size (total length),
biomass in weight and
diversity of adult fish.
3.4
Juvenile Fish Survey Methodology
 A typical
purse-seine fishing method
was used to sample juvenile
fish at each sampling location. The nets adopted in the survey ranged from 5 to 15 m deep (depending
on the water depth) and were
50 m in length, and with 6 mm mesh size (maximum stretched). For each sampling
event, both a mother boat and a P4
sampan were deploy the seine net for
approximately 30 to 45
minutes, with each boat holding one end of the net. The nets were pulled towards
the fish resources in the form of a semi-circle. Fish catches were concentrated and lifted onto the mother boat. All fishes captured
were recorded and identified to species level as
far as practicable.
A typical
purse-seine fishing method
was used to sample juvenile
fish at each sampling location. The nets adopted in the survey ranged from 5 to 15 m deep (depending
on the water depth) and were
50 m in length, and with 6 mm mesh size (maximum stretched). For each sampling
event, both a mother boat and a P4
sampan were deploy the seine net for
approximately 30 to 45
minutes, with each boat holding one end of the net. The nets were pulled towards
the fish resources in the form of a semi-circle. Fish catches were concentrated and lifted onto the mother boat. All fishes captured
were recorded and identified to species level as
far as practicable.
3.5
Ichthyoplankton Survey Methodology
 To
investigate spatial and seasonal or temporal variation of fish egg and fish
larvae composition, ichthyoplankton survey was conducted at
each sampling transect using plankton towing to collect representative samples.
To
investigate spatial and seasonal or temporal variation of fish egg and fish
larvae composition, ichthyoplankton survey was conducted at
each sampling transect using plankton towing to collect representative samples.
 A
bongo plankton net, of 50 cm mouth diameter and with 0.5 mm mesh size, was
deployed to collect ichthyoplankton. A flow meter was fitted at mouth of the net to record the volume of water filtered.
A
bongo plankton net, of 50 cm mouth diameter and with 0.5 mm mesh size, was
deployed to collect ichthyoplankton. A flow meter was fitted at mouth of the net to record the volume of water filtered.
 At
each site, three (3) replicate
tows were conducted, and each
tow with a duration of 15 minutes.
The net was deployed in a single oblique tow to a depth of 2m off the seabed and towed at a speed
of 1-2 knots. Consequently, the net was gradually winched up towards the water surface in order to sample the entire water column.
At
each site, three (3) replicate
tows were conducted, and each
tow with a duration of 15 minutes.
The net was deployed in a single oblique tow to a depth of 2m off the seabed and towed at a speed
of 1-2 knots. Consequently, the net was gradually winched up towards the water surface in order to sample the entire water column.
 The plankton
was immediately fixed in 70% ethanol. The ichthyoplankton was sorted, number counted and size range measured in
the laboratory. All fish egg and fish
larvae captured were recorded and identified to the lowest taxonomic level,
where possible. Larval fish individual without
distinctive morphological features for taxonomic identification were examined
with the aid of DNA sequencing if deemed necessary. Species composition,
abundance and diversity of species were measured to describe and compare temporal
and spatial changes.
The plankton
was immediately fixed in 70% ethanol. The ichthyoplankton was sorted, number counted and size range measured in
the laboratory. All fish egg and fish
larvae captured were recorded and identified to the lowest taxonomic level,
where possible. Larval fish individual without
distinctive morphological features for taxonomic identification were examined
with the aid of DNA sequencing if deemed necessary. Species composition,
abundance and diversity of species were measured to describe and compare temporal
and spatial changes.
3.6
Data Analysis
 Data collected
under each fisheries
monitoring event were analyzed to assess the spatial and temporal variations of species
abundance and total biomass (for adult and juvenile fish)/ density
(for ichthyoplankton). Temporal (wet vs. dry) and spatial (e.g. Impact Area vs.
Control Area) differences in fish abundance were compared using descriptive
statistics and/ or inferential statistics (Microsoft Excel and/or Statistical
Package for the Social Sciences (SPSS)), followed by multiple comparison
procedures, as appropriate. Diversity of fish resources was presented as
species richness, Shannon-Weiner diversity (H��) and Pielou��s evenness (J��).
Patterns of fish species composition are presented and subject to statistical analyses
as above. Values of catches of
commercial species for adult and juvenile
fishes are presented in terms CPUE (number of individuals per fishing time and number of nets or cages) and YPUE (weight of
fish per survey time and number of nets or cages).
Data collected
under each fisheries
monitoring event were analyzed to assess the spatial and temporal variations of species
abundance and total biomass (for adult and juvenile fish)/ density
(for ichthyoplankton). Temporal (wet vs. dry) and spatial (e.g. Impact Area vs.
Control Area) differences in fish abundance were compared using descriptive
statistics and/ or inferential statistics (Microsoft Excel and/or Statistical
Package for the Social Sciences (SPSS)), followed by multiple comparison
procedures, as appropriate. Diversity of fish resources was presented as
species richness, Shannon-Weiner diversity (H��) and Pielou��s evenness (J��).
Patterns of fish species composition are presented and subject to statistical analyses
as above. Values of catches of
commercial species for adult and juvenile
fishes are presented in terms CPUE (number of individuals per fishing time and number of nets or cages) and YPUE (weight of
fish per survey time and number of nets or cages).
4
Supplementary Baseline Water Quality Monitoring Methodology
4.1
Monitoring Parameters and Programme
 Supplementary
baseline water quality monitoring (in addition to those specified in the
EM&A Manual) was carried out at
the same frequency and locations of the baseline fisheries monitoring
programme. The water quality
monitoring parameters include the following:
Supplementary
baseline water quality monitoring (in addition to those specified in the
EM&A Manual) was carried out at
the same frequency and locations of the baseline fisheries monitoring
programme. The water quality
monitoring parameters include the following:
In-situ measurements:
- Water Depth (m)
- Temperature (�XC)
- pH
- Dissolved Oxygen (DO) (mg/L)
- Turbidity (NTU)
- Salinity
(ppt)
Laboratory Analysis:
- Suspended Solid (SS) (mg/L)
- Iron (Fe) (mg/L)
- Total Residual Chlorine
(TRC) (mg/L)
 Four
water quality monitoring events covering dry and wet seasons were carried out.
Undereach event, in-situ measurements and water sampling were taken at both
mid-flood and mid-ebb tides. A summary of the baseline water quality monitoring programme is provided
in Table 4-1 below.
Four
water quality monitoring events covering dry and wet seasons were carried out.
Undereach event, in-situ measurements and water sampling were taken at both
mid-flood and mid-ebb tides. A summary of the baseline water quality monitoring programme is provided
in Table 4-1 below.
Table 4-1: Supplementary Baseline Water Quality Monitoring
Programme
|
Monitoring Event
|
Season
|
Date
|
Tidal Status
|
|
Event 1
|
Dry Season
|
17 February 2024
|
Mid-ebb and mid- flood
|
|
Event 2
|
Dry Season
|
24 February 2024
|
Mid-ebb and mid- flood
|
4.2
Monitoring Locations
 Supplementary
baseline water quality monitoring was conducted at all the six (6) adult andjuvenile fish sampling locations as shown in Figure 2.1
and summarized in Table 4-2.
Supplementary
baseline water quality monitoring was conducted at all the six (6) adult andjuvenile fish sampling locations as shown in Figure 2.1
and summarized in Table 4-2.
Table 4-2: Supplementary Water Quality Monitoring Locations
|
Monitoring Location ID (see Figure 2.1)
|
|
Impact Area
(IPA)
|
Gradient Area (GDA)
|
Control Area (CLA)
|
|
P1, P2
|
G1, G2
|
R1, R2
|
 At
each location, water quality was
monitored at 3 water depths (i.e. 1m below sea surface, mid- depth and 1 m
above seabed).
At
each location, water quality was
monitored at 3 water depths (i.e. 1m below sea surface, mid- depth and 1 m
above seabed).
4.3
Monitoring Methodology
Monitoring Equipment
 The equipment
used in the supplementary water
quality monitoring is summarized in Table4-3.
The equipment
used in the supplementary water
quality monitoring is summarized in Table4-3.
Table 4-3: Monitoring Equipment
|
Equipment
|
Model
|
|
Water Sampler
|
Kahlsico Water
Samplers
|
|
Multi-parameter Water
Quality System
|
YSI ProDSS
(S/N : 22C106561)
|
Sampling Procedures
 Water
depth was measured at each monitoring location and the levels of the three
monitoring depths were then determined. At each monitoring depth, two replicate measurements of temperature, pH, DO, turbidity and
salinity were taken in-situ and two
replicate water samples were collected for laboratory analysis of SS, Fe and
TRC. Following collection, water samples for laboratory analysis were stored in
high density polythene bottles with no preservatives added, packed in ice (cooled to 4�XC without being frozen) and
kept in dark during both on- temporary storage and delivery to the testing
laboratory.
Water
depth was measured at each monitoring location and the levels of the three
monitoring depths were then determined. At each monitoring depth, two replicate measurements of temperature, pH, DO, turbidity and
salinity were taken in-situ and two
replicate water samples were collected for laboratory analysis of SS, Fe and
TRC. Following collection, water samples for laboratory analysis were stored in
high density polythene bottles with no preservatives added, packed in ice (cooled to 4�XC without being frozen) and
kept in dark during both on- temporary storage and delivery to the testing
laboratory.
Laboratory Analytical Methods
 The
testing of SS, Fe and TRC were conducted by HOKLAS laboratory (ALS Technichem
(HK) Pty Ltd and/or Acumen Laboratory and Testing Limited). Quality assurance and control procedures were implemented to ensure
quality and consistency in results. The
testing methods and corresponding
reporting limits are provided in Table 4-4.
The
testing of SS, Fe and TRC were conducted by HOKLAS laboratory (ALS Technichem
(HK) Pty Ltd and/or Acumen Laboratory and Testing Limited). Quality assurance and control procedures were implemented to ensure
quality and consistency in results. The
testing methods and corresponding
reporting limits are provided in Table 4-4.
Table 4-4: Analytical Methods
|
Parameter
|
Analytical Method
|
Reporting Limit
|
|
Suspended solids
|
APHA 23rd Ed 2540D
|
2.5 mg/L
|
|
Iron
|
APHA 3111 B
|
0.1 mg/L
|
|
Total residual chlorine
|
Test Kit
|
0.01 mg/L
|
5
Site Records
 For
all the above survey methods, monitoring locations were recorded using
global positioning system (GPS). During each monitoring event, the field
conditions and observations (e.g. weather conditions, water depth (m) and
temperature (�XC) etc.) were recorded
at each monitoring location. All field surveys were conducted during
daytime.
For
all the above survey methods, monitoring locations were recorded using
global positioning system (GPS). During each monitoring event, the field
conditions and observations (e.g. weather conditions, water depth (m) and
temperature (�XC) etc.) were recorded
at each monitoring location. All field surveys were conducted during
daytime.
6
Adult Fish Survey Results
6.1
Overall Adult Fish Resources
 For
adult fish survey using cage trapping
and gill netting, a total 7182 g of 108 individuals comprising 12 fish species
from 9 families was recorded. The
dominant species in terms of
abundance were Pearl-spot chromis (Chromis notata) and this species
has low commercial value.
For
adult fish survey using cage trapping
and gill netting, a total 7182 g of 108 individuals comprising 12 fish species
from 9 families was recorded. The
dominant species in terms of
abundance were Pearl-spot chromis (Chromis notata) and this species
has low commercial value.
 The overall
adult fish resources in the Study Area are summarized in Table 6-1. Location
G2 had the highest biomass and
location P2, R1 and R2 had the highest number of species of adult fish
resources. The size of collected fishspecies ranged from 6.9 to 24.5 cm (total
length) and no fish species reached marketable size (≥ 25cm).
The overall
adult fish resources in the Study Area are summarized in Table 6-1. Location
G2 had the highest biomass and
location P2, R1 and R2 had the highest number of species of adult fish
resources. The size of collected fishspecies ranged from 6.9 to 24.5 cm (total
length) and no fish species reached marketable size (≥ 25cm).
Table 6-1: Overall Adult Fish Resources
in the Study Area during the Dry Season Survey
|
Monitoring location
|
Total no. of
species
|
Total biomass (g)
|
Total no. of individual
|
Mean no.
of species (+-SD)
|
Mean biomass
(g +- SD)
|
Mean no. of
individual (+- SD)
|
Dominant species
|
|
P1 (IPA)
|
2
|
746
|
17
|
1
|
373
|
8.5
|
Siganus fuscescens
|
|
P2 (IPA)
|
5
|
1244
|
23
|
2.5
|
622
|
11.5
|
Siganus fuscescens
|
|
G1 (GDA)
|
2
|
621
|
11
|
1
|
310.5
|
5.5
|
Chromis notata
|
|
G2 (GDA)
|
4
|
1704
|
21
|
2
|
852
|
10.5
|
Chromis notata
|
|
R1 (CLA)
|
5
|
1524
|
24
|
2.5
|
762
|
12
|
Chromis notata
|
|
R2 (CLA)
|
5
|
1343
|
12
|
2.5
|
671.5
|
6
|
Cephalopholis
boenak
|
|
Overall total
|
12
|
7182
|
108
|
6
|
3591
|
54
|
Chromis notata
|
*SD will
be calculated in the final
report after wet season monitoring
 The
adult fish resources captured by different gear types are summarized in Table 6-2. Over 64%
biomass of the adult fish resources were captured by cage trapping, that a
total of 4639 g of 75 individuals
comprising 8 species of 8 families was recorded. Location G2 had the highest
biomass and G2 and P2 had the highest number of species of adult fish
resources recorded. For gill-netting, 2415 g of 31 individuals comprising 9
species of 9 families were recorded. Location R2 had the highest biomass and
location R1, R2 and P2 had highest number of species of adult fish resources recorded.
The
adult fish resources captured by different gear types are summarized in Table 6-2. Over 64%
biomass of the adult fish resources were captured by cage trapping, that a
total of 4639 g of 75 individuals
comprising 8 species of 8 families was recorded. Location G2 had the highest
biomass and G2 and P2 had the highest number of species of adult fish
resources recorded. For gill-netting, 2415 g of 31 individuals comprising 9
species of 9 families were recorded. Location R2 had the highest biomass and
location R1, R2 and P2 had highest number of species of adult fish resources recorded.
Table 6-2: Overall Adult Fish Resources by Different Fishing
Gears
|
Sampling location
|
Total no. of
species
|
Total biomass (g)
|
Total no. of individual
|
Mean no.
of species (+-SD)
|
Mean biomass
(g +- SD)
|
Mean no. of individual
(+- SD)
|
Dominant species
|
|
Gill netting
|
|
P1 (IPA)
|
2
|
232
|
6
|
1
|
116
|
3
|
Siganus fuscescens
|
|
P2 (IPA)
|
3
|
338
|
6
|
1.5
|
169
|
3
|
Takifugu poecilonotus
|
|
G1 (GDA)
|
1
|
372
|
4
|
0.5
|
186
|
2
|
Inegocia japonica
|
|
G2 (GDA)
|
2
|
315
|
4
|
1
|
157.5
|
2
|
Chromis notata
|
|
R1 (CLA)
|
3
|
438
|
6
|
1.5
|
219
|
3
|
Monacanthus chinensis
|
|
R2 (CLA)
|
3
|
720
|
5
|
1.5
|
360
|
2.5
|
Takifugu poecilonotus
|
|
Overall total
|
9
|
2415
|
31
|
4.5
|
1207.5
|
15.5
|
Chromis notata
|
|
Cage trapping
|
|
P1 (IPA)
|
2
|
514
|
11
|
1
|
257
|
5.5
|
Siganus fuscescens
|
|
P2 (IPA)
|
5
|
906
|
17
|
2.5
|
453
|
8.5
|
Takifugu poecilonotus
|
|
G1 (GDA)
|
1
|
249
|
7
|
0.5
|
124.5
|
3.5
|
Chromis notata
|
|
G2 (GDA)
|
4
|
1389
|
16
|
2
|
694.5
|
8
|
Chromis notata
|
|
R1 (CLA)
|
3
|
1089
|
17
|
1.5
|
543
|
8.5
|
Chromis notata
|
|
R2 (CLA)
|
2
|
492
|
7
|
1
|
246
|
3.5
|
Chromis notata
|
|
Overall total
|
8
|
4639
|
75
|
4
|
2319.5
|
37.5
|
Chromis notata
|
*SD will be calculated in the final report
after wet season
monitoring
6.2
Commercial Value of Adult Fish Resources
 According
the method used in ��EIA Report for
Expansion of Hong Kong Airport into a Three-
Runway System (AAHK 2012)�� and ��Provision of Consultancy Services for Updated Fisheries Survey
for Tseung Kwan O Desalination
Plant Final Report (ERM 2017)
��, commercial value of adult
fish resources was estimated based
on Fish Marketing Organisation��s (FMO) wholesaleprice
in 2018 and subsequently ranked into three classes
including: High (> 70 HK$/ kg); Medium (60 - 70 HK$/ kg); and Low (< 60 HK$/ kg) (1). Top ten species of commercial importance are summarized in Table 6-3.
According
the method used in ��EIA Report for
Expansion of Hong Kong Airport into a Three-
Runway System (AAHK 2012)�� and ��Provision of Consultancy Services for Updated Fisheries Survey
for Tseung Kwan O Desalination
Plant Final Report (ERM 2017)
��, commercial value of adult
fish resources was estimated based
on Fish Marketing Organisation��s (FMO) wholesaleprice
in 2018 and subsequently ranked into three classes
including: High (> 70 HK$/ kg); Medium (60 - 70 HK$/ kg); and Low (< 60 HK$/ kg) (1). Top ten species of commercial importance are summarized in Table 6-3.
 Among the 12 fish species recorded,
9 species are classified as commercial species,
which accounted for about 73.3% of the total
biomass and 82.6% of the total abundance from thecaptured adult fish species. Most of these commercial species
are of medium to low commercial value (45.1% of total abundance). However, high commercial value fishes showed only 28.2% in terms of total biomass. The dominant
species in terms of abundance were Pearl-spot chromis (Chromis notata) which accounting for 29.4 % of total abundance. In terms of abundance, most of the adult fish resources in the
Study Area are of low to no commercial value, accounting for > 67% of total
abundance of overall adult fish resources. However, in term of biomass, most of
the adult fish resources in the Study Area are also of low to no commercial
value, accounting for > 57% of total biomass of overall adult fish resources.
Among the 12 fish species recorded,
9 species are classified as commercial species,
which accounted for about 73.3% of the total
biomass and 82.6% of the total abundance from thecaptured adult fish species. Most of these commercial species
are of medium to low commercial value (45.1% of total abundance). However, high commercial value fishes showed only 28.2% in terms of total biomass. The dominant
species in terms of abundance were Pearl-spot chromis (Chromis notata) which accounting for 29.4 % of total abundance. In terms of abundance, most of the adult fish resources in the
Study Area are of low to no commercial value, accounting for > 67% of total
abundance of overall adult fish resources. However, in term of biomass, most of
the adult fish resources in the Study Area are also of low to no commercial
value, accounting for > 57% of total biomass of overall adult fish resources.
Table 6-3: Species Recorded with Commercial Value
in the Study Area
|
Family
|
Species
|
Level of Commercial
Value*
|
Biomass (g)
|
% of Total
Biomass (Rank)
|
Abundance
|
% of Total
Abundance (Rank)
|
|
Serranidae
|
Cephalopholis boenak
|
H
|
1914
|
28.2% (1)
|
17
|
15.6% (3)
|
|
Pomacentridae
|
Chromis notata
|
L
|
1153
|
17.0% (3)
|
32
|
29.4% (1)
|
|
Siganidae
|
Siganus canaliculatus
|
L
|
497
|
7.3% (4)
|
9
|
8.3% (4)
|
|
Platycephalidae
|
Inegocia japonica
|
M-H
|
372
|
5.5% (5)
|
4
|
3.7% (9)
|
|
Monacanthidae
|
Monacanthus chinensis
|
M
|
371
|
5.5% (6)
|
6
|
5.5% (7)
|
|
Scorpaenidae
|
Sebastiscus marmoratus
|
L
|
285
|
4.2% (8)
|
4
|
3.7% (10)
|
|
Sparidae
|
Evynnis cardinalis
|
M-H
|
249
|
3.7% (9)
|
8
|
7.3% (5)
|
|
Apogonidae
|
Ostorhinchus fasciatus
|
L
|
129
|
1.9% (10)
|
6
|
5.5% (6)
|
|
Apogonidae
|
Apogon cathetogramma
|
L
|
7
|
0.1% (11)
|
4
|
3.7% (8)
|
|
*Notes: H = High (>
70 HK$/ kg; M = Medium (60 - 70 HK$/ kg);
L = Low (< 60 HK$/ kg);
|
(1) Three classes
of wholesale prices were defined
under ERM 2017 to indicate
the commercial value of the fish
resources. With reference to the Fish Marketing Organization Annual Report 2016
/ 2017 (https://www.fmo.org.hk/download?path=15_58&id=15), there has been an increasing trend of wholesale
prices over the years. As such, the ranges of wholesale prices established under ERM
2017 have been adjusted under this Studyto reflect the increases in the market prices over the years.
6.3
Catch per Unit Effort
 The following
equation is adopted
to calculate Catch per Unit Effort (CPUE):
The following
equation is adopted
to calculate Catch per Unit Effort (CPUE):
CPUE = No. of individual of fish
Fishing time (hour) x (Number
of net and cage)
, where
Fishing time = 1 hour; Number of net = 2; Number of cage = 8.
 The CPUE
was variable with locations, mean CPUE of each monitoring location ranged between 0.55 and 1.15 no. hour-1 cage&net-1 (Table 6-4).
The CPUE
was variable with locations, mean CPUE of each monitoring location ranged between 0.55 and 1.15 no. hour-1 cage&net-1 (Table 6-4).
Table 6-4: Mean Catch per Unit Effort of Adult Fish Resources at each Monitoring Location
|
Monitoring location
|
Mean CPUE (no.
hour-1 cage&net-1 +- SD)
|
|
P1 (IPA)
|
0.85
|
|
P2 (IPA)
|
1.15
|
|
G1 (GDA)
|
0.55
|
|
G2 (GDA)
|
1.05
|
|
R1 (CLA)
|
1.2
|
|
R2 (CLA)
|
0.6
|
|
Overall total
|
5.4
|
*SD will be calculated in the final report
after wet season
monitoring
6.4
Yield per Unit Effort
 The
following equation is adopted to calculate Yield per Unit Effort (YPUE):YPUE = biomass (g) of fish
The
following equation is adopted to calculate Yield per Unit Effort (YPUE):YPUE = biomass (g) of fish
Fishing time (hour) x (Number of net and cage)
Where Fishing time = 1 hour; Number of net = 2; Number of cage = 8.
 The YPUE was variable
with locations, the mean YPUE of each monitoring location
ranged between 31.1 g and
85.2 g no. hour-1 cage & net-1 (Table 6-5).
The YPUE at locations P1 and P2(i.e. the Impact Area) were moderate
amongst all the locations.
The YPUE was variable
with locations, the mean YPUE of each monitoring location
ranged between 31.1 g and
85.2 g no. hour-1 cage & net-1 (Table 6-5).
The YPUE at locations P1 and P2(i.e. the Impact Area) were moderate
amongst all the locations.
Table 6-5: Mean Yield per Unit Effort of Adult Fish Resources at each Monitoring
Location
|
Monitoring location
|
Mean YPUE (g hour-1 cage&net-1 +- SD)
|
|
P1 (IPA)
|
37.3
|
|
P2 (IPA)
|
62.2
|
|
G1 (GDA)
|
31.1
|
|
G2 (GDA)
|
85.2
|
|
R1 (CLA)
|
76.2
|
|
R2 (CLA)
|
67.2
|
|
Overall total
|
359.1
|
6.5
Species Composition
6.5.1 The abundant and
biomass of fish species recorded in the Study Area are listed in Table 6-7 and Table 6-8, with percentages of total abundance
and biomass listed
in descending order for each study area.
In CLA (i.e. Locations R1
and/ or R2), the percentage of total
abundance was dominated by fish
family Pomacentridae (Chromis notata) and family Serranidae (Cephalopholis boenak); while biomass was dominated by fish family Serranidae (Cephalopholis boenak).
6.5.2
In GDA, only few species were captured, the most abundant
species was pearl-spot chromis Chromis notata (>63 % biomass at G1)
and the highest biomass was Serranidae (Cephalopholis
boenak). In IPA, the most abundant and highest biomass
species was the family Siganidae
(Siganus canaliculatus) (>52% and >66.6% in P1). In dry season, the species composition at
different locations were generally variable. (Table 6-7 and 6-8)
Table 6-7: Abundance data of Adult Fish Species
Recorded Dry Season in the Study Area
|
Dry season
|
|
Location
|
Family
|
Species
|
Commercial value
|
Mean Abundance
|
Mean
% Abundance
|
|
P1
|
Siganidae
|
Siganus canaliculatus
|
L
|
4.5
|
52.94
|
|
Sparidae
|
Evynnis cardinalis
|
M-H
|
4
|
47.06
|
|
P2
|
Tetraodontidae
|
Takifugu poecilonotus
|
X
|
4
|
34.78
|
|
Apogonidae
|
Apogon
cathetogramma
|
L
|
3
|
26.09
|
|
Serranidae
|
Cephalopholis boenak
|
H
|
2
|
17.39
|
|
Monacanthidae
|
Monacanthus chinensis
|
M
|
1.5
|
13.04
|
|
Scorpaenidae
|
Sebastiscus marmoratus
|
L
|
1
|
8.70
|
|
G1
|
Pomacentridae
|
Chromis notata
|
L
|
3.5
|
63.64
|
|
Platycephalidae
|
Inegocia japonica
|
M-H
|
2
|
36.36
|
|
G2
|
Pomacentridae
|
Chromis notata
|
L
|
5
|
47.62
|
|
Serranidae
|
Cephalopholis boenak
|
H
|
2
|
19.05
|
|
Apogonidae
|
Ostorhinchus fasciatus
|
L
|
2
|
19.05
|
|
Tetraodontidae
|
Takifugu poecilonotus
|
X
|
1.5
|
14.29
|
|
R1
|
Pomacentridae
|
Chromis notata
|
L
|
5.5
|
44.00
|
|
Tetraodontidae
|
Takifugu poecilonotus
|
X
|
2.5
|
20.00
|
|
Serranidae
|
Cephalopholis boenak
|
H
|
2
|
16.00
|
|
Monacanthidae
|
Monacanthus chinensis
|
M
|
1.5
|
12.00
|
|
Scorpaenidae
|
Sebastiscus marmoratus
|
L
|
1
|
8.00
|
|
R2
|
Serranidae
|
Cephalopholis boenak
|
H
|
2.5
|
41.67
|
|
Pomacentridae
|
Chromis notata
|
L
|
2
|
33.33
|
|
Tetraodontidae
|
Takifugu poecilonotus
|
M
|
1
|
16.67
|
|
Tetraodontidae
|
Arothron hispidus
|
X
|
0.5
|
8.33
|
Note: L- Low; M - Medium; H - High; X - No commercial
value
Table 6-8: Biomass data of Adult Fish Species Recorded in Dry Season in the Study Area
|
Dry season
|
|
Location
|
Family
|
Species
|
Commercial value
|
Mean
Biomass (g)
|
Mean % Biomass
|
|
P1
|
Siganidae
|
Siganus canaliculatus
|
L
|
248.5
|
66.62
|
|
Sparidae
|
Evynnis cardinalis
|
M-H
|
124.5
|
33.38
|
|
P2
|
Tetraodontidae
|
Takifugu poecilonotus
|
X
|
211
|
36.22
|
|
Serranidae
|
Cephalopholis boenak
|
H
|
146.5
|
25.15
|
|
Apogonidae
|
Apogon
cathetogramma
|
L
|
96
|
16.48
|
|
Scorpaenidae
|
Sebastiscus marmoratus
|
L
|
79.5
|
13.65
|
|
Monacanthidae
|
Monacanthus chinensis
|
M
|
49.5
|
8.50
|
|
G1
|
Platycephalidae
|
Inegocia japonica
|
M-H
|
186
|
59.90
|
|
Pomacentridae
|
Chromis notata
|
L
|
124.5
|
40.10
|
|
G2
|
Serranidae
|
Cephalopholis boenak
|
H
|
329
|
38.62
|
|
Tetraodontidae
|
Takifugu poecilonotus
|
X
|
287
|
33.69
|
|
Pomacentridae
|
Chromis notata
|
L
|
171.5
|
20.13
|
|
Apogonidae
|
Ostorhinchus fasciatus
|
L
|
64.5
|
7.57
|
|
R1
|
Serranidae
|
Cephalopholis boenak
|
H
|
237.5
|
31.17
|
|
Pomacentridae
|
Chromis notata
|
L
|
198.5
|
26.05
|
|
Monacanthidae
|
Monacanthus chinensis
|
M
|
136
|
17.85
|
|
Tetraodontidae
|
Takifugu poecilonotus
|
X
|
127
|
16.67
|
|
Scorpaenidae
|
Sebastiscus marmoratus
|
L
|
63
|
8.27
|
|
R2
|
Serranidae
|
Cephalopholis boenak
|
H
|
244
|
40.26
|
|
Tetraodontidae
|
Arothron hispidus
|
X
|
162
|
26.73
|
|
Tetraodontidae
|
Takifugu poecilonotus
|
M
|
118
|
19.47
|
|
Pomacentridae
|
Chromis notata
|
L
|
82
|
13.53
|
Note: L- Low; M - Medium; H - High; X - No commercial
value
7
Juvenile Fish Survey Results
7.1
Overall Juvenile Fish Resources
 For
juvenile fish survey using purse-seining, a total of 1420.3 g of 215
individuals comprising 1 species was
recorded. The only species recorded
in terms of biomass and abundance was mullet Mugil sp., which is of low commercial value.
For
juvenile fish survey using purse-seining, a total of 1420.3 g of 215
individuals comprising 1 species was
recorded. The only species recorded
in terms of biomass and abundance was mullet Mugil sp., which is of low commercial value.
 The overall
juvenile fish resources in the Study Area are summarized in Table 7-1. LocationR1 had the highest
biomass and number of juvenile fish resources, contributed by only singlegenus Mugil sp. The size of this dominant
species ranged from 3.1 to 4.9 cm (total length).
The overall
juvenile fish resources in the Study Area are summarized in Table 7-1. LocationR1 had the highest
biomass and number of juvenile fish resources, contributed by only singlegenus Mugil sp. The size of this dominant
species ranged from 3.1 to 4.9 cm (total length).
Table 7-1: Overall Juvenile
Fish Resources in the Study Area during
Dry Season Monitoring
|
Monitoring location
|
Total no. of species
|
Total biomass (g)
|
Total no. of individual
|
Mean no.
of species (+-SD)
|
Mean biomass (g +- SD)
|
Mean no. of individual
(+- SD)
|
Dominant species
|
|
P1 (IPA)
|
--
|
--
|
--
|
--
|
--
|
--
|
--
|
|
P2 (IPA)
|
1
|
403.2
|
56
|
0.5
|
201.6
|
28
|
Mugil sp.
|
|
G1 (GDA)
|
--
|
--
|
--
|
--
|
--
|
--
|
--
|
|
G2 (GDA)
|
--
|
--
|
--
|
--
|
--
|
--
|
--
|
|
R1 (CLA)
|
1
|
782.6
|
124
|
0.5
|
391.3
|
62
|
Mugil sp.
|
|
R2 (CLA)
|
1
|
234.5
|
35
|
0.5
|
117.3
|
17.5
|
Mugil sp.
|
|
Overall total
|
1
|
1420.3
|
215
|
0.5
|
710.2
|
107.5
|
Mugil sp.
|
*SD will be calculated in the final
report after wet season monitoring
7.2
Commercial Value
 The
commercial value of juvenile fish is also estimated using the same approach for
adult fish resources as described in Section 6.2. The only species recorded in the
Study Area was of low commercial
value.
The
commercial value of juvenile fish is also estimated using the same approach for
adult fish resources as described in Section 6.2. The only species recorded in the
Study Area was of low commercial
value.
7.3
Catch per Unit Effort
 The following
equation is adopted to calculate
Catch per Unit Effort (CPUE):
The following
equation is adopted to calculate
Catch per Unit Effort (CPUE):
CPUE = No.of individual of fish
Fishing time (hour) x (Number of net)
, where
Fishing time = 15 minutes = 0.25 hour; Number of net = 2
 The mean CPUE of each monitoring location ranged between
17.5 and 84 no. hour-1 net-1 (Table 7-2). Locations
P1 and P2 (i.e. Impact Area, IPA) had the lowest CPUE amongst
all thelocations.
The mean CPUE of each monitoring location ranged between
17.5 and 84 no. hour-1 net-1 (Table 7-2). Locations
P1 and P2 (i.e. Impact Area, IPA) had the lowest CPUE amongst
all thelocations.
Table 7-2: Mean Catch per Unit Effort of Juvenile Fish Resources at each Monitoring
Location
|
Monitoring location
|
Mean CPUE
(no. hour-1 net-1 +- SD)
|
|
P1 (IPA)
|
0
|
|
P2 (IPA)
|
14
|
|
G1 (GDA)
|
0
|
|
G2 (GDA)
|
0
|
|
R1 (CLA)
|
31
|
|
R2 (CLA)
|
8.75
|
|
Overall total
|
53.8
|
*SD will be calculated in the final report
after wet season
monitoring
7.4
Yield per Unit Effort
 The following
equation is adopted to calculate
Yield per Unit Effort (YPUE):
The following
equation is adopted to calculate
Yield per Unit Effort (YPUE):
YPUE = Biomass (g)of fish , where
Fishing time (hour)x (Number of net)
Fishing time = 15 mintues
= 0.25 hour; Number of net = 2.
 The mean YPUE of each
sampling location ranged between
117.8 and 577.3 g hour-1 net-1 (Table 7-3).
Locations P1 and P2 (i.e. Impact Area, IPA) had the lowest YPUE amongst all the
locations.
The mean YPUE of each
sampling location ranged between
117.8 and 577.3 g hour-1 net-1 (Table 7-3).
Locations P1 and P2 (i.e. Impact Area, IPA) had the lowest YPUE amongst all the
locations.
Table 7-3: Mean Yield per Unit Effort of Juvenile Fish Resources at each Monitoring
Location
|
Monitoring Location
|
Mean YPUE (g hour-1 net-1 +- SD)
|
|
P1 (IPA)
|
0
|
|
P2 (IPA)
|
100.8
|
|
G1 (GDA)
|
0.0
|
|
G2 (GDA)
|
0.0
|
|
R1 (CLA)
|
195.7
|
|
R2 (CLA)
|
58.7
|
|
Overall total
|
355.1
|
*SD will
be calculated in the final report after
wet season monitoring
7.5
Species Composition
7.5.1 Amongst all the locations, mullet
Mugil sp., was the only one species recorded in the Study Area.
8
Ichthyoplankton Survey Results
8.1
Overall Ichthyoplankton Assemblages
 In the ichthyoplankton survey,
a total of 13 species
from 9 families (including both fish egg and fish larvae) were recorded
in the Study Area, comprising 7 fish
egg species from 4 families,
and 6 fish larvae species from 5 families. The
dominant species of fish egg and fish larvae were Threadfin porgy Evynnis cardinalis and Marbled rockfish
Sebastiscus marmoratus, respectively,
accounting for 55.7 % of total density in egg and 61 % of total density
fish larvae. These dominantspecies are considered of medium to high commercial value. The overall
ichthyoplankton collected in the
Study Area is summarized in Table 8-1..
In the ichthyoplankton survey,
a total of 13 species
from 9 families (including both fish egg and fish larvae) were recorded
in the Study Area, comprising 7 fish
egg species from 4 families,
and 6 fish larvae species from 5 families. The
dominant species of fish egg and fish larvae were Threadfin porgy Evynnis cardinalis and Marbled rockfish
Sebastiscus marmoratus, respectively,
accounting for 55.7 % of total density in egg and 61 % of total density
fish larvae. These dominantspecies are considered of medium to high commercial value. The overall
ichthyoplankton collected in the
Study Area is summarized in Table 8-1..
Table 8-1: Overall Ichthyoplankton Assemblages in the Study Area during Dry Season Monitoring
|
Monitoring location
|
Total no. of
species
|
Total density (no./ 1000 m3)
|
Mean no. of
species (+- SD)
|
Mean
density (no./ 1000 m3 +-
SD)
|
Dominant species
|
|
Fish Egg
|
|
T1 (IPA)
|
5
|
99.35
|
2.5
|
49.77
|
Evynnis cardinalis
|
|
T2 (IPA)
|
2
|
81.88
|
1
|
40.94
|
Acanthopagrus schlegelii
|
|
T3 (CLA)
|
2
|
41.75
|
1
|
20.88
|
Evynnis cardinalis
|
|
T4 (CLA)
|
3
|
169.06
|
1.5
|
84.53
|
Evynnis cardinalis
|
|
T5 (GDA)
|
1
|
45.98
|
0.5
|
22.99
|
Evynnis cardinalis
|
|
T6 (GDA)
|
0
|
0
|
0
|
0
|
-
|
|
Overall total
|
7
|
438.02
|
3.5
|
219.01
|
Evynnis cardinalis
|
|
Fish Larvae
|
|
T1 (IPA)
|
4
|
19.77
|
2
|
9.89
|
Sebastiscus marmoratus
|
|
T2 (IPA)
|
3
|
4.18
|
1.5
|
2.09
|
Sebastiscus marmoratus
|
|
T3 (CLA)
|
3
|
52.7
|
1.5
|
26.35
|
Sebastiscus marmoratus
|
|
T4 (CLA)
|
4
|
77.02
|
2
|
38.51
|
Sebastiscus marmoratus
|
|
T5 (GDA)
|
0
|
0
|
0
|
0
|
-
|
|
T6 (GDA)
|
0
|
0
|
0
|
0
|
-
|
|
Overall total
|
6
|
153.67
|
3
|
76.84
|
Sebastiscus marmoratus
|
*SD will
be calculated in the final report after
wet season monitoring
8.2
Species Composition of Ichthyoplankton Assemblages
Fish Egg Composition
8.2.1 The most abundant fish egg species
recorded in the Study Area are listed in Table 8-2, with percentages of total density listed
in descending order for each study area.
The species composition at all locations were
generally variable.
8.2.2 In dry season, the species composition of fish egg was
more variable with locations/ areas. IPA (Site T1
and T2) was dominated by Evynnis cardinalis and Acanthopagrus schlegelii. CLA (Site T3 and T4)
was dominated by Evynnis cardinalis. GLA
(Site T5) was dominated by Evynnis cardinalis.
While no fish egg was recorded in site T6.
Fish Larvae Composition
8.2.3 The most abundant fish larvae species recorded in the Study Area are
listed in Table 8-3, with percentages of total density listed in descending order
for each study area. The species composition at all locations were generally
variable.
8.2.4 In dry season, at all locations, the percentage of total density of
fish larvae was dominated bycommon rockfish Sebastiscus marmoratus, which was
of high commercial value, contributingto 38.69 - 78.27% total fish larvae
density at the survey area (Table 8-3).
Table 8-2: Most Dominant
Fish Egg Species Recorded at the six Sampling Locations
in Dry Season
|
Dry season
|
|
Location
|
Family
|
Species
|
Commercial value
|
Mean Density (no.
per 1000 m3)
|
Mean % Density
|
|
T1
|
Labridae
|
Evynnis cardinalis
|
M
|
35.45
|
35.62%
|
|
|
Sparidae
|
Acanthopagrus pacificus
|
M
|
21.25
|
21.35%
|
|
|
Sillaginidae
|
Sillago sihama
|
M
|
20.32
|
20.42%
|
|
|
Labridae
|
Pseudolabrus eoethinus
|
L
|
15.26
|
15.33%
|
|
|
Clupeidae
|
Nematalosa japonica
|
L
|
7.25
|
7.28%
|
|
T2
|
Sparidae
|
Acanthopagrus schlegelii
|
M
|
62.32
|
76.11%
|
|
|
Sparidae
|
Evynnis cardinalis
|
M
|
19.56
|
23.89%
|
|
T3
|
Sparidae
|
Evynnis cardinalis
|
M
|
31.52
|
75.50%
|
|
|
Sparidae
|
Acanthopagrus schlegelii
|
M
|
10.23
|
24.50%
|
|
T4
|
Sparidae
|
Acanthopagrus schlegelii
|
M
|
82.53
|
56.28
|
|
|
Labridae
|
Evynnis cardinalis
|
L
|
64.12
|
43.72
|
|
T5
|
Labridae
|
Evynnis cardinalis
|
L
|
45.98
|
100.00%
|
|
T6
|
-
|
-
|
M
|
-
|
-
|
Note: L- Low; M - Medium; H - High; X - No commercial
value
Table 8-3: Most Dominant
Fish Larvae Species Recorded at the six Sampling Locations
in Dry Season
|
Dry season
|
|
Location
|
Family
|
Species
|
Commercial value
|
Mean Density (no.
per 1000 m3)
|
Mean % Density
|
|
T1
|
Scorpaenidae
|
Sebastiscus marmoratus
|
H
|
7.65
|
38.69%
|
|
|
Sparidae
|
Acanthopagrus latus
|
M
|
6.21
|
31.41%
|
|
|
Callionymidae
|
Callionymus curvicornis
|
L
|
5.26
|
26.61%
|
|
|
Soleidae
|
Solea ovata
|
M
|
0.65
|
3.29%
|
|
T2
|
Scorpaenidae
|
Sebastiscus marmoratus
|
H
|
3.15
|
75.36%
|
|
|
Apogonidae
|
Apogonichthyoides
cathetogramma
|
L
|
1.03
|
24.64%
|
|
|
|
|
|
|
|
|
T3
|
Scorpaenidae
|
Sebastiscus marmoratus
|
H
L
|
41.25
|
78.27%
|
|
|
Apogonidae
|
Apogonichthyoides
cathetogramma
|
11.45
|
21.73%
|
|
T4
|
Scorpaenidae
|
Sebastiscus marmoratus
|
H L
L
|
41.56
|
53.96%
|
|
|
Triglidae
|
Lepidotrigla alata
|
19.21
|
24.94%
|
|
|
Apogonidae
|
Apogonichthyoides cathetogramma
|
16.25
|
21.10%
|
|
T5
|
-
|
-
|
-
|
-
|
-
|
|
T6
|
-
|
-
|
-
|
-
|
-
|
Note: L- Low; M - Medium; H - High; X - No commercial
value
9
Supplementary Water Quality Monitoring Results
9.1 The statistical summary
of the water quality monitoring parameters during dry are tabulated
in Table
11.1. The detailed in-situ and
laboratory measurement result are shown in Appendix
A and Appendix B respectively.
9.2 The measured water
temperature values ranged
from about 21.93 �XC to about 23.28 �XC in dry season. No absolute Water Quality
Objective (WQO) on marine water temperature is available. Seasonal variation of
water temperatures was recorded from the monitoring as expected.
9.3 The sea is a large pH buffering system
with high capacity
to resist changes in pH. The pH of seawater is normally very stable. Localized
changes of pH in seawater
may occur due to industrial discharge or episodic
event such as algal bloom. All the pH values are within the normal natural range in seawater
and complied with the relevant WQO
of 7.58 to 8.05 in both dry. No
seasonal trend of pH is observed.
9.4 Dissolved oxygen (DO) is essential to
fish and an important health indicator of the marine ecosystem. Higher
water temperature would tend to decrease the solubility of DO in seawater.
The measured DO levels are generally lower in wet season as compared to the values measured
in dry season but all the measured DO values are considered high. The
depth-averaged DO and bottom DO values measured during the dry season are all
over 7 mg/L. Thus, the DO levels are good in both dry.
9.5 Unlike
the north western
water of Hong Kong, which is subject
to strong seasonal influence from the freshwater
discharges from Pearl River Delta with high suspended solids (SS) content, the
monitoring stations of this Study are located in the eastern water of Hong Kong
with much more stable salinity and lower SS contents. No absolute SS and turbidity objectives in marine water are
available. The average SS and turbidity levels are below 5 mg/L and 7 NTU with
highest measured values of about 8 mg/L and 10 NTU respectively. No obvious
seasonal variation of SS and turbidity levels can be identified.
9.6 The average salinity levels measured
during both dry season are higher than 33 ppt,
which indicated that the water is purely oceanic water with no
significant freshwater dilution during
the monitoring periods. No seasonal variation of salinity levels can be
identified from the monitoring results.
9.7 All the measured
iron (Fe) and total residual
chlorine (TRC) values were non-detected. No indication of industrial or trade effluent
discharge is identified in the
Study Area.
Table 11.1 Statistical Summary
of Water Quality
Parameters (Dry Season)
|
Location
|
Water Depth (m)
|
Temperature (�XC)
|
pH
|
Dissolved Oxygen
(mg/L)
|
Bottom Dissolved Oxygen (mg/L)
|
Turbidity (NTU)
|
Salinity (ppt)
|
Suspended Solid (mg/L)
|
Iron (mg/L)
|
Total Residual
Chlorine (mg/L)
|
|
P1
|
3.45
(1 - 6.4)
|
22.63
(22.02-23.28)
|
7.78
(7.58-8.03)
|
7.71
(7.26-8.33)
|
7.72
(7.39-8.14)
|
2.09
(2-2.21)
|
33.24
(32.45-33.95)
|
3.89
(2.50-9.00)
|
<0.1
(<0.1)
|
<0.01
(<0.01)
|
|
P2
|
6.91
(1-13)
|
22.50
(22.06-23.11)
|
7.78
(7.71-7.81)
|
8.09
(7.43-8.56)
|
8.09
(7.54-8.46)
|
2.16
(1.77-2.46)
|
33.90
(33.63-34.12)
|
3.69
(<2.50-9.00)
|
<0.1
(<0.1)
|
<0.01
(<0.01)
|
|
G1
|
10.6
(1-21)
|
22.52
(22.28-23.18)
|
7.76
(7.6-7.89)
|
8.00
(7.36-8.49)
|
8.01
(7.49-8.49)
|
2.29
(2.07-2.78)
|
33.29
(32.43-34.31)
|
3.25
(<2.50-5.00)
|
<0.1
(<0.1)
|
<0.01
(<0.01)
|
|
G2
|
10.49
(1-20.8)
|
23.57
(21.93-23.31)
|
7.80
(7.72-7.9)
|
8.17
(7.86-8.6)
|
8.18
(7.88-8.54)
|
2.19
(1.67-2.61)
|
33.82
(33.13-33.82)
|
3.54
(<2.50-10.00)
|
<0.1
(<0.1)
|
<0.01
(<0.01)
|
|
R1
|
4.55
(1-8.5)
|
23.10
(22.18-23.10)
|
7.81
(7.63-8.05)
|
7.84
(7.53-8.46)
|
7.85
(7.57-8.46)
|
2.49
(2.29-2.69)
|
33.47
(33.07-34.17)
|
3.69
(<2.50-8.00)
|
<0.1
(<0.1)
|
<0.01
(<0.01)
|
|
R2
|
4.63
(1-8.8)
|
22.58
(22.03-23.15)
|
7.86
(7.78-8)
|
8.42
(8.13-8.65)
|
8.43
(8.14-8.65)
|
2.54
(2.27-2.98)
|
33.58
(32.35-33.54)
|
3.17
(<2.50-5.00)
|
<0.1
(<0.1)
|
<0.01
(<0.01)
|
Note:
All data are averaged depth-averaged results except for the bottom
dissolved oxygen which was measured
at the bottom water layer only. Data in brackets
indicate the ranges.
10
Conclusions
10.1 Pre-operation fisheries monitoring works for the Project including
adult fish, juvenile fish, ichthyoplankton and supplementary water quality surveys
were completed in February 2024.
10.2 For adult fish survey using cage trapping and gill netting, a total
7182 g of 108 individuals comprising 12 fish species from 9 families was
recorded. The dominant species in terms of biomass and abundance were
Pearl-spot chromis (Chromis notata),
and this species are of low commercial value. Within the Study Area, majority
of commercial species recorded are of low commercial value with some species of
medium to high commercial values also recorded. The overall commercial value of adult fish
resources in the Study Area is low to
moderate.
10.3 For juvenile fish survey, a total of 1420.3
g of
215 individuals comprising 1 species from 1 families was recorded. The dominant
species in terms
of biomass and abundance was Mugil sp., which is
of low commercial value. The juvenile fish resources in the Study Area is considered to be
of very low diversity and production level.
10.4 In the ichthyoplankton survey, a
total of 13 species from 9 families (including both fish egg and fish larvae)
were recorded in the Study Area, comprising 7 fish egg species from 4 families, and 6 fish larvae species from
5 families. The mean larvae density and total larvae family under the current Study are on the low side
compared with the results reported in other areas of Hong Kong. The dominant species of fish egg and fish
larvae were Evynnis cardinalis and
Marbled rockfish Sebastiscus marmoratus, respectively. These
dominant species are considered of medium to high commercial value.
10.5 The supplementary water quality monitoring showed that the dissolved oxygen (key water quality parameter for fish) and pH
in the Study Area fully complied with the relevant water quality objectives. The suspended solids and turbidity
in the Study Area were in generally
low. Iron and total residual
chlorine were not detected in the Study Area with no indication of industrial or
trade effluent discharge. Overall, the baseline water quality was good in terms of the monitoring parameters.
10.6 Overall, the survey findings showed that the
abundance and diversity of fish eggs
and larvae are on the low side for the Study Area, and the abundance and
diversity of juveniles are very low for the Study Area. Survey findings also showed that there was a very week relationship
in recorded families between ichthyoplankton assemblages, adult fish and
juvenile fish in the Study Area, which
implies that the Study Area does
not appear to be an important spawning or nursery grounds for commercial fishes.
11
References
11.1 Airport Authority Hong Kong (2013) Expansion of Hong Kong International
Airport into a Three-Runway System. Environmental Impact Assessment Report.
11.2 Castle Peak Power Company Limited (2006). Liquefied Natural Gas (LNG)
Receiving Terminal and Associated Facilities. Environmental Impact Assessment Report.
11.3 ERM-Hong Kong Limited (ERM) (2017) Consultancy Services for Updated
Fisheries Survey for Tseung Kwan O Desalination Plant. Final Report
11.4 Fok MSM (2008) Baseline Survey
of Fish Juvenile Assemblages in Tolo
Harbour and Channel, Hong Kong. MPhil
Thesis. The University of Hong Kong.
11.5 Situ Y (2007)
Ichthyoplankton assemblages at Cape d�� Aguilar: seasonal variability and family
composition. MPhil Thesis. The
University of Hong Kong.
APPENDIX A
IN-SITU WATER QUALITY
MEASUREMENT DATA
Water
Quality Monitoring Results
on 17 February 2024 Mid Flood Condition
|
Location
|
Date
|
Weather
|
Sea Condition
|
Tidal
|
Water Level
|
Depth (m)
|
Time
|
DO (mg/L)
|
pH
|
Sal (ppt)
|
Temp (oC)
|
Turbidty (NTU)
|
Remark
|
|
G1
|
20240217
|
Sunny
|
Moderate
|
Mid-Flood
|
Surface
|
1
|
10:27
|
7.8
|
7.8
|
34.31
|
22.28
|
2.12
|
Nil
|
|
G1
|
20240217
|
Sunny
|
Moderate
|
Mid-Flood
|
Surface
|
1
|
10:27
|
7.8
|
7.81
|
34.28
|
22.26
|
2.14
|
Nil
|
|
G1
|
20240217
|
Sunny
|
Moderate
|
Mid-Flood
|
Middle
|
11
|
10:26
|
7.66
|
7.76
|
34.24
|
22.34
|
2.15
|
Nil
|
|
G1
|
20240217
|
Sunny
|
Moderate
|
Mid-Flood
|
Middle
|
11
|
10:26
|
7.85
|
7.79
|
34.23
|
22.33
|
2.12
|
Nil
|
|
G1
|
20240217
|
Sunny
|
Moderate
|
Mid-Flood
|
Bottom
|
21
|
10:25
|
7.75
|
7.81
|
34.25
|
22.28
|
2.11
|
Nil
|
|
G1
|
20240217
|
Sunny
|
Moderate
|
Mid-Flood
|
Bottom
|
21
|
10:25
|
7.61
|
7.78
|
34.25
|
22.27
|
2.13
|
Nil
|
|
G2
|
20240217
|
Sunny
|
Moderate
|
Mid-Flood
|
Surface
|
1
|
10:38
|
8.08
|
7.84
|
33.39
|
22.01
|
2.17
|
Nil
|
|
G2
|
20240217
|
Sunny
|
Moderate
|
Mid-Flood
|
Surface
|
1
|
10:38
|
8.11
|
7.82
|
33.36
|
21.96
|
2.09
|
Nil
|
|
G2
|
20240217
|
Sunny
|
Moderate
|
Mid-Flood
|
Middle
|
10.05
|
10:37
|
8.07
|
7.85
|
33.42
|
21.98
|
2.16
|
Nil
|
|
G2
|
20240217
|
Sunny
|
Moderate
|
Mid-Flood
|
Middle
|
10.05
|
10:37
|
7.93
|
7.78
|
33.41
|
21.95
|
2.16
|
Nil
|
|
G2
|
20240217
|
Sunny
|
Moderate
|
Mid-Flood
|
Bottom
|
19.1
|
10:36
|
7.98
|
7.82
|
33.33
|
21.96
|
2.18
|
Nil
|
|
G2
|
20240217
|
Sunny
|
Moderate
|
Mid-Flood
|
Bottom
|
19.1
|
10:36
|
8.1
|
7.83
|
33.42
|
21.97
|
2.14
|
Nil
|
|
P1
|
20240217
|
Sunny
|
Moderate
|
Mid-Flood
|
Surface
|
1
|
10:50
|
8.33
|
7.61
|
32.75
|
22.21
|
2.13
|
Nil
|
|
P1
|
20240217
|
Sunny
|
Moderate
|
Mid-Flood
|
Surface
|
1
|
10:50
|
8.33
|
7.59
|
32.71
|
22.21
|
2.15
|
Nil
|
|
P1
|
20240217
|
Sunny
|
Moderate
|
Mid-Flood
|
Middle
|
3.4
|
10:49
|
8.14
|
7.64
|
32.73
|
22.12
|
2.12
|
Nil
|
|
P1
|
20240217
|
Sunny
|
Moderate
|
Mid-Flood
|
Middle
|
3.4
|
10:49
|
8.16
|
7.6
|
32.74
|
22.20
|
2.21
|
Nil
|
|
P1
|
20240217
|
Sunny
|
Moderate
|
Mid-Flood
|
Bottom
|
5.8
|
10:48
|
8.14
|
7.58
|
32.66
|
22.13
|
2.13
|
Nil
|
|
P1
|
20240217
|
Sunny
|
Moderate
|
Mid-Flood
|
Bottom
|
5.8
|
10:48
|
8.14
|
7.62
|
32.70
|
22.15
|
2.17
|
Nil
|
|
P2
|
20240217
|
Sunny
|
Moderate
|
Mid-Flood
|
Surface
|
1
|
11:04
|
8.56
|
7.71
|
33.91
|
22.06
|
1.77
|
Nil
|
|
P2
|
20240217
|
Sunny
|
Moderate
|
Mid-Flood
|
Surface
|
1
|
11:04
|
8.53
|
7.68
|
33.83
|
22.16
|
1.81
|
Nil
|
|
P2
|
20240217
|
Sunny
|
Moderate
|
Mid-Flood
|
Middle
|
7
|
11:03
|
8.54
|
7.74
|
33.86
|
22.10
|
1.82
|
Nil
|
|
P2
|
20240217
|
Sunny
|
Moderate
|
Mid-Flood
|
Middle
|
7
|
11:03
|
8.47
|
7.73
|
33.91
|
22.12
|
1.79
|
Nil
|
|
P2
|
20240217
|
Sunny
|
Moderate
|
Mid-Flood
|
Bottom
|
13
|
11:02
|
8.46
|
7.68
|
33.92
|
22.13
|
1.8
|
Nil
|
|
P2
|
20240217
|
Sunny
|
Moderate
|
Mid-Flood
|
Bottom
|
13
|
11:02
|
8.37
|
7.7
|
33.82
|
22.07
|
1.8
|
Nil
|
|
R1
|
20240217
|
Sunny
|
Moderate
|
Mid-Flood
|
Surface
|
1
|
9:50
|
8.37
|
7.65
|
34.13
|
22.19
|
2.29
|
Nil
|
|
R1
|
20240217
|
Sunny
|
Moderate
|
Mid-Flood
|
Surface
|
1
|
9:50
|
8.41
|
7.67
|
34.17
|
22.27
|
2.31
|
Nil
|
|
R1
|
20240217
|
Sunny
|
Moderate
|
Mid-Flood
|
Middle
|
4.6
|
9:49
|
8.36
|
7.65
|
34.10
|
22.18
|
2.31
|
Nil
|
|
R1
|
20240217
|
Sunny
|
Moderate
|
Mid-Flood
|
Middle
|
4.6
|
9:49
|
8.4
|
7.66
|
34.14
|
22.21
|
2.3
|
Nil
|
|
R1
|
20240217
|
Sunny
|
Moderate
|
Mid-Flood
|
Bottom
|
8.2
|
9:48
|
8.29
|
7.63
|
34.14
|
22.23
|
2.36
|
Nil
|
|
R1
|
20240217
|
Sunny
|
Moderate
|
Mid-Flood
|
Bottom
|
8.2
|
9:48
|
8.46
|
7.66
|
34.13
|
22.20
|
2.28
|
Nil
|
|
R2
|
20240217
|
Sunny
|
Moderate
|
Mid-Flood
|
Surface
|
1
|
10:11
|
8.33
|
7.82
|
33.04
|
22.09
|
2.28
|
Nil
|
|
R2
|
20240217
|
Sunny
|
Moderate
|
Mid-Flood
|
Surface
|
1
|
10:11
|
8.46
|
7.78
|
33.13
|
22.08
|
2.45
|
Nil
|
|
R2
|
20240217
|
Sunny
|
Moderate
|
Mid-Flood
|
Middle
|
4.9
|
10:10
|
8.44
|
7.83
|
33.12
|
22.11
|
2.33
|
Nil
|
|
R2
|
20240217
|
Sunny
|
Moderate
|
Mid-Flood
|
Middle
|
4.9
|
10:10
|
8.44
|
7.84
|
33.10
|
22.12
|
2.37
|
Nil
|
|
R2
|
20240217
|
Sunny
|
Moderate
|
Mid-Flood
|
Bottom
|
8.8
|
10:09
|
8.58
|
7.81
|
33.07
|
22.03
|
2.27
|
Nil
|
|
R2
|
20240217
|
Sunny
|
Moderate
|
Mid-Flood
|
Bottom
|
8.8
|
10:09
|
8.36
|
7.85
|
33.15
|
22.04
|
2.28
|
Nil
|
Water
Quality Monitoring Results
on 17 February 2024 Mid Ebb Condition
|
Location
|
Date
|
Weather
|
Sea Condition
|
Tidal
|
Water Level
|
Depth (m)
|
Time
|
DO (mg/L)
|
pH
|
Sal (ppt)
|
Temp (oC)
|
Turbidty (NTU)
|
Remark
|
|
G1
|
20240217
|
Sunny
|
Moderate
|
Mid-Ebb
|
Surface
|
1
|
16:48
|
8.36
|
7.62
|
33.16
|
21.92
|
2.72
|
Nil
|
|
G1
|
20240217
|
Sunny
|
Moderate
|
Mid-Ebb
|
Surface
|
1
|
16:48
|
8.35
|
7.62
|
33.18
|
21.82
|
2.77
|
Nil
|
|
G1
|
20240217
|
Sunny
|
Moderate
|
Mid-Ebb
|
Middle
|
10.75
|
16:47
|
8.38
|
7.65
|
33.26
|
21.90
|
2.77
|
Nil
|
|
G1
|
20240217
|
Sunny
|
Moderate
|
Mid-Ebb
|
Middle
|
10.75
|
16:47
|
8.48
|
7.61
|
33.21
|
21.85
|
2.74
|
Nil
|
|
G1
|
20240217
|
Sunny
|
Moderate
|
Mid-Ebb
|
Bottom
|
20.5
|
16:46
|
8.31
|
7.66
|
33.27
|
21.90
|
2.78
|
Nil
|
|
G1
|
20240217
|
Sunny
|
Moderate
|
Mid-Ebb
|
Bottom
|
20.5
|
16:46
|
8.4
|
7.63
|
33.26
|
21.88
|
2.74
|
Nil
|
|
G2
|
20240217
|
Sunny
|
Moderate
|
Mid-Ebb
|
Surface
|
1
|
17:01
|
8.41
|
7.8
|
33.20
|
21.99
|
2.33
|
Nil
|
|
G2
|
20240217
|
Sunny
|
Moderate
|
Mid-Ebb
|
Surface
|
1
|
17:01
|
8.6
|
7.79
|
33.17
|
22.04
|
2.27
|
Nil
|
|
G2
|
20240217
|
Sunny
|
Moderate
|
Mid-Ebb
|
Middle
|
10.9
|
17:00
|
8.48
|
7.8
|
33.13
|
21.93
|
2.32
|
Nil
|
|
G2
|
20240217
|
Sunny
|
Moderate
|
Mid-Ebb
|
Middle
|
10.9
|
17:00
|
8.57
|
7.83
|
33.16
|
21.93
|
2.35
|
Nil
|
|
G2
|
20240217
|
Sunny
|
Moderate
|
Mid-Ebb
|
Bottom
|
20.8
|
16:59
|
8.37
|
7.84
|
33.15
|
22.01
|
2.36
|
Nil
|
|
G2
|
20240217
|
Sunny
|
Moderate
|
Mid-Ebb
|
Bottom
|
20.8
|
16:59
|
8.54
|
7.81
|
33.20
|
21.96
|
2.36
|
Nil
|
|
P1
|
20240217
|
Sunny
|
Moderate
|
Mid-Ebb
|
Surface
|
1
|
17:13
|
7.49
|
7.71
|
33.89
|
22.07
|
2.14
|
Nil
|
|
P1
|
20240217
|
Sunny
|
Moderate
|
Mid-Ebb
|
Surface
|
1
|
17:13
|
7.53
|
7.69
|
33.80
|
22.08
|
2.1
|
Nil
|
|
P1
|
20240217
|
Sunny
|
Moderate
|
Mid-Ebb
|
Middle
|
3.45
|
17:12
|
7.39
|
7.7
|
33.81
|
22.11
|
2.16
|
Nil
|
|
P1
|
20240217
|
Sunny
|
Moderate
|
Mid-Ebb
|
Middle
|
3.45
|
17:12
|
7.56
|
7.7
|
33.81
|
22.02
|
2.09
|
Nil
|
|
P1
|
20240217
|
Sunny
|
Moderate
|
Mid-Ebb
|
Bottom
|
5.9
|
17:11
|
7.52
|
7.74
|
33.82
|
22.07
|
2.11
|
Nil
|
|
P1
|
20240217
|
Sunny
|
Moderate
|
Mid-Ebb
|
Bottom
|
5.9
|
17:11
|
7.57
|
7.7
|
33.81
|
22.10
|
2.12
|
Nil
|
|
P2
|
20240217
|
Sunny
|
Moderate
|
Mid-Ebb
|
Surface
|
1
|
17:26
|
8.33
|
7.84
|
34.12
|
22.09
|
2.45
|
Nil
|
|
P2
|
20240217
|
Sunny
|
Moderate
|
Mid-Ebb
|
Surface
|
1
|
17:26
|
8.55
|
7.78
|
34.07
|
22.02
|
2.39
|
Nil
|
|
P2
|
20240217
|
Sunny
|
Moderate
|
Mid-Ebb
|
Middle
|
6.85
|
17:25
|
8.31
|
7.8
|
34.05
|
22.06
|
2.39
|
Nil
|
|
P2
|
20240217
|
Sunny
|
Moderate
|
Mid-Ebb
|
Middle
|
6.85
|
17:25
|
8.38
|
7.84
|
34.08
|
22.07
|
2.44
|
Nil
|
|
P2
|
20240217
|
Sunny
|
Moderate
|
Mid-Ebb
|
Bottom
|
12.7
|
17:24
|
8.4
|
7.78
|
34.08
|
22.01
|
2.46
|
Nil
|
|
P2
|
20240217
|
Sunny
|
Moderate
|
Mid-Ebb
|
Bottom
|
12.7
|
17:24
|
8.44
|
7.78
|
34.09
|
22.03
|
2.41
|
Nil
|
|
R1
|
20240217
|
Sunny
|
Moderate
|
Mid-Ebb
|
Surface
|
1
|
16:16
|
7.54
|
7.68
|
33.17
|
22.30
|
2.64
|
Nil
|
|
R1
|
20240217
|
Sunny
|
Moderate
|
Mid-Ebb
|
Surface
|
1
|
16:16
|
7.68
|
7.66
|
33.11
|
22.24
|
2.64
|
Nil
|
|
R1
|
20240217
|
Sunny
|
Moderate
|
Mid-Ebb
|
Middle
|
4.4
|
16:15
|
7.74
|
7.63
|
33.13
|
22.26
|
2.6
|
Nil
|
|
R1
|
20240217
|
Sunny
|
Moderate
|
Mid-Ebb
|
Middle
|
4.4
|
16:15
|
7.7
|
7.69
|
33.14
|
22.29
|
2.6
|
Nil
|
|
R1
|
20240217
|
Sunny
|
Moderate
|
Mid-Ebb
|
Bottom
|
7.8
|
16:14
|
7.57
|
7.63
|
33.07
|
22.30
|
2.65
|
Nil
|
|
R1
|
20240217
|
Sunny
|
Moderate
|
Mid-Ebb
|
Bottom
|
7.8
|
16:14
|
7.73
|
7.67
|
33.17
|
22.23
|
2.58
|
Nil
|
|
R2
|
20240217
|
Sunny
|
Moderate
|
Mid-Ebb
|
Surface
|
1
|
16:33
|
8.13
|
7.82
|
32.79
|
22.14
|
2.89
|
Nil
|
|
R2
|
20240217
|
Sunny
|
Moderate
|
Mid-Ebb
|
Surface
|
1
|
16:33
|
8.24
|
7.81
|
32.74
|
22.19
|
2.86
|
Nil
|
|
R2
|
20240217
|
Sunny
|
Moderate
|
Mid-Ebb
|
Middle
|
4.5
|
16:32
|
8.32
|
7.85
|
32.76
|
22.22
|
2.85
|
Nil
|
|
R2
|
20240217
|
Sunny
|
Moderate
|
Mid-Ebb
|
Middle
|
4.5
|
16:32
|
8.27
|
7.83
|
32.83
|
22.18
|
2.86
|
Nil
|
|
R2
|
20240217
|
Sunny
|
Moderate
|
Mid-Ebb
|
Bottom
|
8
|
16:31
|
8.26
|
7.85
|
32.75
|
22.24
|
2.98
|
Nil
|
|
R2
|
20240217
|
Sunny
|
Moderate
|
Mid-Ebb
|
Bottom
|
8
|
16:31
|
8.14
|
7.85
|
32.80
|
22.22
|
2.97
|
Nil
|
Water
Quality Monitoring Results
on 24 February
2024 Mid Flood
Condition
|
Location
|
Date
|
Weather
|
Sea Condition
|
Tidal
|
Water Level
|
Depth (m)
|
Time
|
DO (mg/L)
|
pH
|
Sal (ppt)
|
Temp (oC)
|
Turbidty (NTU)
|
Remark
|
|
G1
|
20240224
|
Cloudy
|
Moderate
|
Mid-Flood
|
Surface
|
1
|
8:57
|
7.5
|
7.68
|
33.28
|
22.76
|
2.17
|
Nil
|
|
G1
|
20240224
|
Cloudy
|
Moderate
|
Mid-Flood
|
Surface
|
1
|
8:57
|
7.37
|
7.7
|
33.27
|
22.76
|
2.16
|
Nil
|
|
G1
|
20240224
|
Cloudy
|
Moderate
|
Mid-Flood
|
Middle
|
10.55
|
8:56
|
7.42
|
7.77
|
33.24
|
22.73
|
2.19
|
Nil
|
|
G1
|
20240224
|
Cloudy
|
Moderate
|
Mid-Flood
|
Middle
|
10.55
|
8:56
|
7.36
|
7.77
|
33.19
|
22.71
|
2.17
|
Nil
|
|
G1
|
20240224
|
Cloudy
|
Moderate
|
Mid-Flood
|
Bottom
|
20.1
|
8:55
|
7.49
|
7.75
|
33.28
|
22.79
|
2.15
|
Nil
|
|
G1
|
20240224
|
Cloudy
|
Moderate
|
Mid-Flood
|
Bottom
|
20.1
|
8:55
|
7.53
|
7.72
|
33.23
|
22.74
|
2.22
|
Nil
|
|
G2
|
20240224
|
Cloudy
|
Moderate
|
Mid-Flood
|
Surface
|
1
|
9:10
|
8.26
|
7.79
|
33.39
|
22.94
|
2.57
|
Nil
|
|
G2
|
20240224
|
Cloudy
|
Moderate
|
Mid-Flood
|
Surface
|
1
|
9:10
|
8.13
|
7.74
|
33.39
|
22.87
|
2.55
|
Nil
|
|
G2
|
20240224
|
Cloudy
|
Moderate
|
Mid-Flood
|
Middle
|
10.15
|
9:09
|
8.15
|
7.72
|
33.37
|
22.95
|
2.56
|
Nil
|
|
G2
|
20240224
|
Cloudy
|
Moderate
|
Mid-Flood
|
Middle
|
10.15
|
9:09
|
8.37
|
7.9
|
33.37
|
22.86
|
2.6
|
Nil
|
|
G2
|
20240224
|
Cloudy
|
Moderate
|
Mid-Flood
|
Bottom
|
19.3
|
9:08
|
8.3
|
7.83
|
33.38
|
22.91
|
2.54
|
Nil
|
|
G2
|
20240224
|
Cloudy
|
Moderate
|
Mid-Flood
|
Bottom
|
19.3
|
9:08
|
8.32
|
7.72
|
33.30
|
22.93
|
2.61
|
Nil
|
|
P1
|
20240224
|
Cloudy
|
Moderate
|
Mid-Flood
|
Surface
|
1
|
9:24
|
7.4
|
7.86
|
33.95
|
23.04
|
2.03
|
Nil
|
|
P1
|
20240224
|
Cloudy
|
Moderate
|
Mid-Flood
|
Surface
|
1
|
9:24
|
7.41
|
7.91
|
33.92
|
22.98
|
2.1
|
Nil
|
|
P1
|
20240224
|
Cloudy
|
Moderate
|
Mid-Flood
|
Middle
|
3.7
|
9:23
|
7.26
|
7.75
|
33.92
|
22.99
|
2.08
|
Nil
|
|
P1
|
20240224
|
Cloudy
|
Moderate
|
Mid-Flood
|
Middle
|
3.7
|
9:23
|
7.27
|
7.85
|
33.92
|
23.03
|
2.08
|
Nil
|
|
P1
|
20240224
|
Cloudy
|
Moderate
|
Mid-Flood
|
Bottom
|
6.4
|
9:22
|
7.41
|
7.82
|
33.95
|
22.99
|
2.01
|
Nil
|
|
P1
|
20240224
|
Cloudy
|
Moderate
|
Mid-Flood
|
Bottom
|
6.4
|
9:22
|
7.39
|
7.86
|
33.94
|
23.00
|
2.05
|
Nil
|
|
P2
|
20240224
|
Cloudy
|
Moderate
|
Mid-Flood
|
Surface
|
1
|
9:39
|
7.43
|
7.69
|
33.92
|
22.69
|
2.24
|
Nil
|
|
P2
|
20240224
|
Cloudy
|
Moderate
|
Mid-Flood
|
Surface
|
1
|
9:39
|
7.49
|
7.82
|
33.97
|
22.72
|
2.16
|
Nil
|
|
P2
|
20240224
|
Cloudy
|
Moderate
|
Mid-Flood
|
Middle
|
6.85
|
9:38
|
7.45
|
7.87
|
33.98
|
22.68
|
2.16
|
Nil
|
|
P2
|
20240224
|
Cloudy
|
Moderate
|
Mid-Flood
|
Middle
|
6.85
|
9:38
|
7.62
|
7.81
|
33.97
|
22.80
|
2.23
|
Nil
|
|
P2
|
20240224
|
Cloudy
|
Moderate
|
Mid-Flood
|
Bottom
|
12.7
|
9:37
|
7.54
|
7.82
|
33.92
|
22.70
|
2.24
|
Nil
|
|
P2
|
20240224
|
Cloudy
|
Moderate
|
Mid-Flood
|
Bottom
|
12.7
|
9:37
|
7.64
|
7.78
|
34.00
|
22.74
|
2.21
|
Nil
|
|
R1
|
20240224
|
Cloudy
|
Moderate
|
Mid-Flood
|
Surface
|
1
|
8:03
|
7.67
|
8.05
|
33.20
|
23.02
|
2.45
|
Nil
|
|
R1
|
20240224
|
Cloudy
|
Moderate
|
Mid-Flood
|
Surface
|
1
|
8:03
|
7.69
|
8.02
|
33.22
|
22.91
|
2.57
|
Nil
|
|
R1
|
20240224
|
Cloudy
|
Moderate
|
Mid-Flood
|
Middle
|
4.75
|
8:02
|
7.53
|
7.95
|
33.20
|
22.96
|
2.62
|
Nil
|
|
R1
|
20240224
|
Cloudy
|
Moderate
|
Mid-Flood
|
Middle
|
4.75
|
8:02
|
7.63
|
8.02
|
33.20
|
23.00
|
2.58
|
Nil
|
|
R1
|
20240224
|
Cloudy
|
Moderate
|
Mid-Flood
|
Bottom
|
8.5
|
8:01
|
7.71
|
7.97
|
33.16
|
22.98
|
2.62
|
Nil
|
|
R1
|
20240224
|
Cloudy
|
Moderate
|
Mid-Flood
|
Bottom
|
8.5
|
8:01
|
7.71
|
7.96
|
33.13
|
23.03
|
2.51
|
Nil
|
|
R2
|
20240224
|
Cloudy
|
Moderate
|
Mid-Flood
|
Surface
|
1
|
8:22
|
8.44
|
7.89
|
33.47
|
22.86
|
2.48
|
Nil
|
|
R2
|
20240224
|
Cloudy
|
Moderate
|
Mid-Flood
|
Surface
|
1
|
8:22
|
8.47
|
7.88
|
33.47
|
22.84
|
2.49
|
Nil
|
|
R2
|
20240224
|
Cloudy
|
Moderate
|
Mid-Flood
|
Middle
|
4.6
|
8:21
|
8.36
|
7.93
|
33.48
|
22.97
|
2.42
|
Nil
|
|
R2
|
20240224
|
Cloudy
|
Moderate
|
Mid-Flood
|
Middle
|
4.6
|
8:21
|
8.29
|
7.81
|
33.47
|
22.96
|
2.46
|
Nil
|
|
R2
|
20240224
|
Cloudy
|
Moderate
|
Mid-Flood
|
Bottom
|
8.2
|
8:20
|
8.35
|
7.95
|
33.54
|
22.97
|
2.49
|
Nil
|
|
R2
|
20240224
|
Cloudy
|
Moderate
|
Mid-Flood
|
Bottom
|
8.2
|
8:20
|
8.42
|
8
|
33.46
|
22.97
|
2.55
|
Nil
|
Water Quality Monitoring Results on 24 February
2024 Mid Ebb Condition
|
Location
|
Date
|
Weather
|
Sea Condition
|
Tidal
|
Water Level
|
Depth (m)
|
Time
|
DO (mg/L)
|
pH
|
Sal (ppt)
|
Temp (oC)
|
Turbidty (NTU)
|
Remark
|
|
G1
|
20240224
|
Cloudy
|
Moderate
|
Mid-Ebb
|
Surface
|
1
|
12:01
|
8.45
|
7.85
|
32.49
|
23.17
|
2.07
|
Nil
|
|
G1
|
20240224
|
Cloudy
|
Moderate
|
Mid-Ebb
|
Surface
|
1
|
12:01
|
8.44
|
7.85
|
32.39
|
23.18
|
2.16
|
Nil
|
|
G1
|
20240224
|
Cloudy
|
Moderate
|
Mid-Ebb
|
Middle
|
10.1
|
12:00
|
8.42
|
7.92
|
32.49
|
23.14
|
2.16
|
Nil
|
|
G1
|
20240224
|
Cloudy
|
Moderate
|
Mid-Ebb
|
Middle
|
10.1
|
12:00
|
8.38
|
7.85
|
32.45
|
23.14
|
2.13
|
Nil
|
|
G1
|
20240224
|
Cloudy
|
Moderate
|
Mid-Ebb
|
Bottom
|
19.2
|
11:59
|
8.46
|
7.92
|
32.42
|
23.17
|
2.08
|
Nil
|
|
G1
|
20240224
|
Cloudy
|
Moderate
|
Mid-Ebb
|
Bottom
|
19.2
|
11:59
|
8.49
|
7.89
|
32.43
|
23.18
|
2.12
|
Nil
|
|
G2
|
20240224
|
Cloudy
|
Moderate
|
Mid-Ebb
|
Surface
|
1
|
12:11
|
7.94
|
7.83
|
33.75
|
23.29
|
1.7
|
Nil
|
|
G2
|
20240224
|
Cloudy
|
Moderate
|
Mid-Ebb
|
Surface
|
1
|
12:11
|
7.96
|
7.76
|
33.78
|
23.27
|
1.7
|
Nil
|
|
G2
|
20240224
|
Cloudy
|
Moderate
|
Mid-Ebb
|
Middle
|
10.85
|
12:10
|
7.9
|
7.77
|
33.78
|
23.30
|
1.72
|
Nil
|
|
G2
|
20240224
|
Cloudy
|
Moderate
|
Mid-Ebb
|
Middle
|
10.85
|
12:10
|
7.86
|
7.79
|
33.82
|
23.30
|
1.67
|
Nil
|
|
G2
|
20240224
|
Cloudy
|
Moderate
|
Mid-Ebb
|
Bottom
|
20.7
|
12:09
|
7.88
|
7.8
|
33.80
|
23.27
|
1.76
|
Nil
|
|
G2
|
20240224
|
Cloudy
|
Moderate
|
Mid-Ebb
|
Bottom
|
20.7
|
12:09
|
7.97
|
7.78
|
33.76
|
23.31
|
1.71
|
Nil
|
|
P1
|
20240224
|
Cloudy
|
Moderate
|
Mid-Ebb
|
Surface
|
1
|
12:23
|
7.78
|
8.02
|
32.54
|
23.26
|
2
|
Nil
|
|
P1
|
20240224
|
Cloudy
|
Moderate
|
Mid-Ebb
|
Surface
|
1
|
12:23
|
7.77
|
8.03
|
32.51
|
23.21
|
2.05
|
Nil
|
|
P1
|
20240224
|
Cloudy
|
Moderate
|
Mid-Ebb
|
Middle
|
3.35
|
12:22
|
7.73
|
7.98
|
32.45
|
23.26
|
2.09
|
Nil
|
|
P1
|
20240224
|
Cloudy
|
Moderate
|
Mid-Ebb
|
Middle
|
3.35
|
12:22
|
7.78
|
7.95
|
32.54
|
23.26
|
2.02
|
Nil
|
|
P1
|
20240224
|
Cloudy
|
Moderate
|
Mid-Ebb
|
Bottom
|
5.7
|
12:21
|
7.82
|
8
|
32.52
|
23.25
|
2.02
|
Nil
|
|
P1
|
20240224
|
Cloudy
|
Moderate
|
Mid-Ebb
|
Bottom
|
5.7
|
12:21
|
7.78
|
7.9
|
32.46
|
23.28
|
2.07
|
Nil
|
|
P2
|
20240224
|
Cloudy
|
Moderate
|
Mid-Ebb
|
Surface
|
1
|
12:37
|
7.89
|
7.73
|
33.73
|
23.08
|
2.2
|
Nil
|
|
P2
|
20240224
|
Cloudy
|
Moderate
|
Mid-Ebb
|
Surface
|
1
|
12:37
|
7.96
|
7.84
|
33.68
|
23.15
|
2.24
|
Nil
|
|
P2
|
20240224
|
Cloudy
|
Moderate
|
Mid-Ebb
|
Middle
|
6.95
|
12:36
|
7.99
|
7.83
|
33.63
|
23.09
|
2.22
|
Nil
|
|
P2
|
20240224
|
Cloudy
|
Moderate
|
Mid-Ebb
|
Middle
|
6.95
|
12:36
|
7.95
|
7.71
|
33.71
|
23.12
|
2.19
|
Nil
|
|
P2
|
20240224
|
Cloudy
|
Moderate
|
Mid-Ebb
|
Bottom
|
12.9
|
12:35
|
7.95
|
7.81
|
33.67
|
23.08
|
2.2
|
Nil
|
|
P2
|
20240224
|
Cloudy
|
Moderate
|
Mid-Ebb
|
Bottom
|
12.9
|
12:35
|
7.93
|
7.83
|
33.67
|
23.11
|
2.27
|
Nil
|
|
R1
|
20240224
|
Cloudy
|
Moderate
|
Mid-Ebb
|
Surface
|
1
|
11:14
|
7.63
|
7.98
|
33.47
|
23.05
|
2.37
|
Nil
|
|
R1
|
20240224
|
Cloudy
|
Moderate
|
Mid-Ebb
|
Surface
|
1
|
11:14
|
7.63
|
7.88
|
33.43
|
23.10
|
2.32
|
Nil
|
|
R1
|
20240224
|
Cloudy
|
Moderate
|
Mid-Ebb
|
Middle
|
4.45
|
11:13
|
7.74
|
7.93
|
33.43
|
23.07
|
2.54
|
Nil
|
|
R1
|
20240224
|
Cloudy
|
Moderate
|
Mid-Ebb
|
Middle
|
4.45
|
11:13
|
7.73
|
7.9
|
33.40
|
23.02
|
2.44
|
Nil
|
|
R1
|
20240224
|
Cloudy
|
Moderate
|
Mid-Ebb
|
Bottom
|
7.9
|
11:12
|
7.66
|
7.97
|
33.37
|
23.09
|
2.58
|
Nil
|
|
R1
|
20240224
|
Cloudy
|
Moderate
|
Mid-Ebb
|
Bottom
|
7.9
|
11:12
|
7.67
|
7.97
|
33.44
|
23.07
|
2.69
|
Nil
|
|
R2
|
20240224
|
Cloudy
|
Moderate
|
Mid-Ebb
|
Surface
|
1
|
11:36
|
8.6
|
7.9
|
32.35
|
23.15
|
2.34
|
Nil
|
|
R2
|
20240224
|
Cloudy
|
Moderate
|
Mid-Ebb
|
Surface
|
1
|
11:36
|
8.59
|
7.9
|
32.42
|
23.07
|
2.37
|
Nil
|
|
R2
|
20240224
|
Cloudy
|
Moderate
|
Mid-Ebb
|
Middle
|
4.5
|
11:35
|
8.62
|
7.82
|
32.46
|
23.11
|
2.46
|
Nil
|
|
R2
|
20240224
|
Cloudy
|
Moderate
|
Mid-Ebb
|
Middle
|
4.5
|
11:35
|
8.65
|
7.81
|
32.38
|
23.06
|
2.35
|
Nil
|
|
R2
|
20240224
|
Cloudy
|
Moderate
|
Mid-Ebb
|
Bottom
|
8
|
11:34
|
8.65
|
7.83
|
32.35
|
23.06
|
2.49
|
Nil
|
|
R2
|
20240224
|
Cloudy
|
Moderate
|
Mid-Ebb
|
Bottom
|
8
|
11:34
|
8.64
|
7.93
|
32.42
|
23.13
|
2.58
|
Nil
|
APPENDIX
B LABORATORY TEST REPORTS
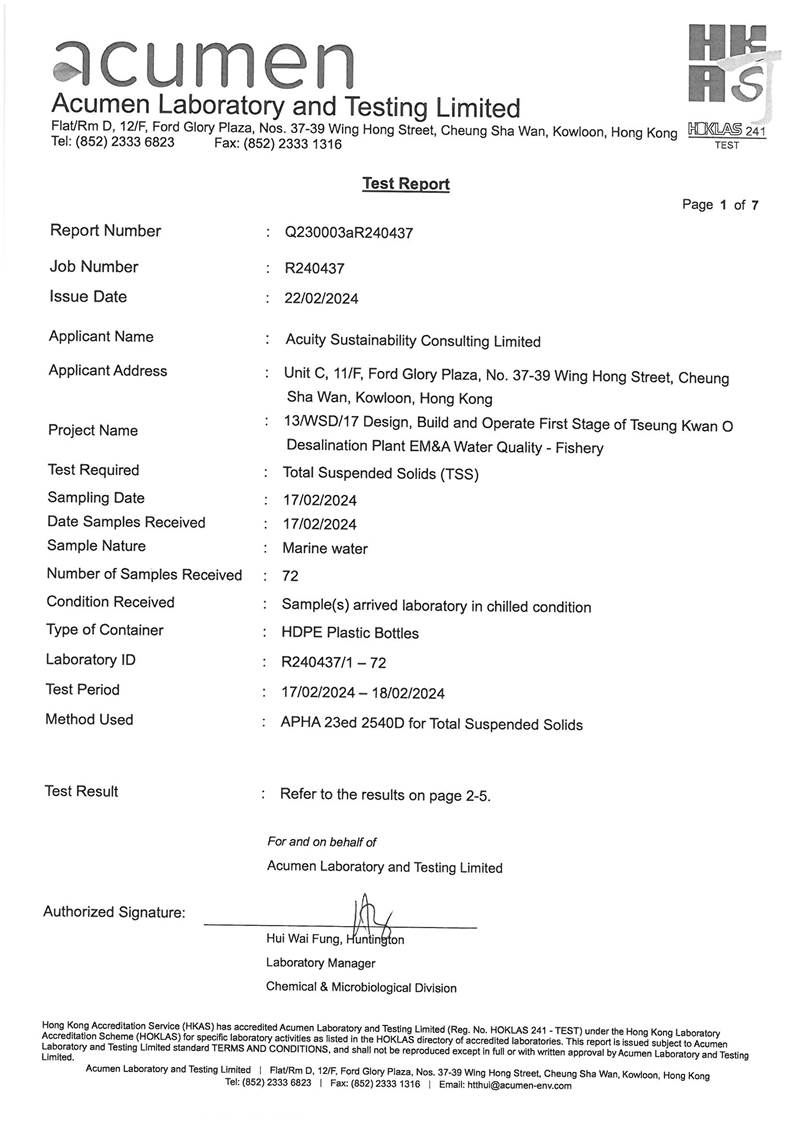
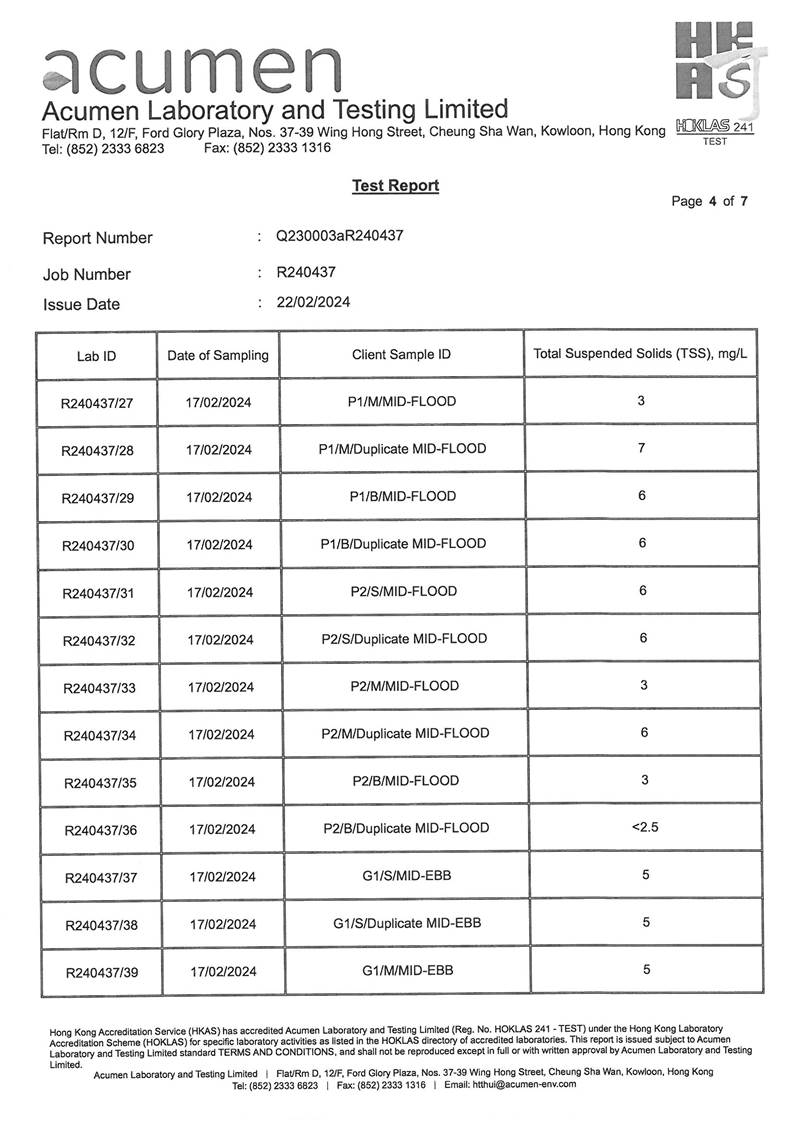
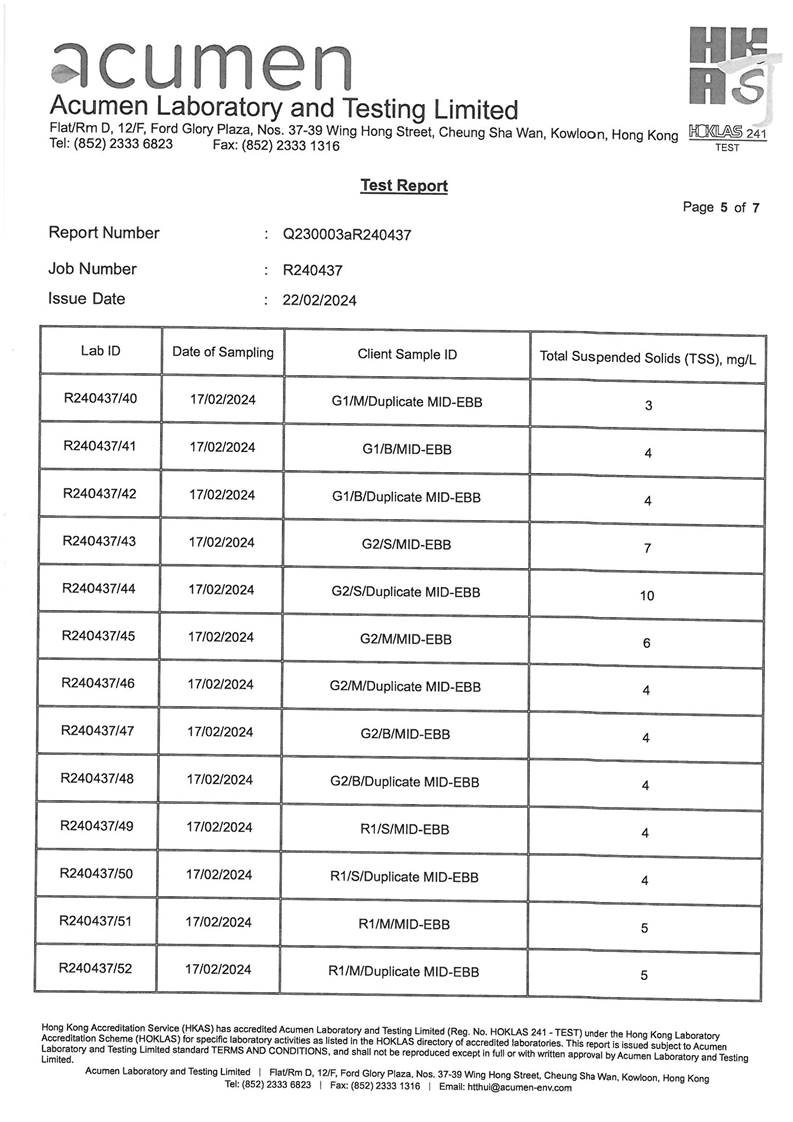
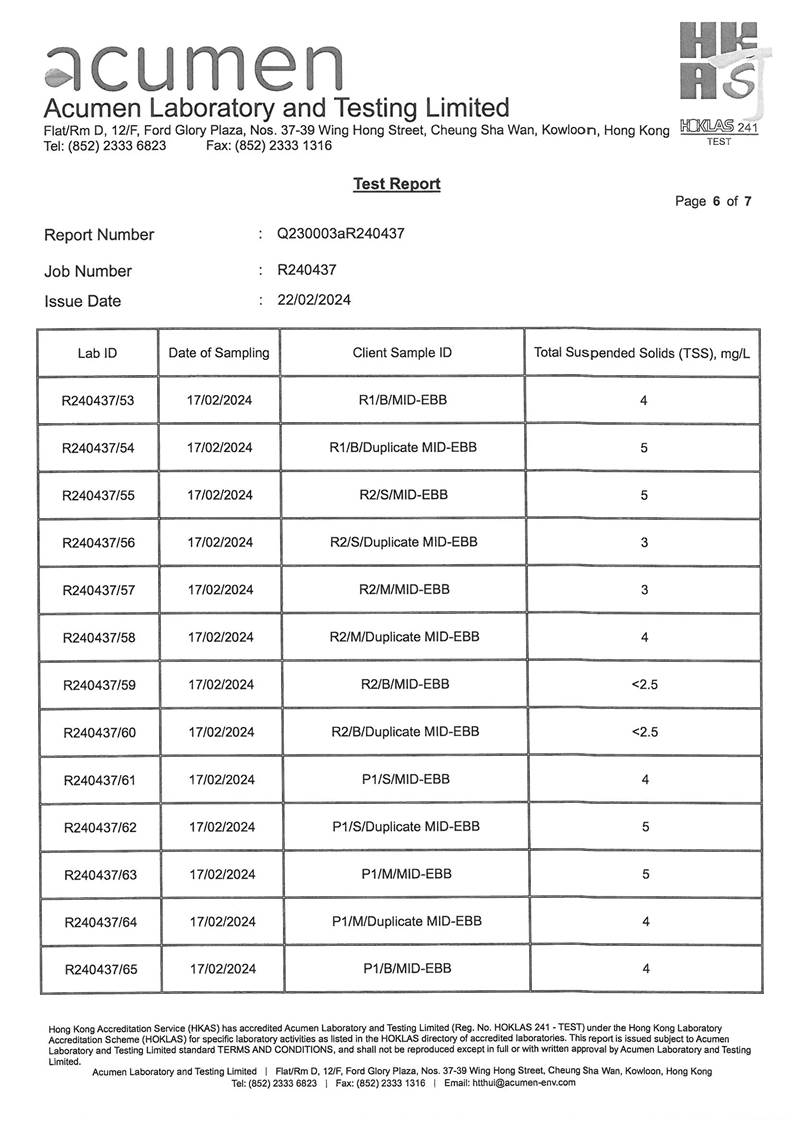
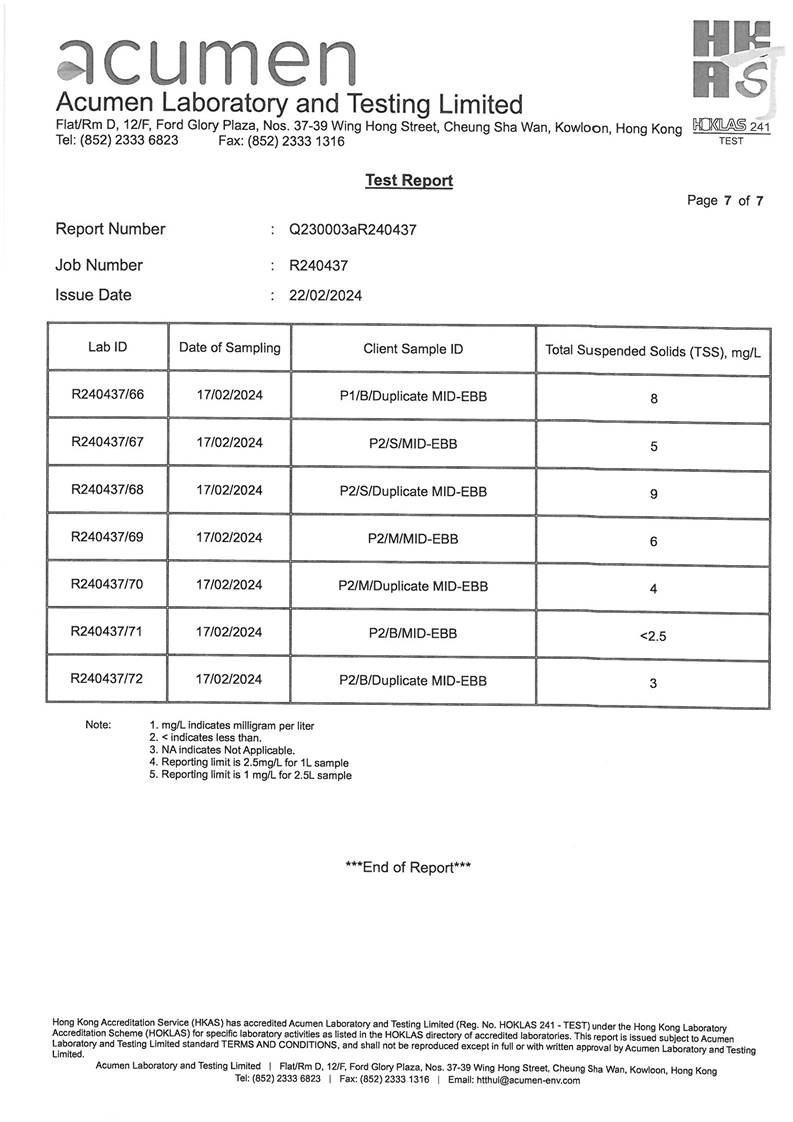
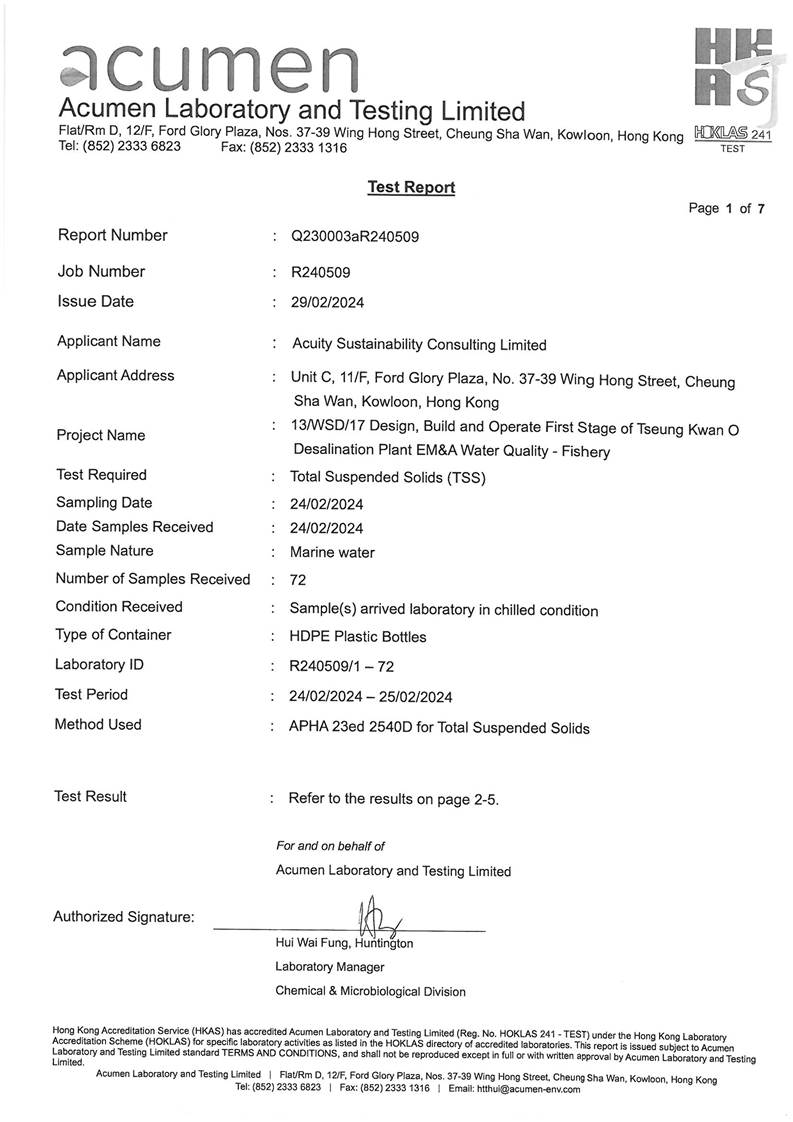
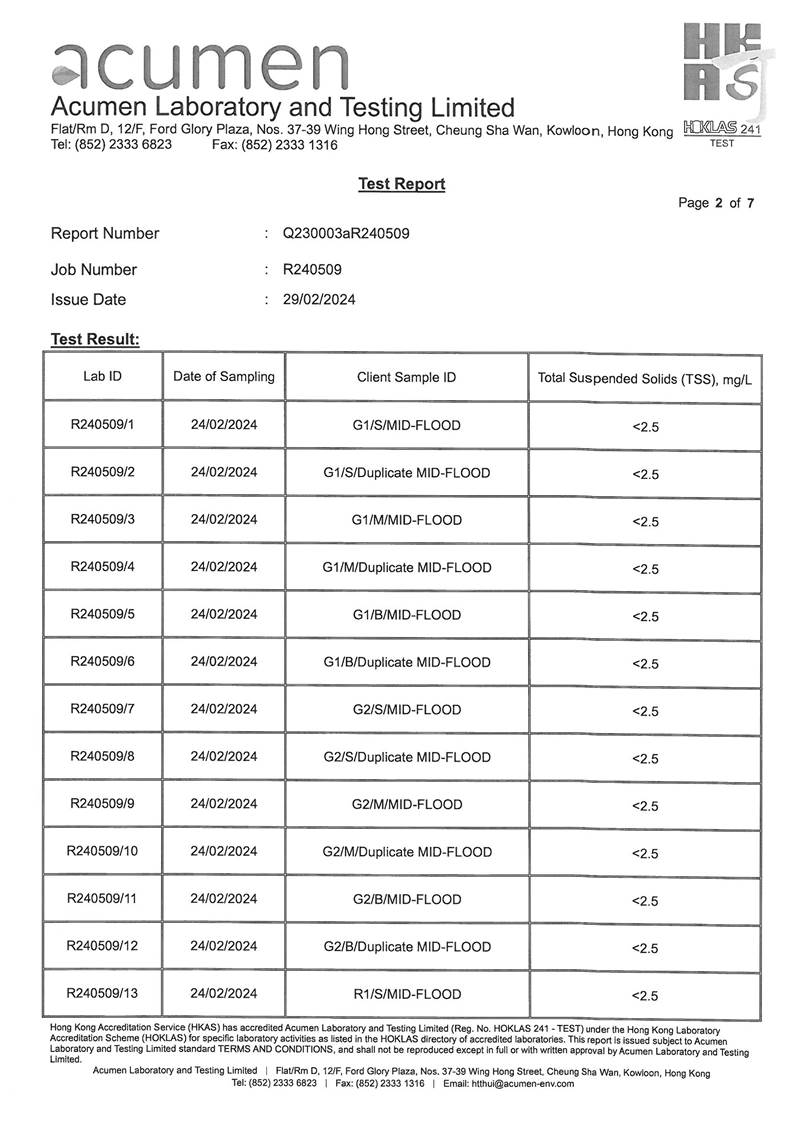
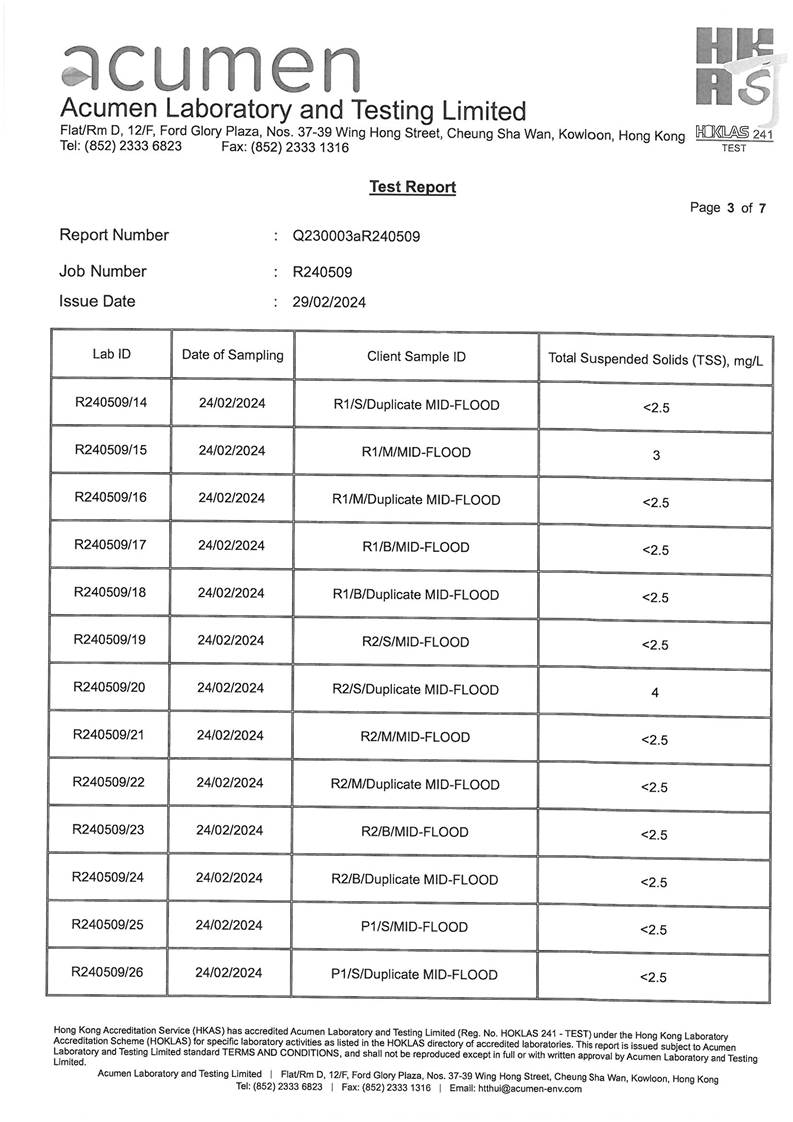
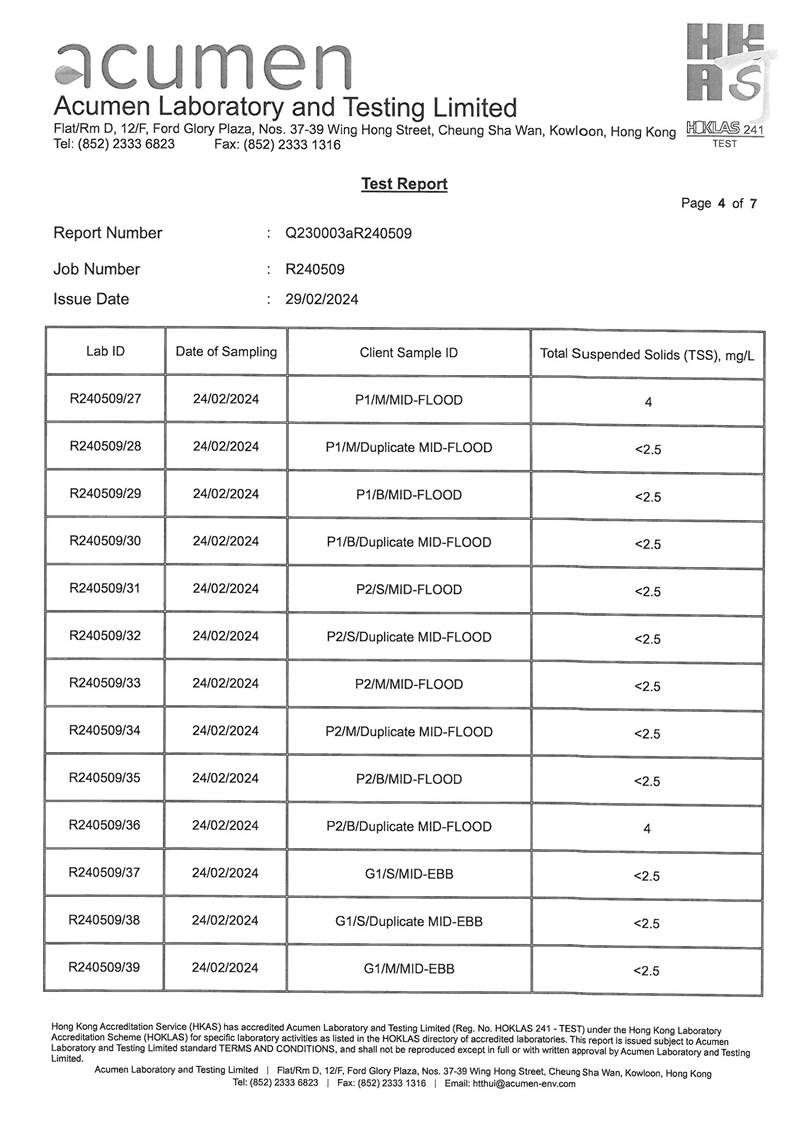


Appendix J
Site Inspection Proforma
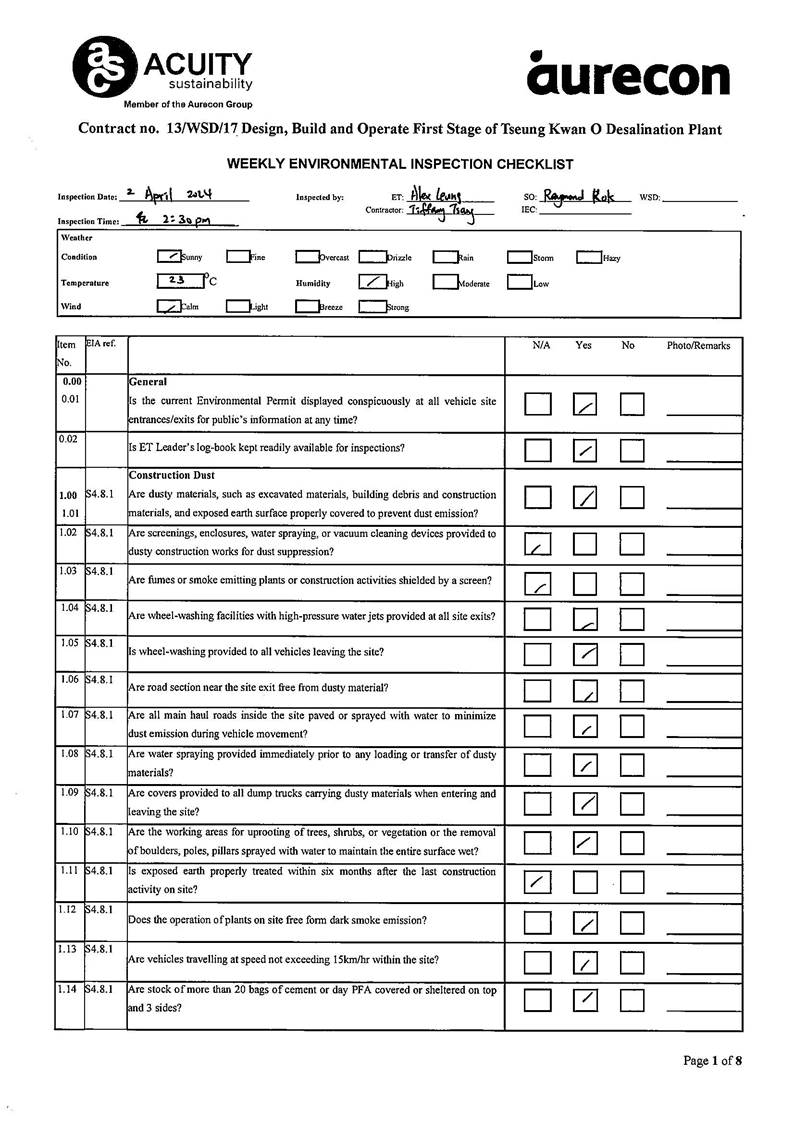
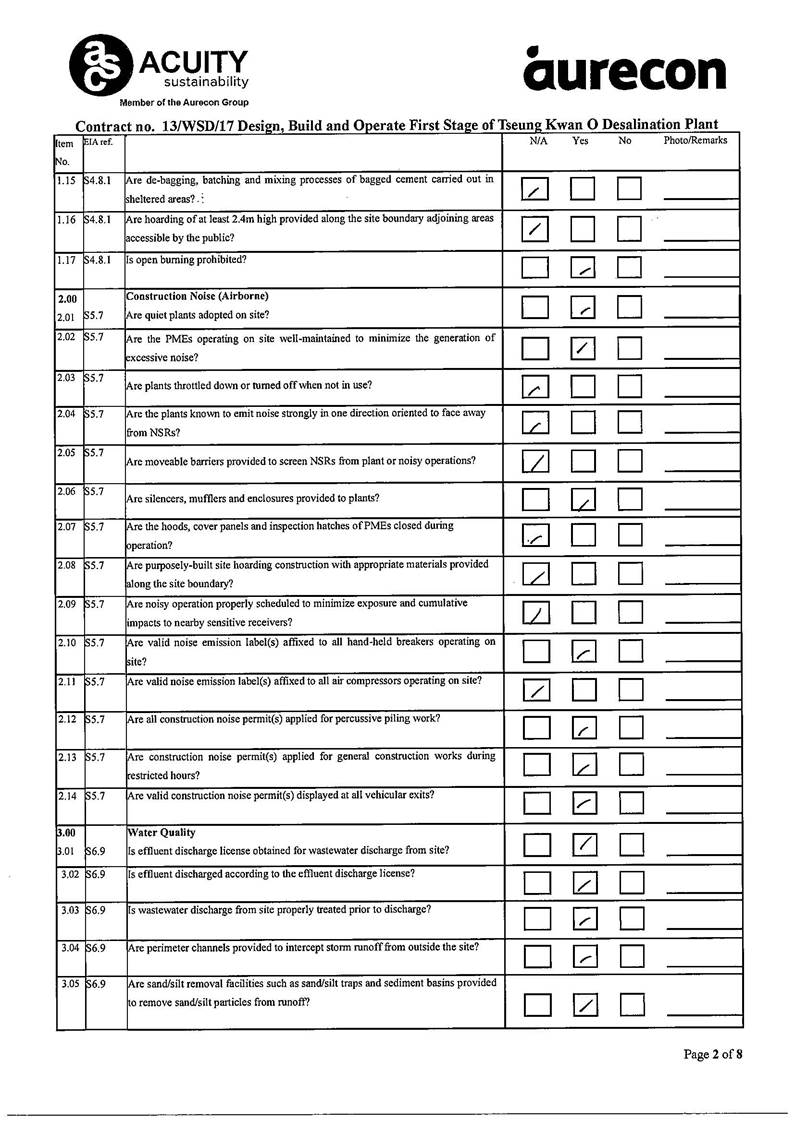
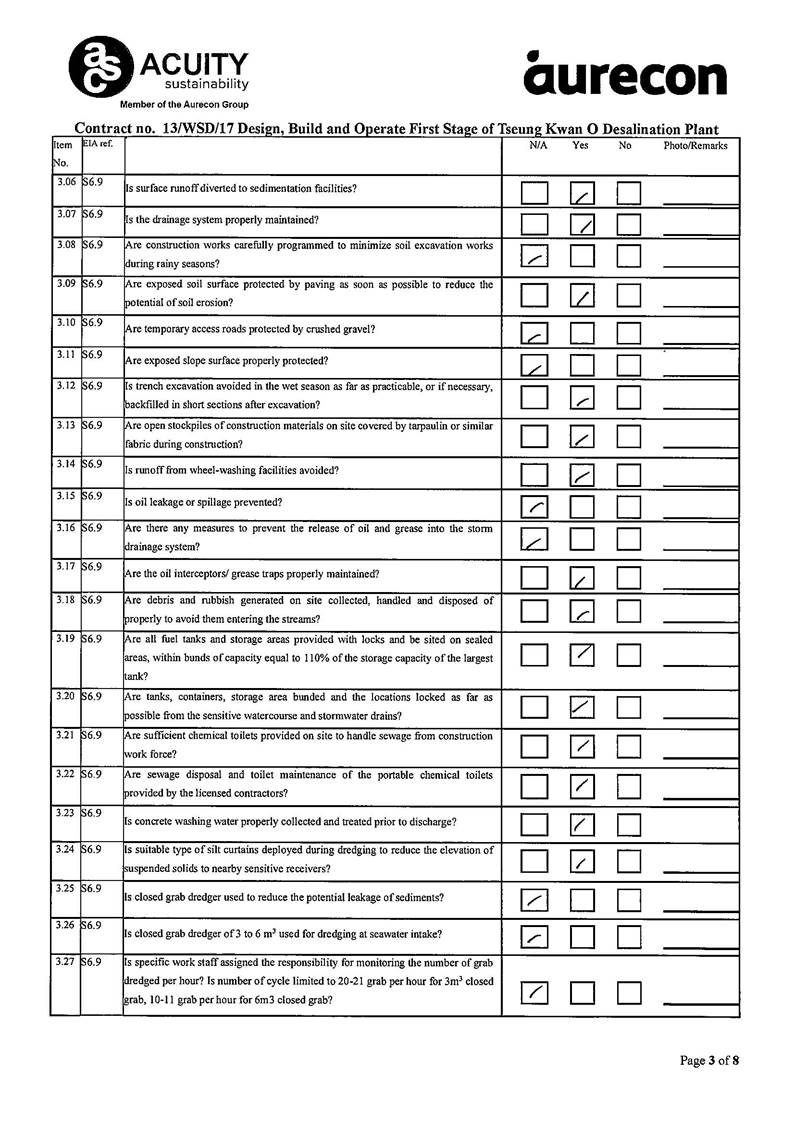
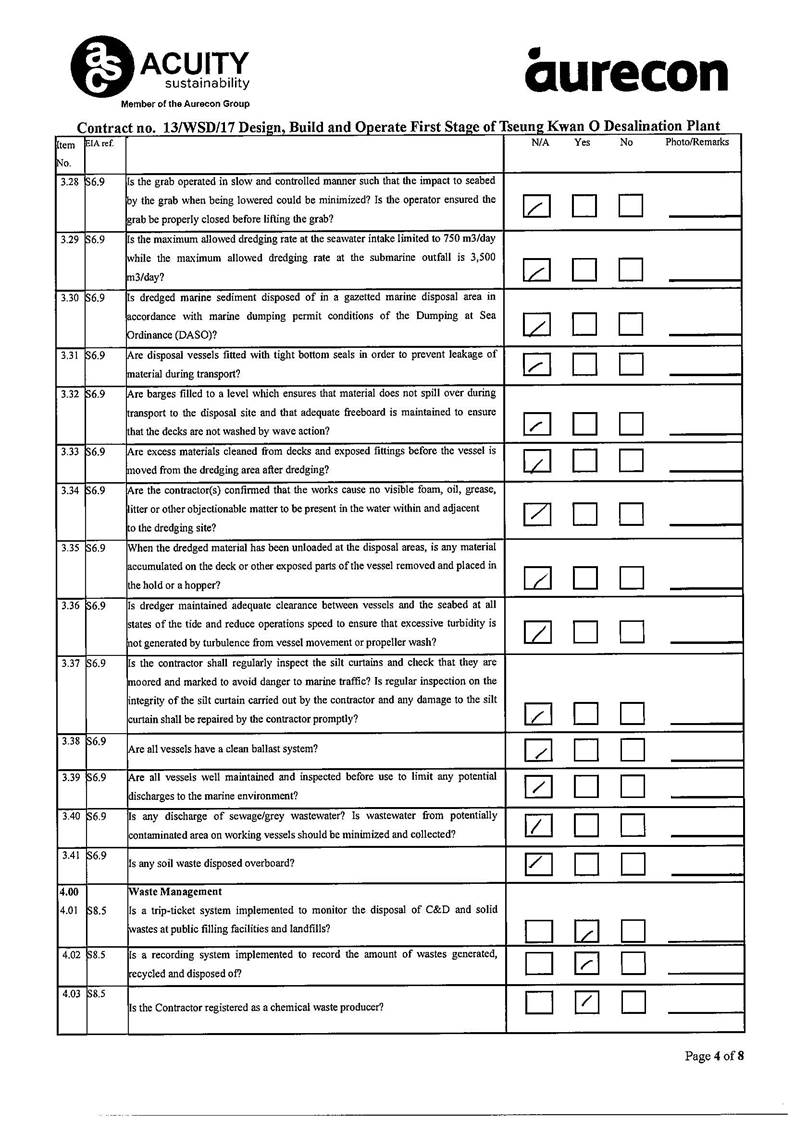
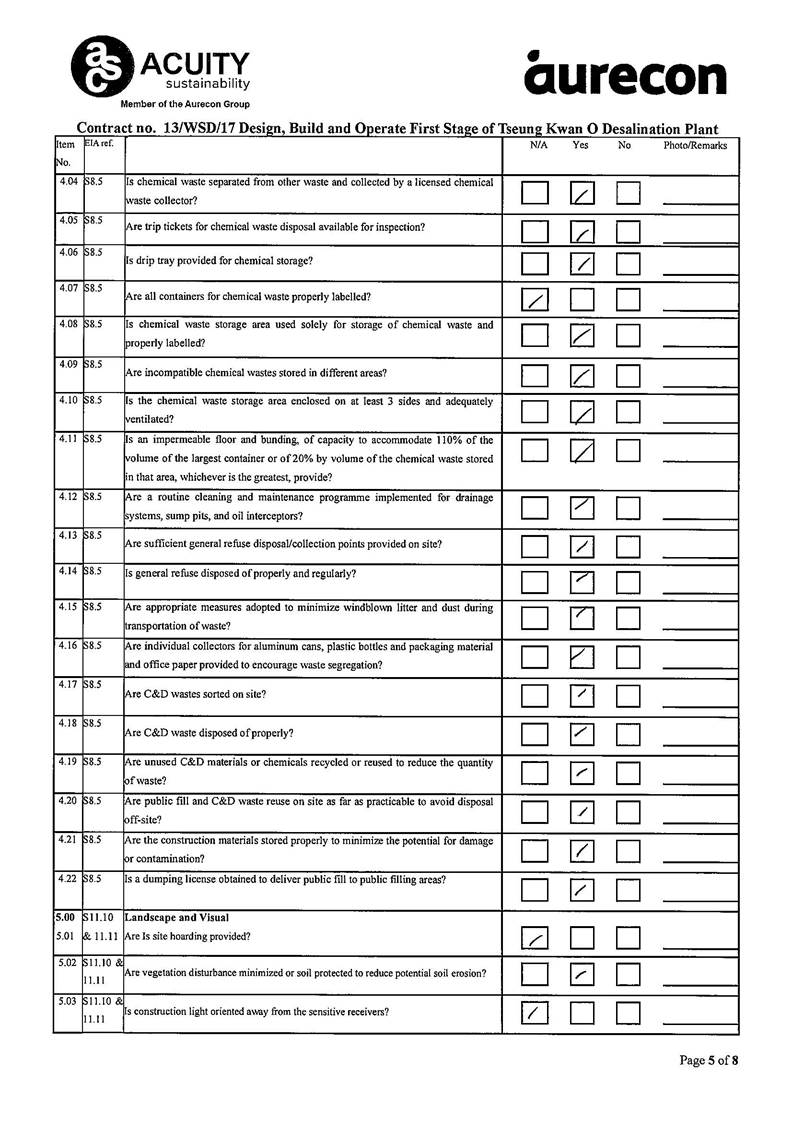
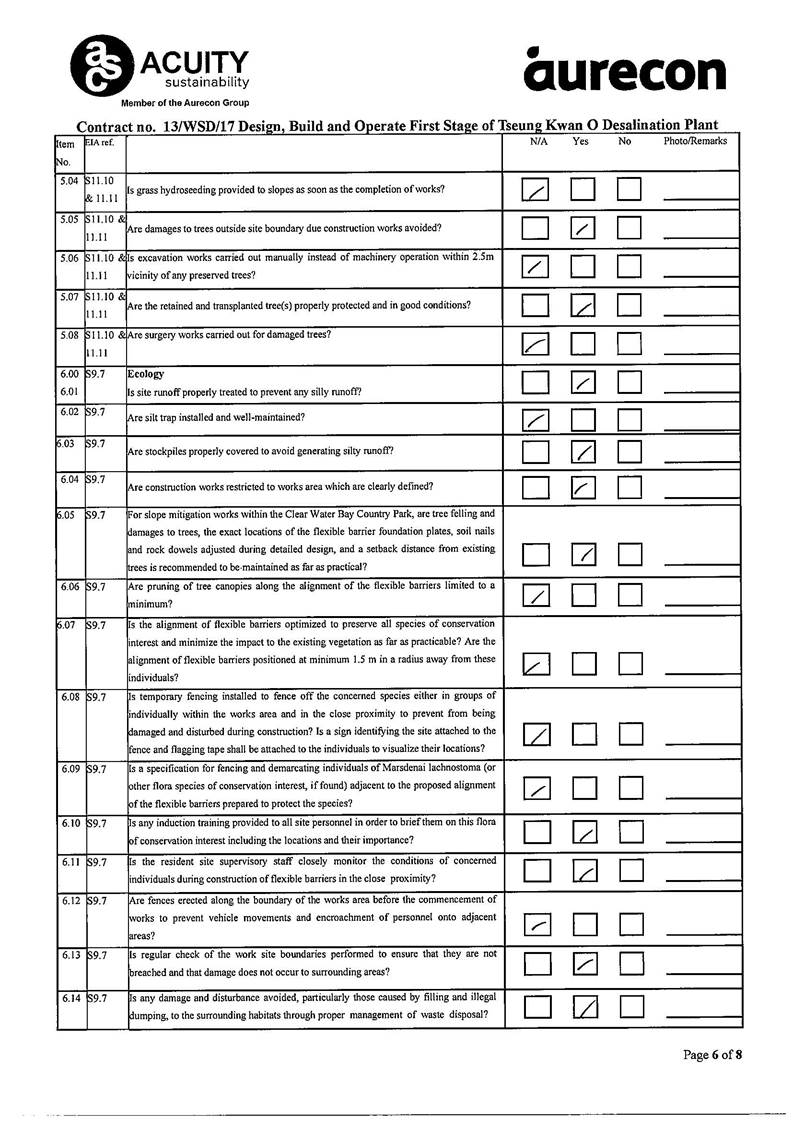
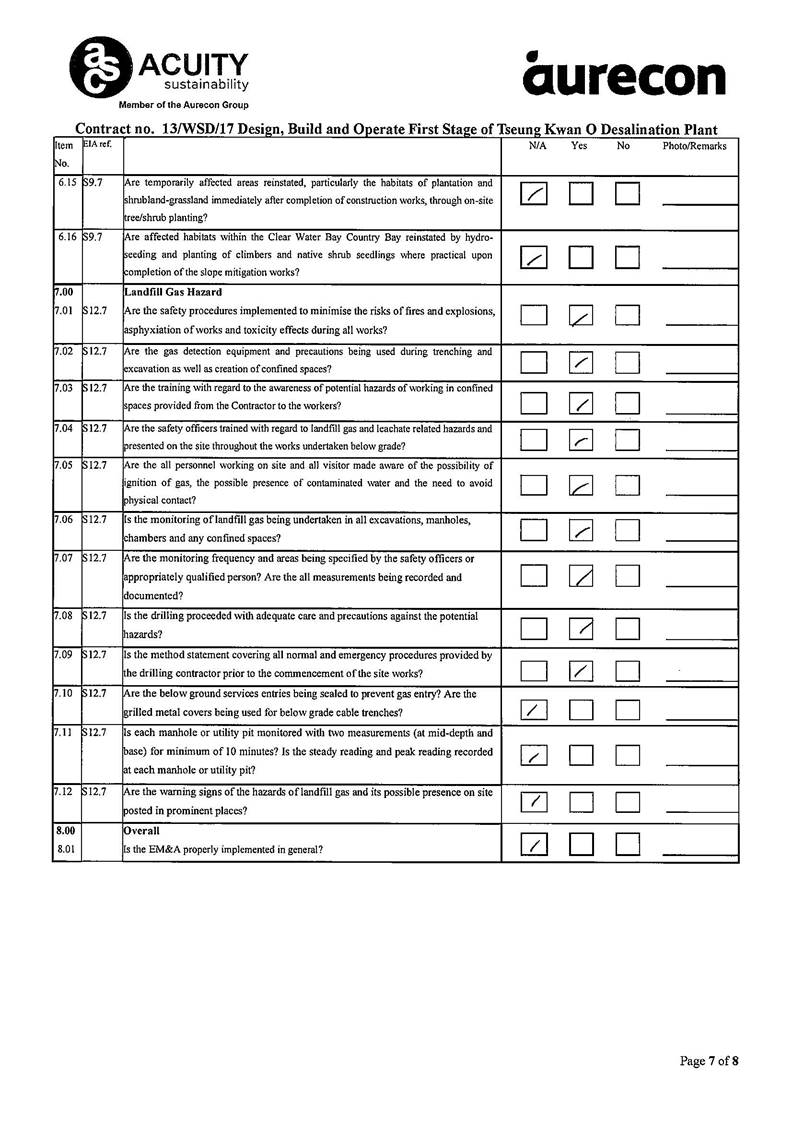
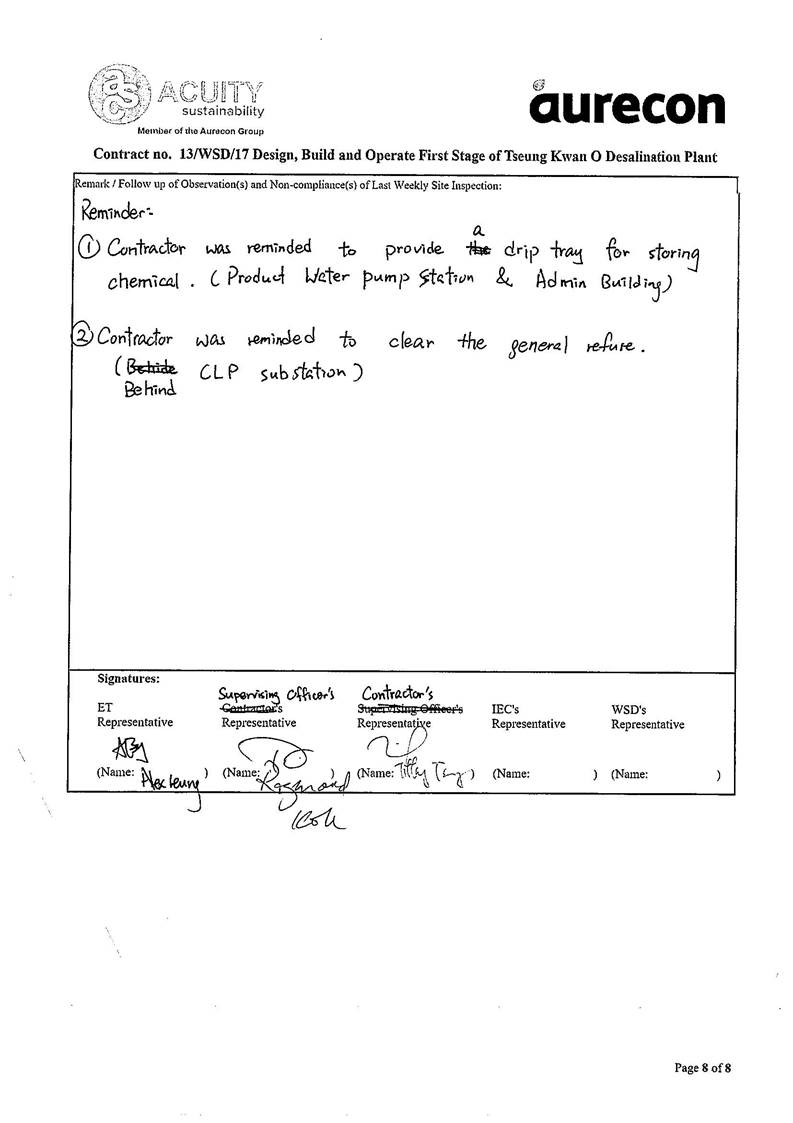
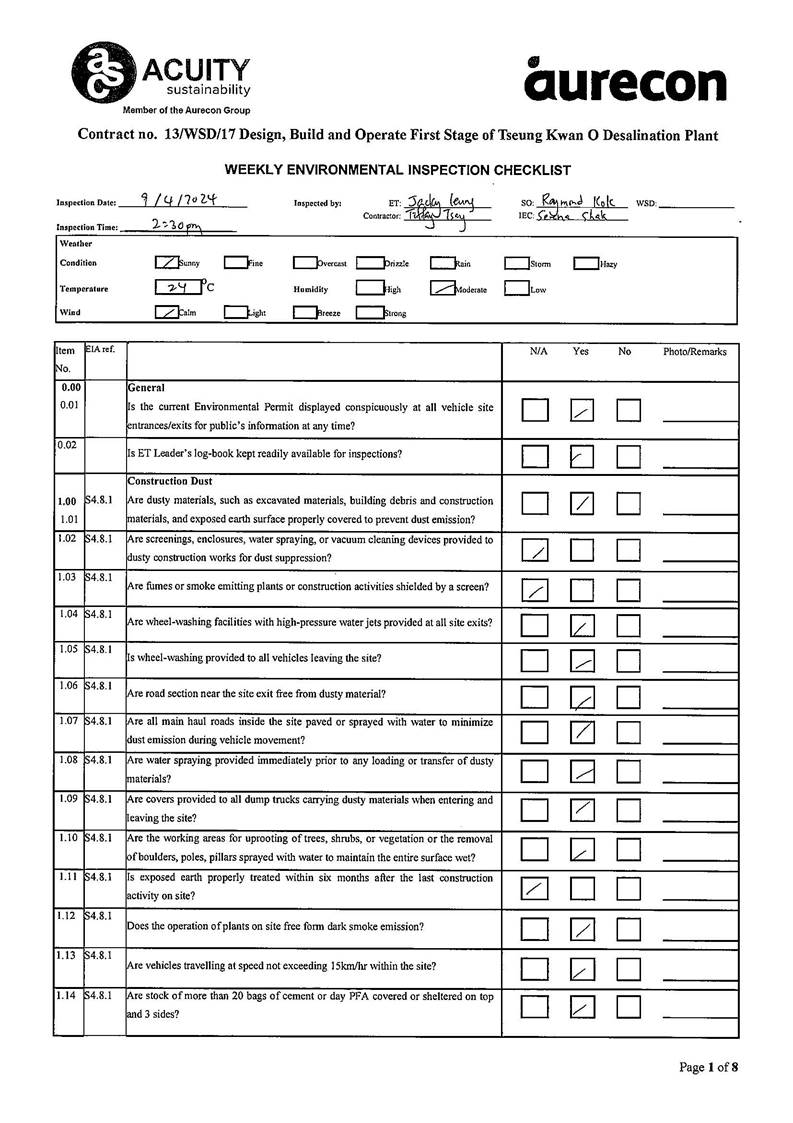
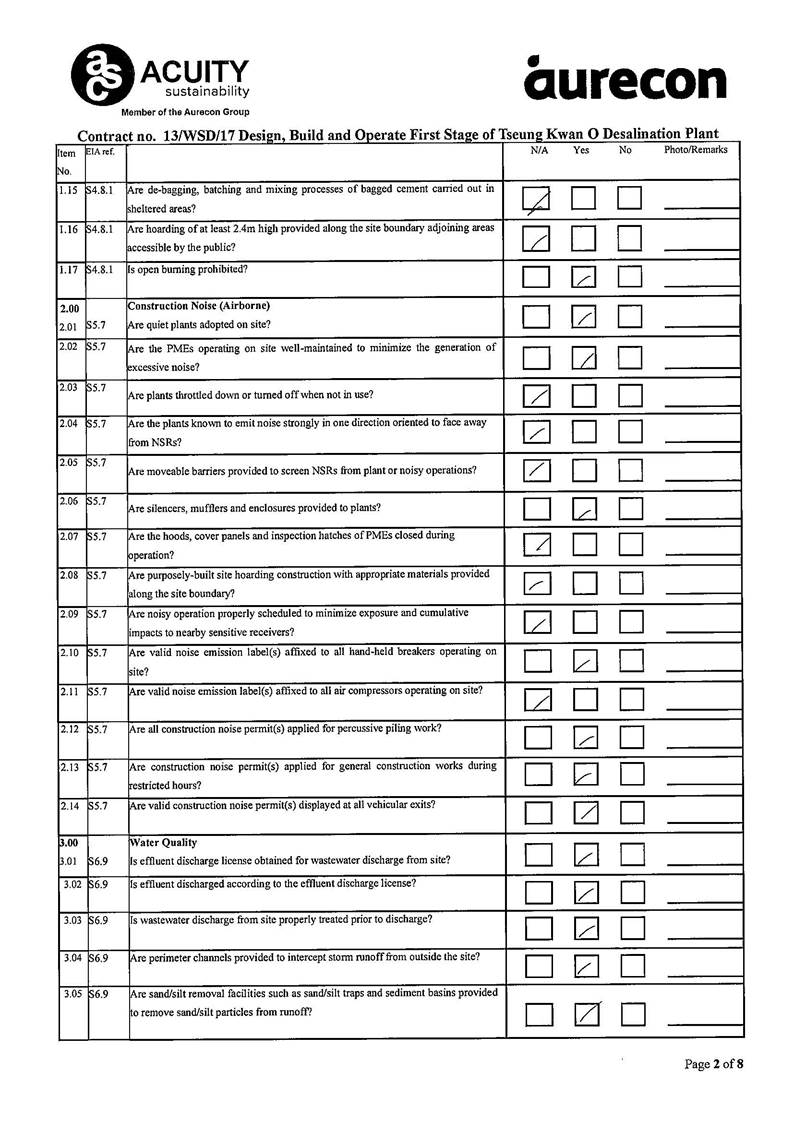
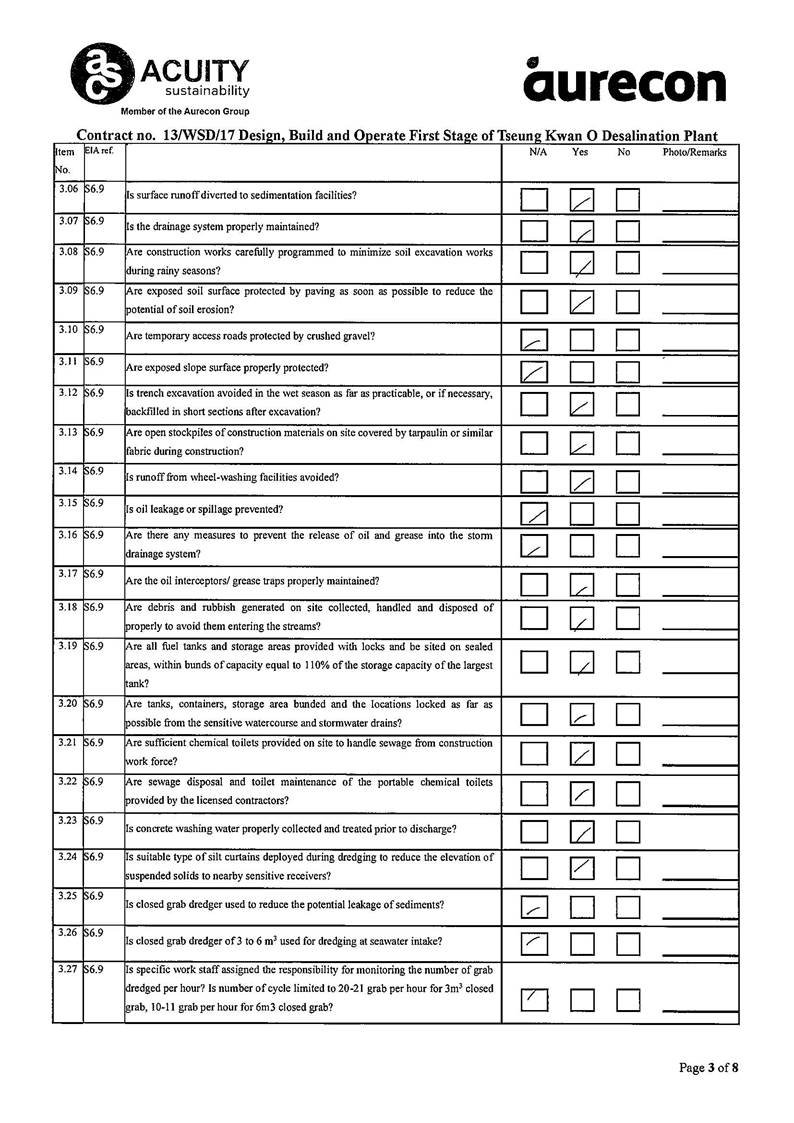
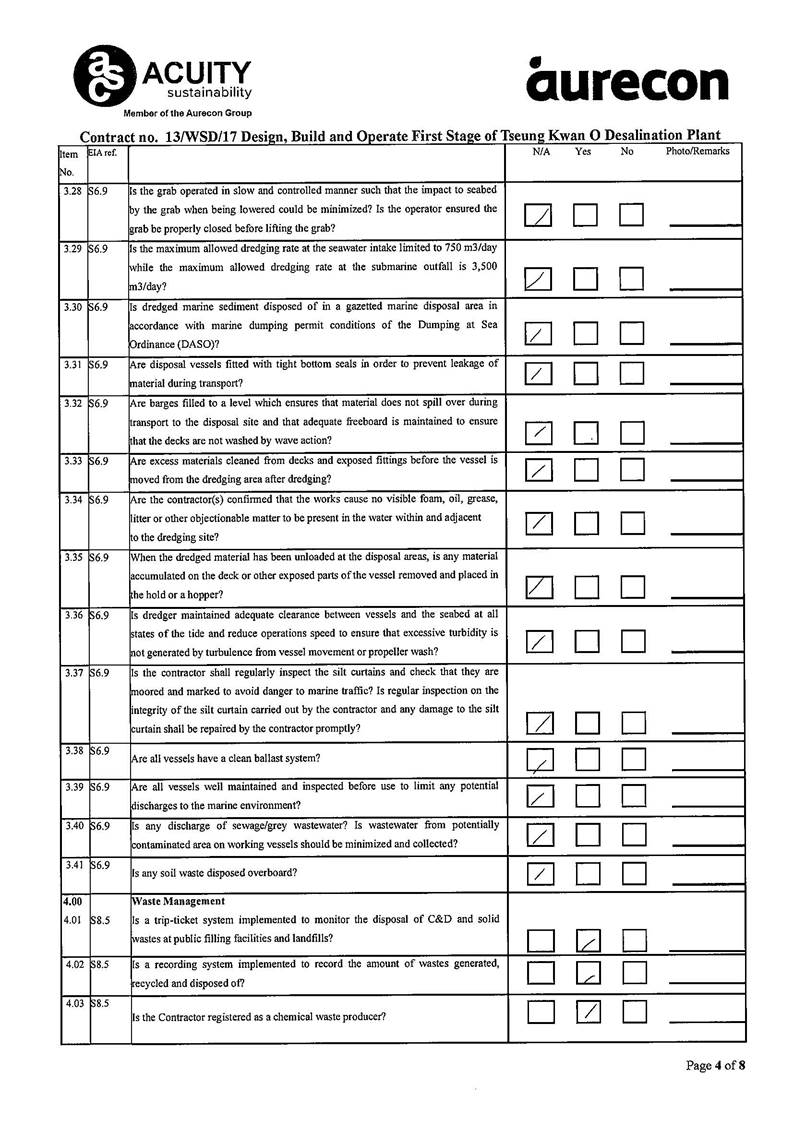
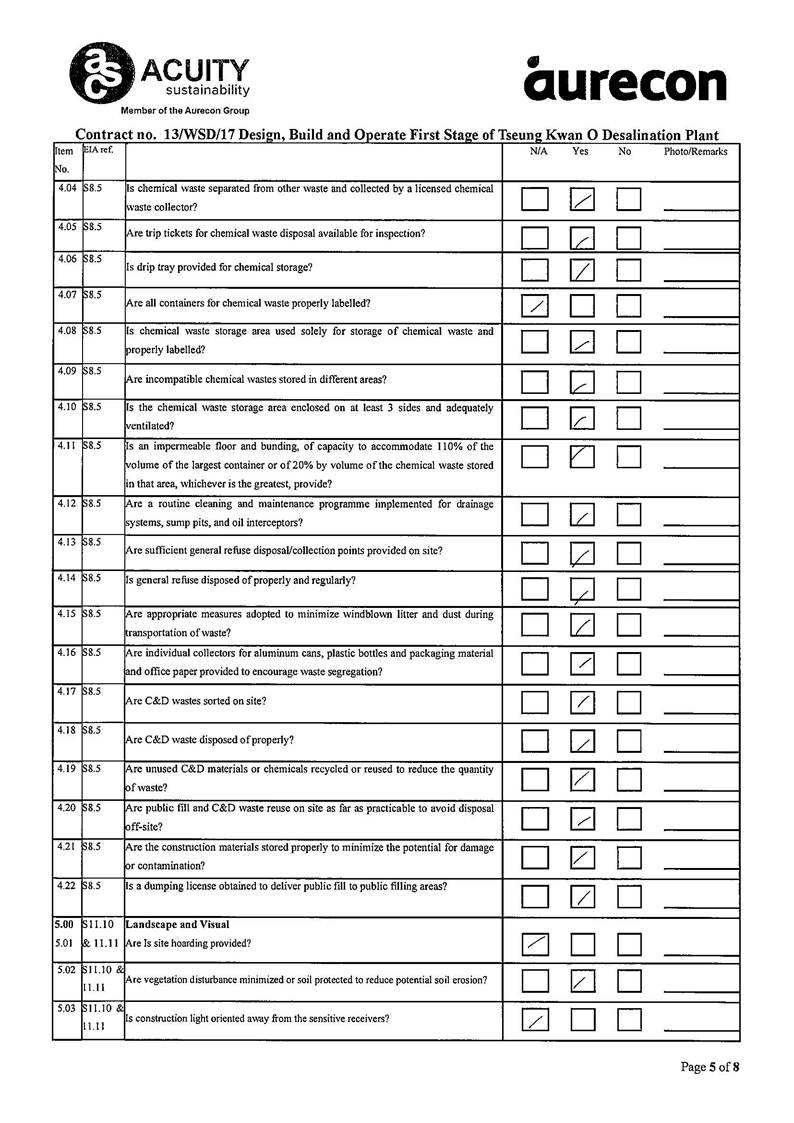
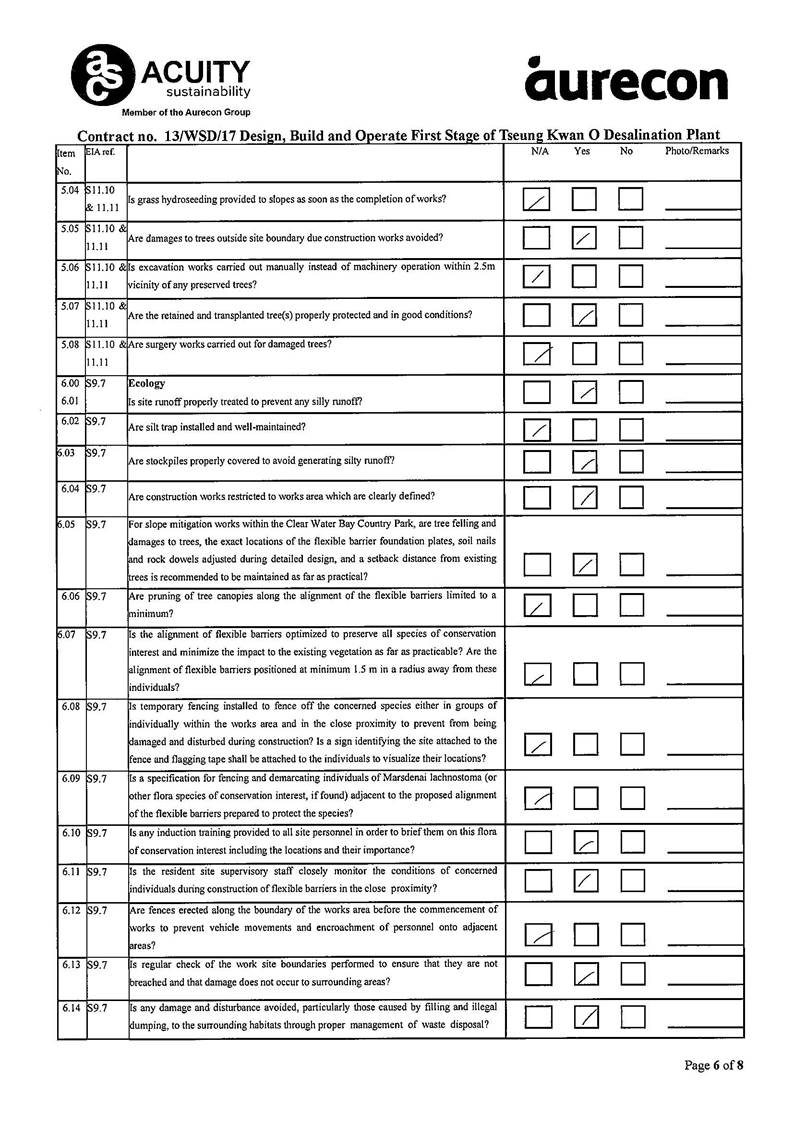
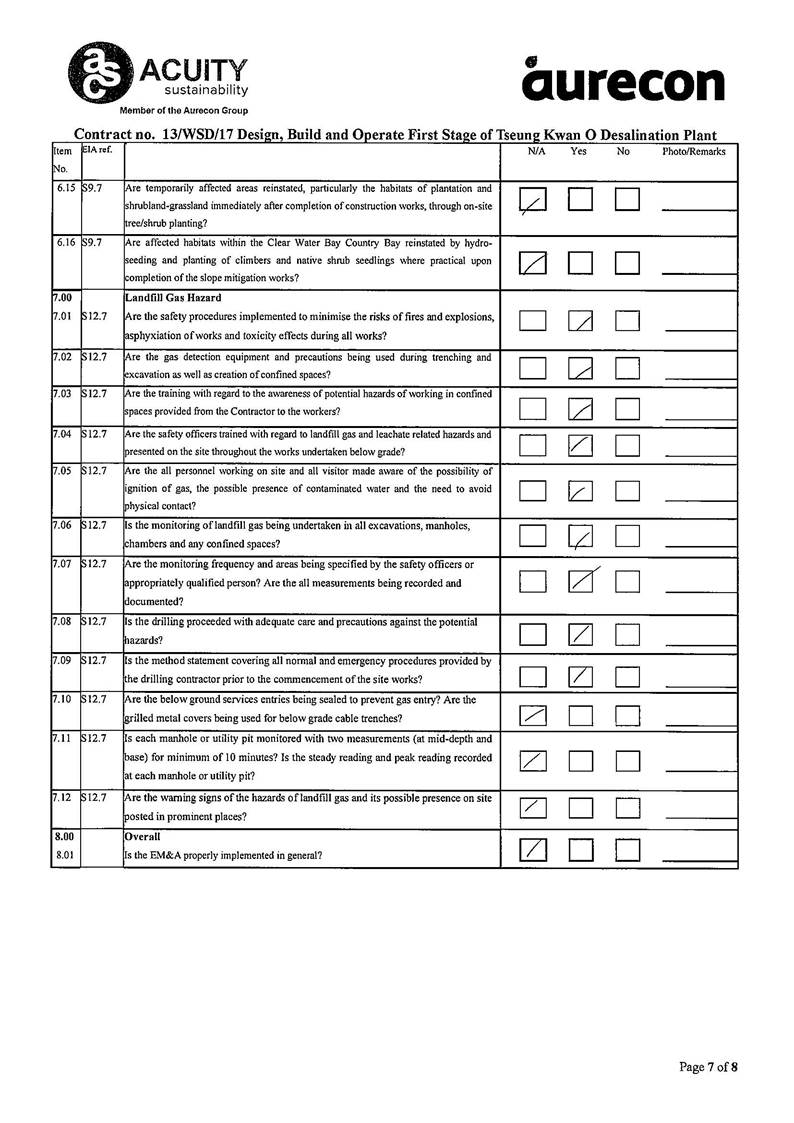
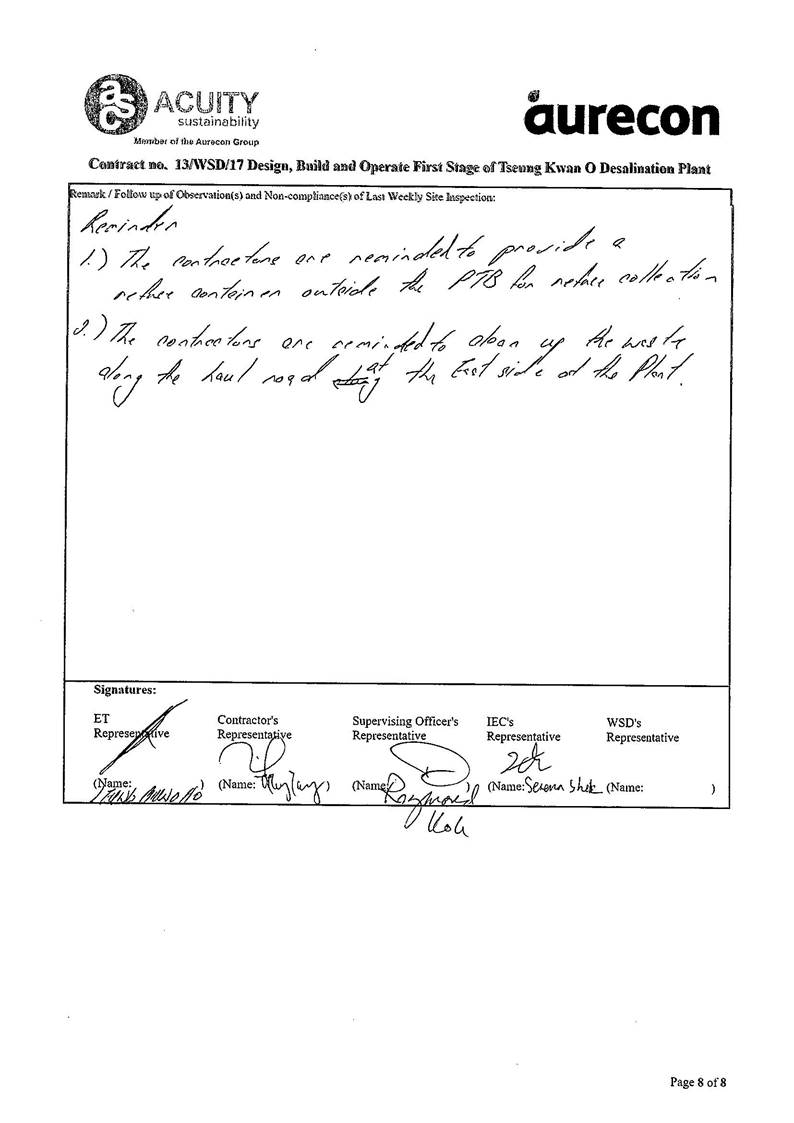
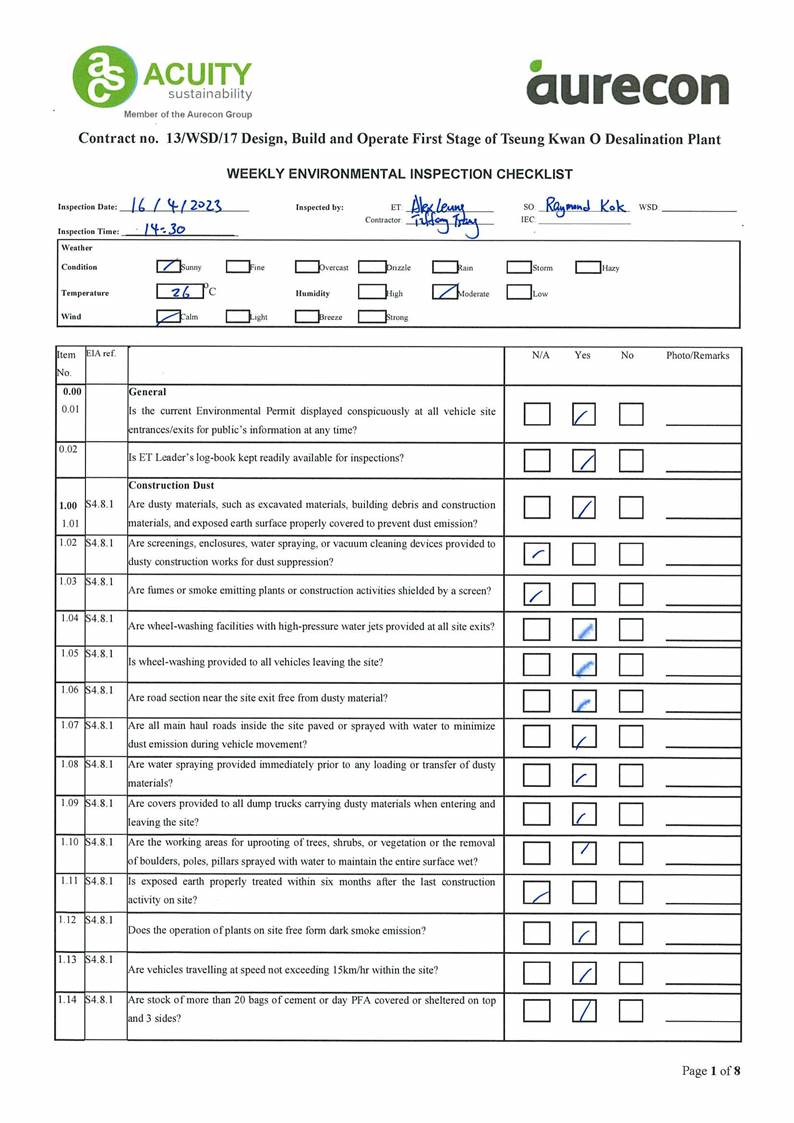
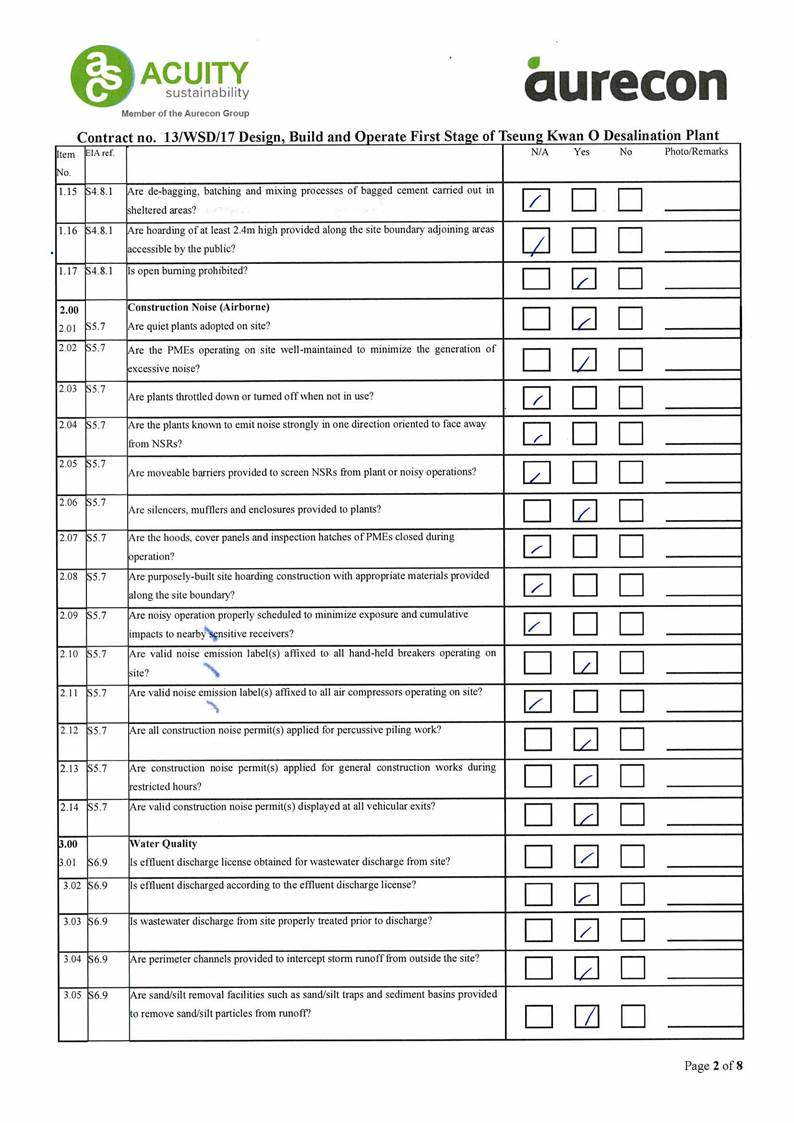
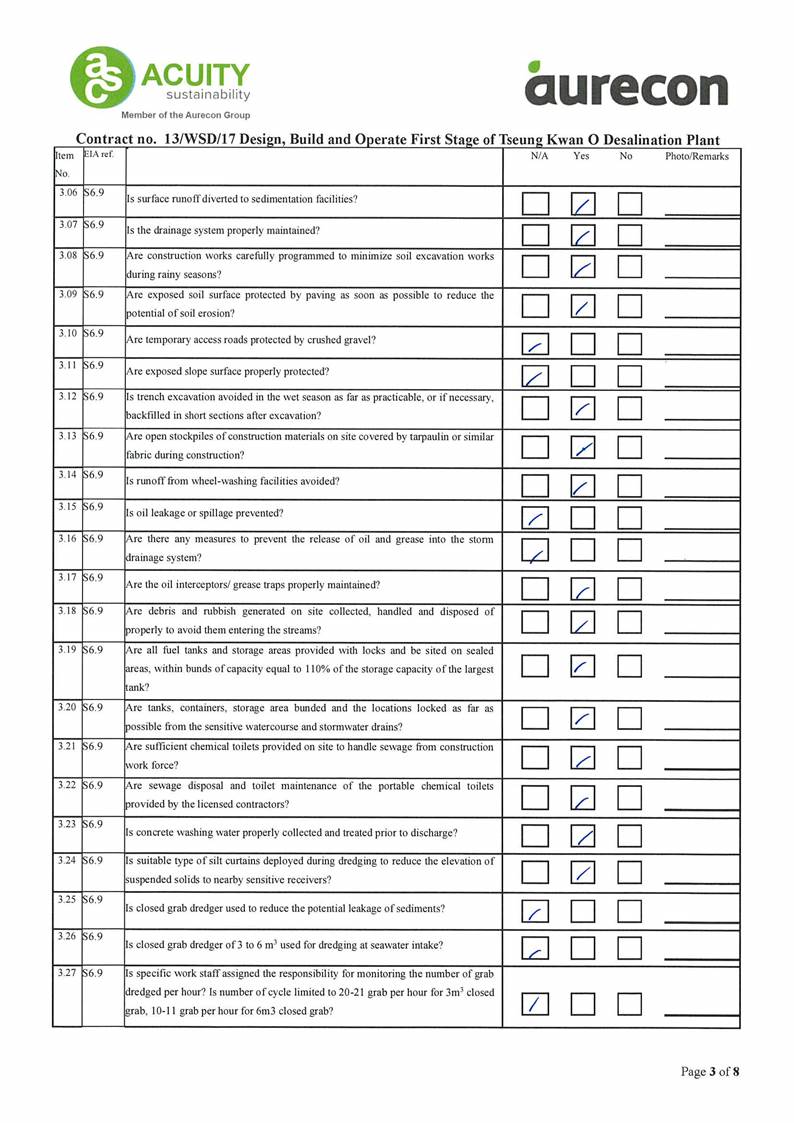
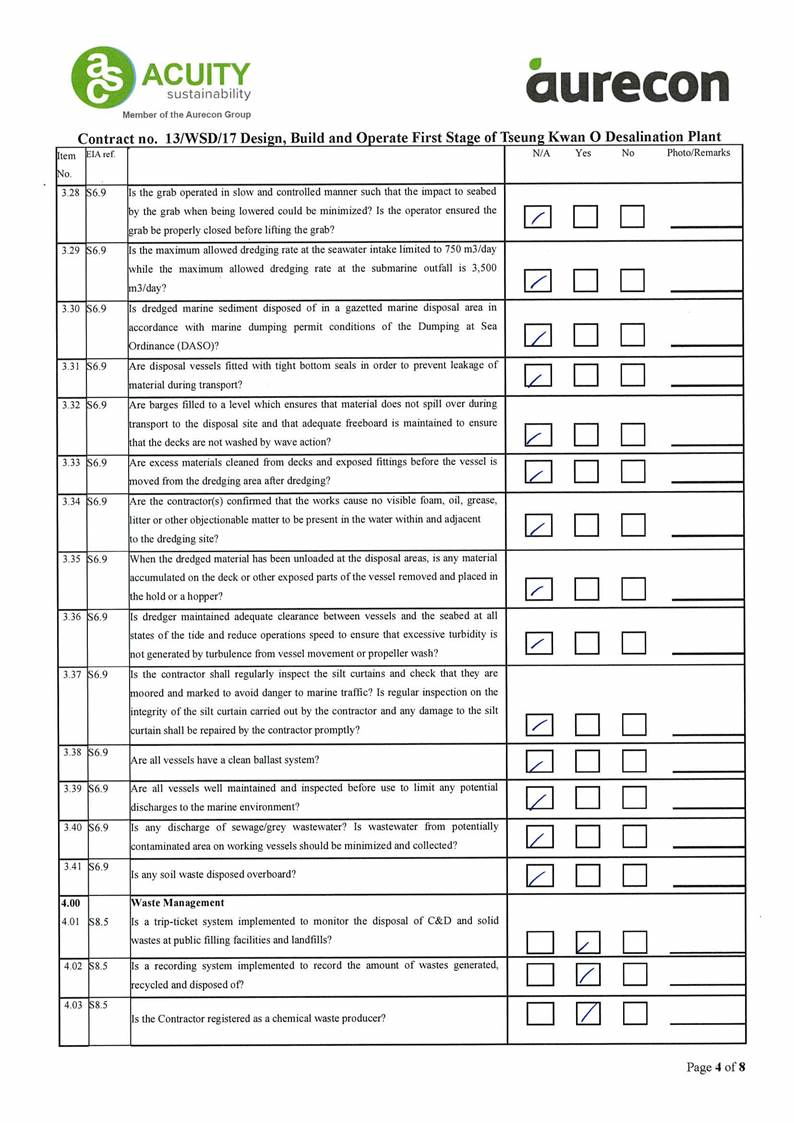
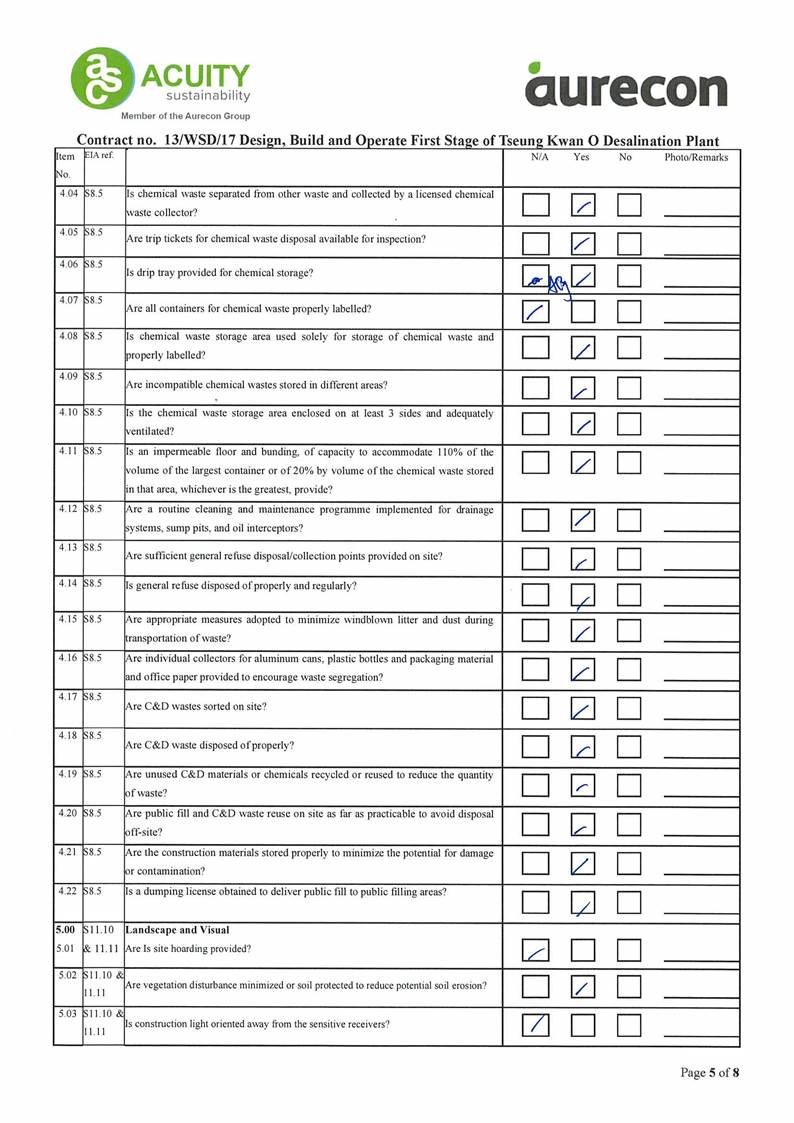
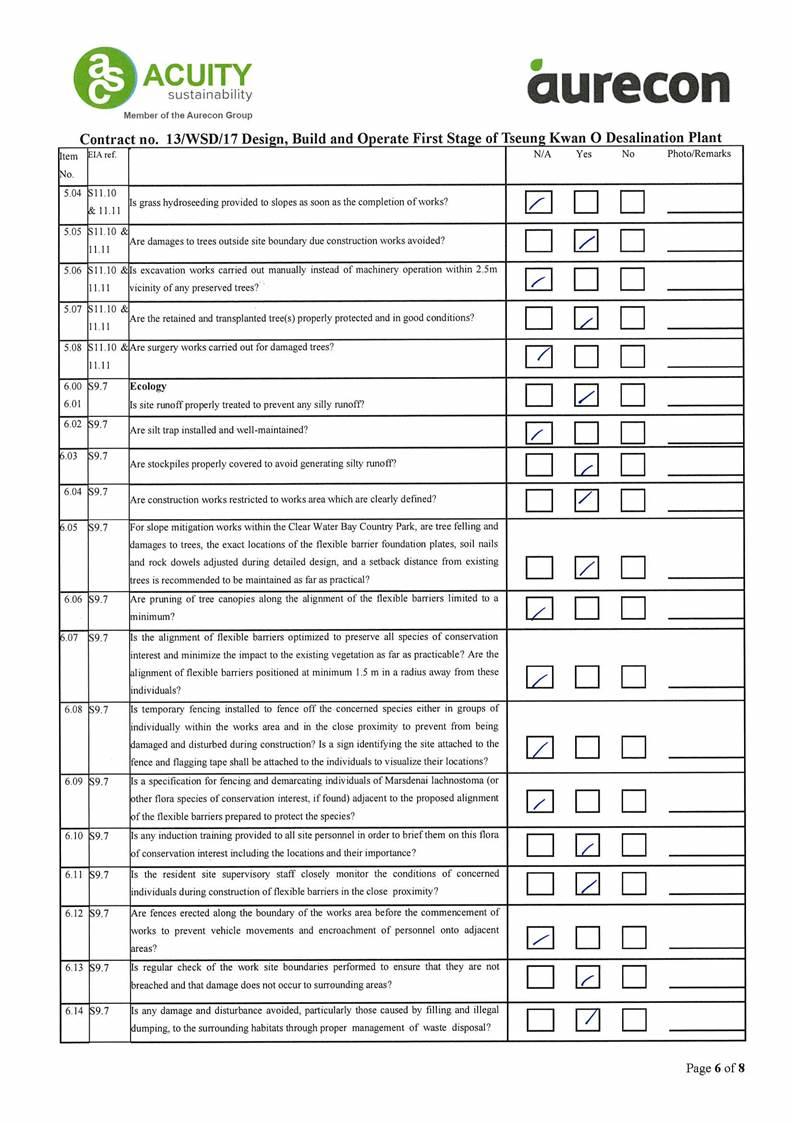
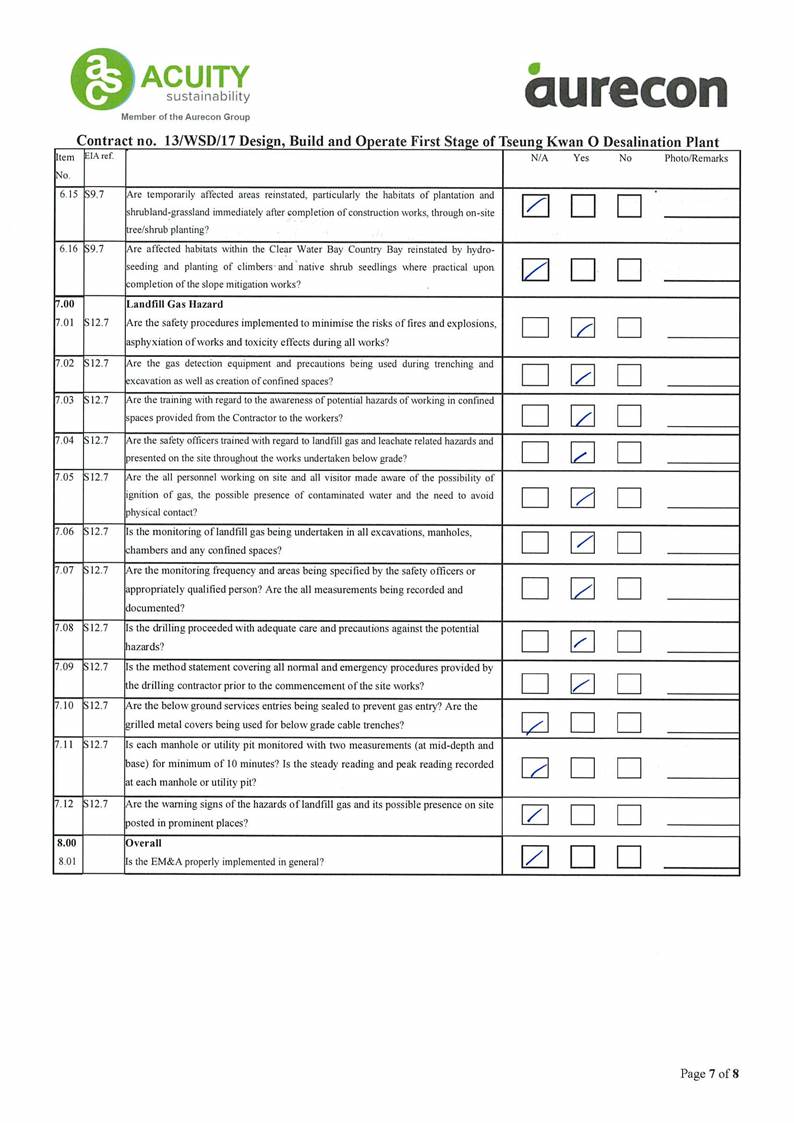
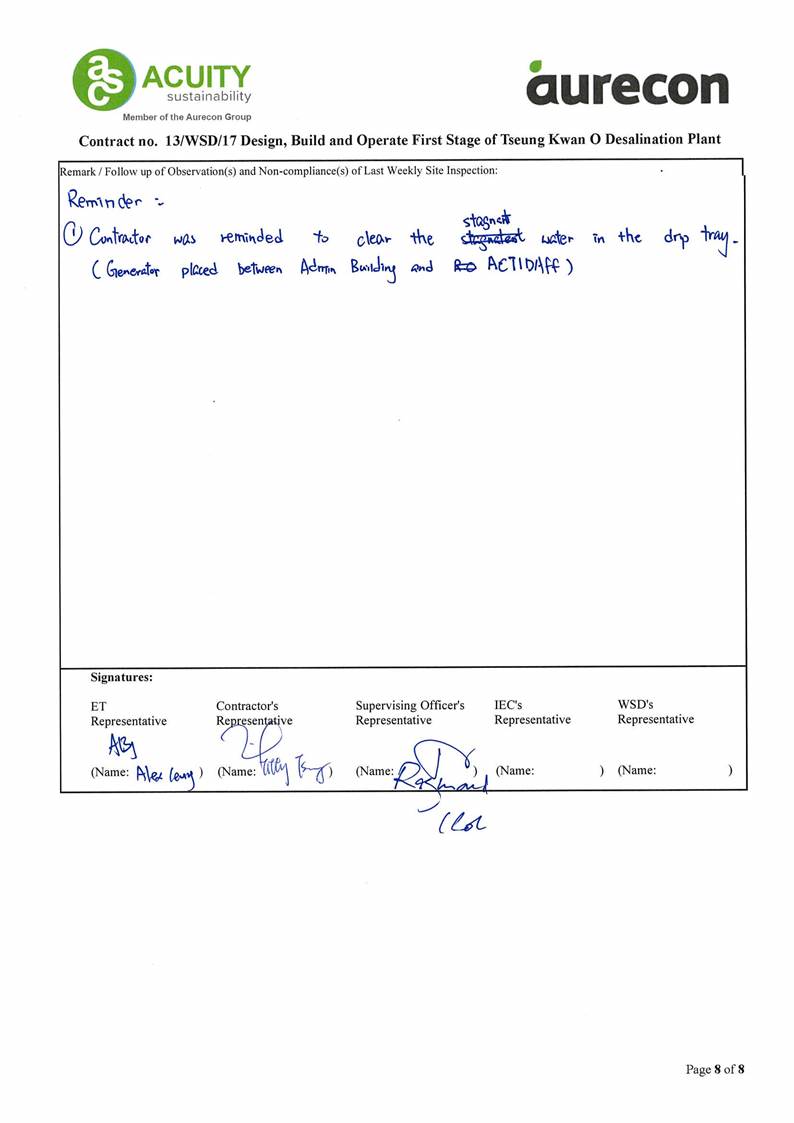
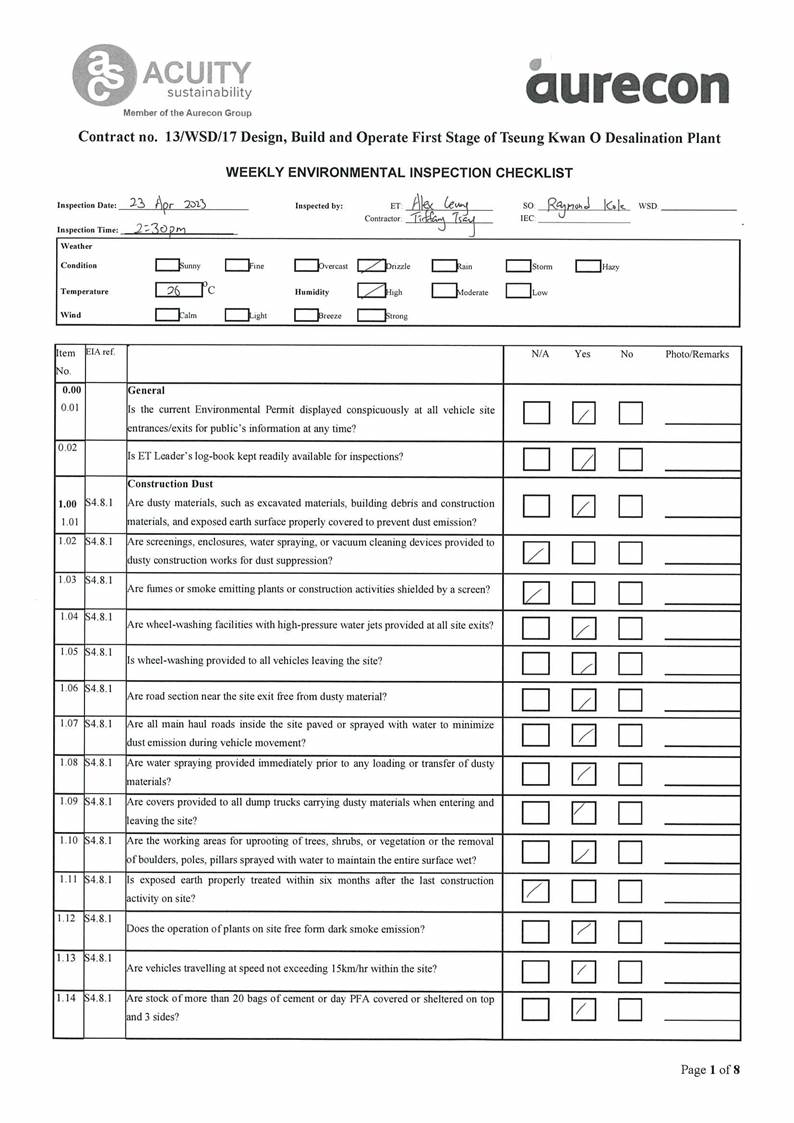
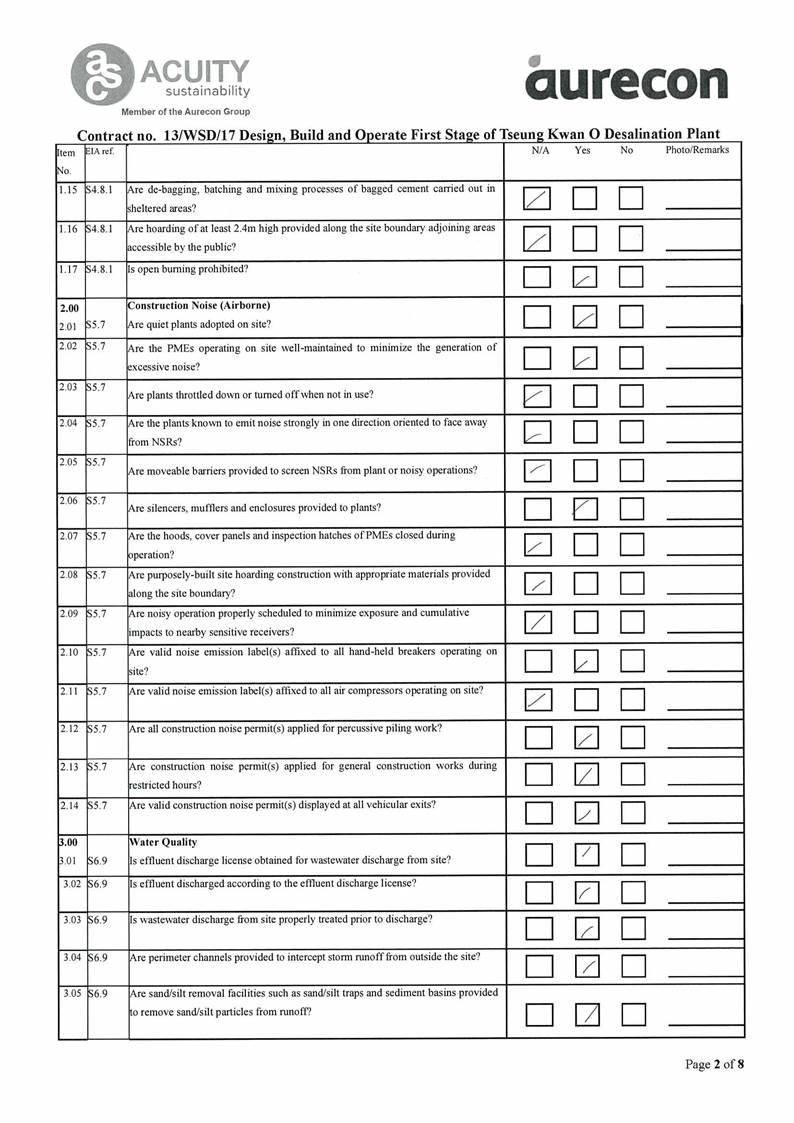
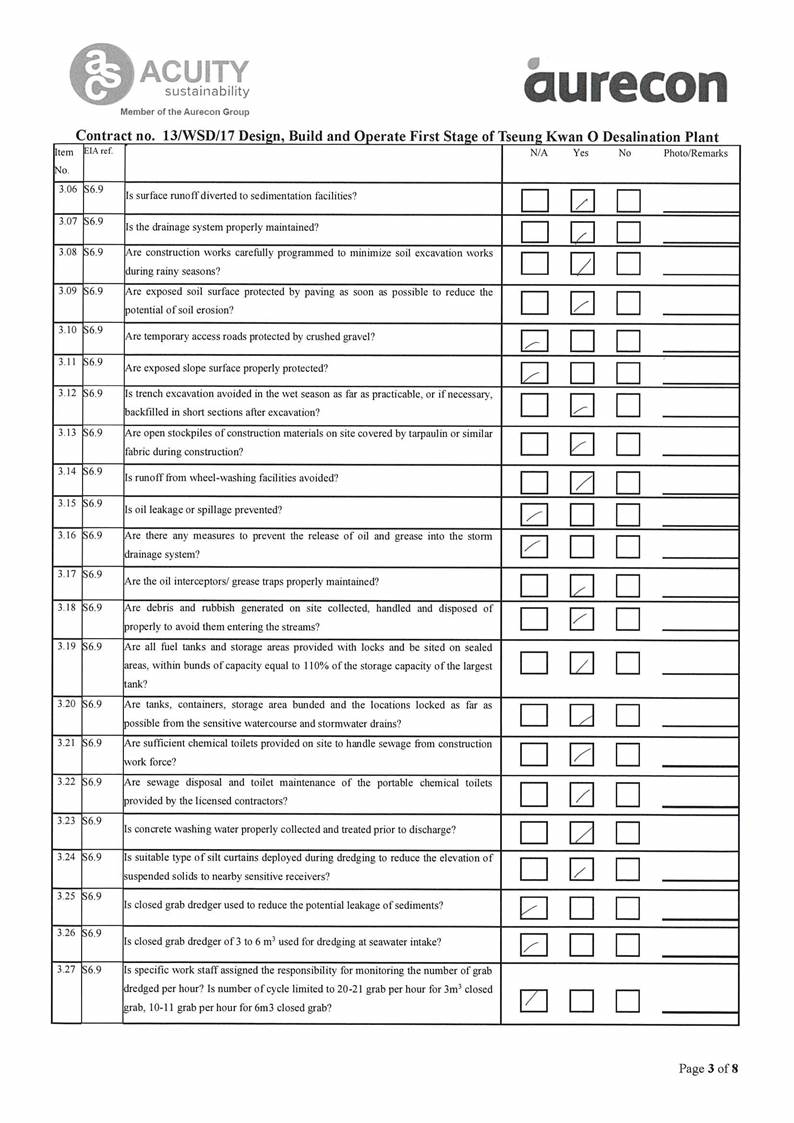
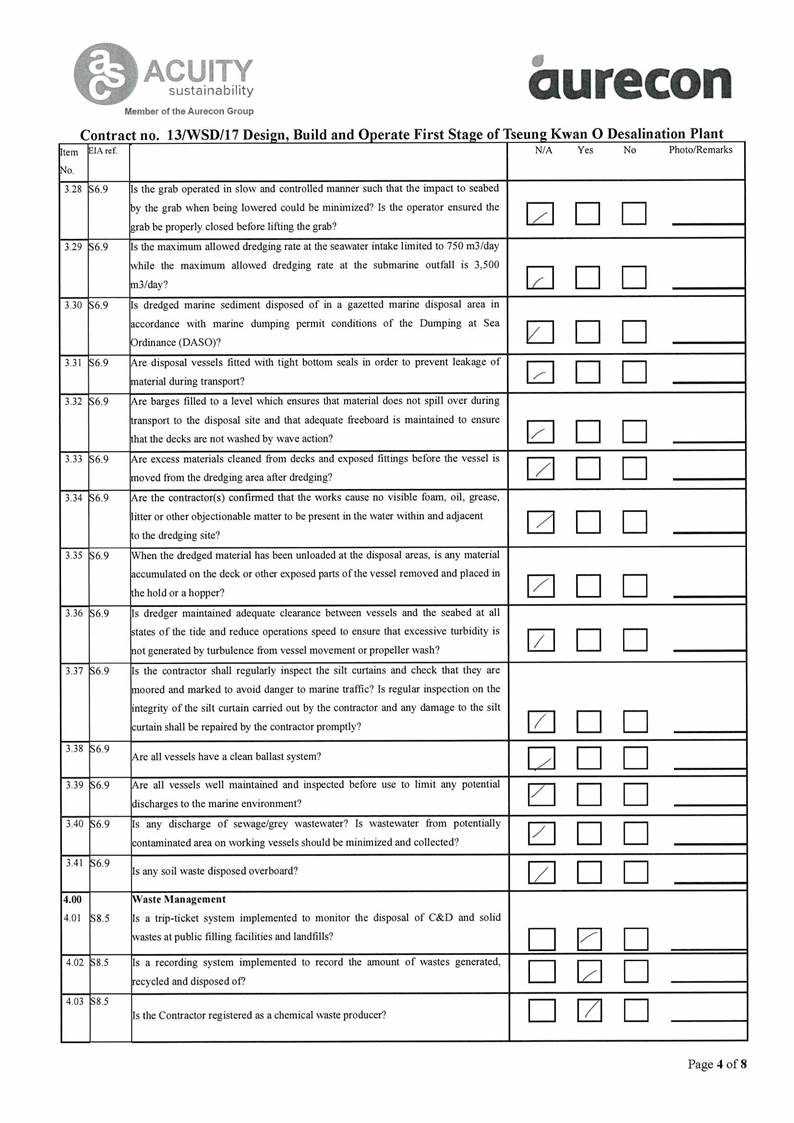
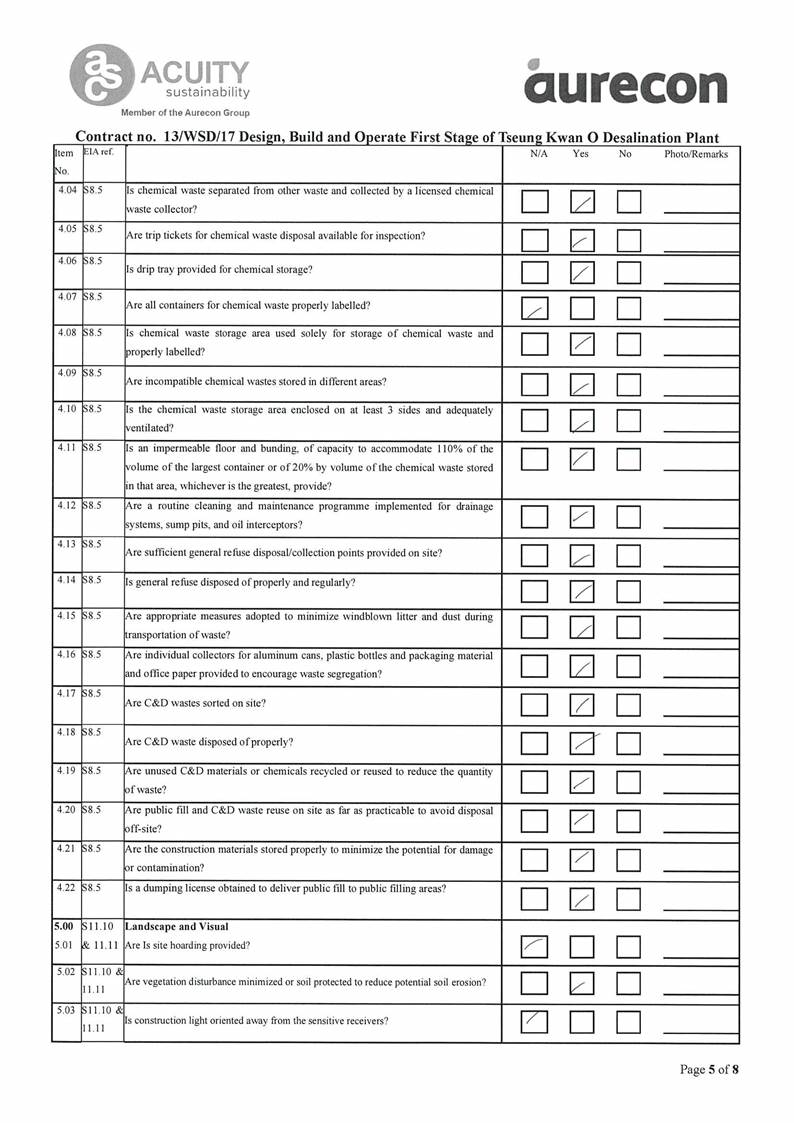
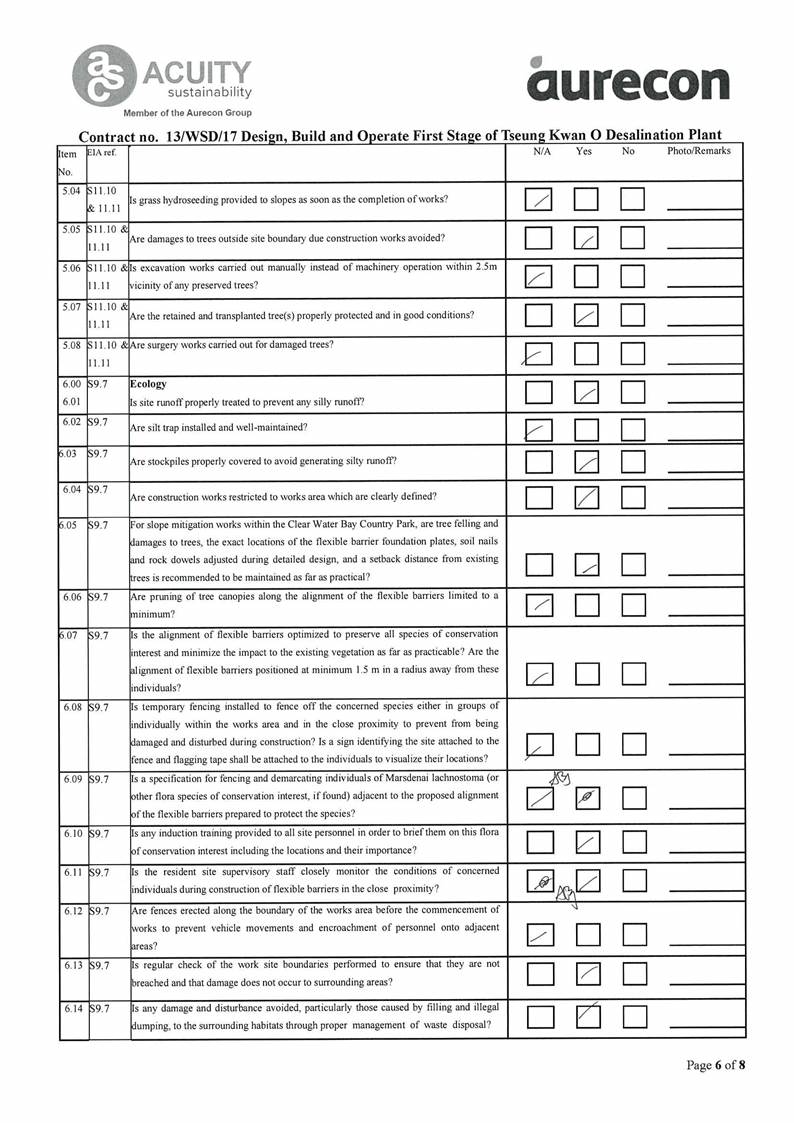
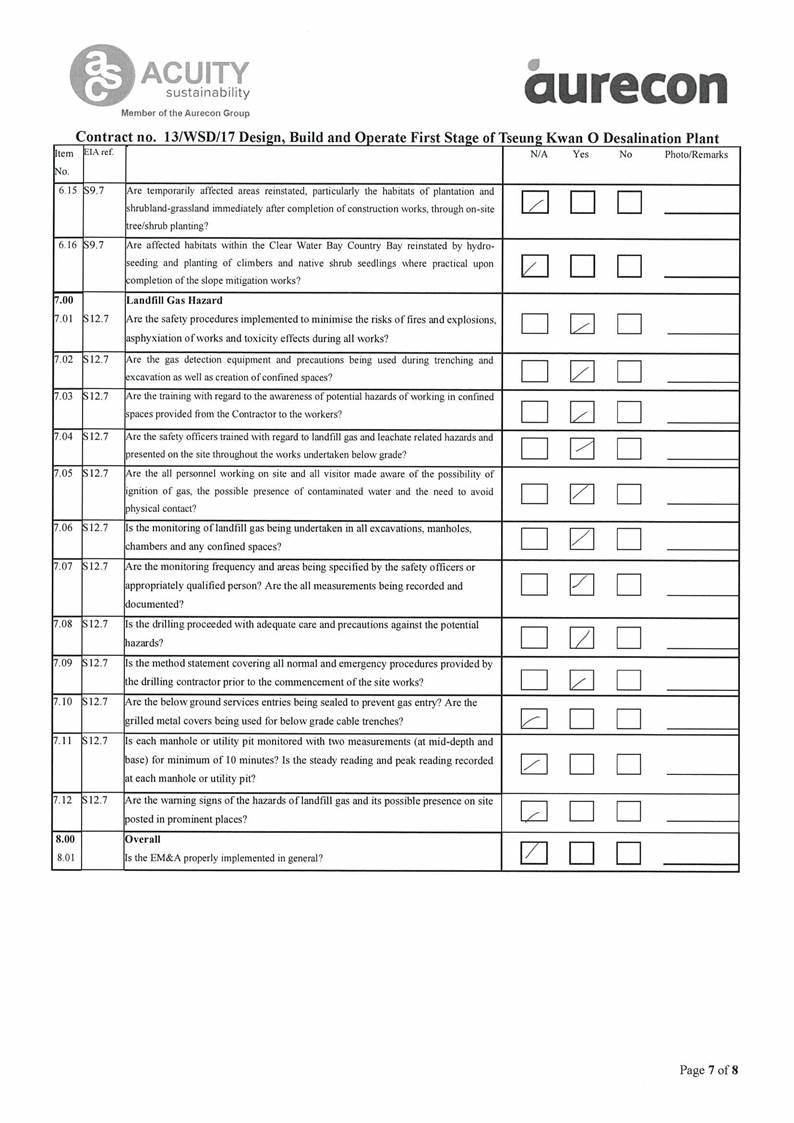
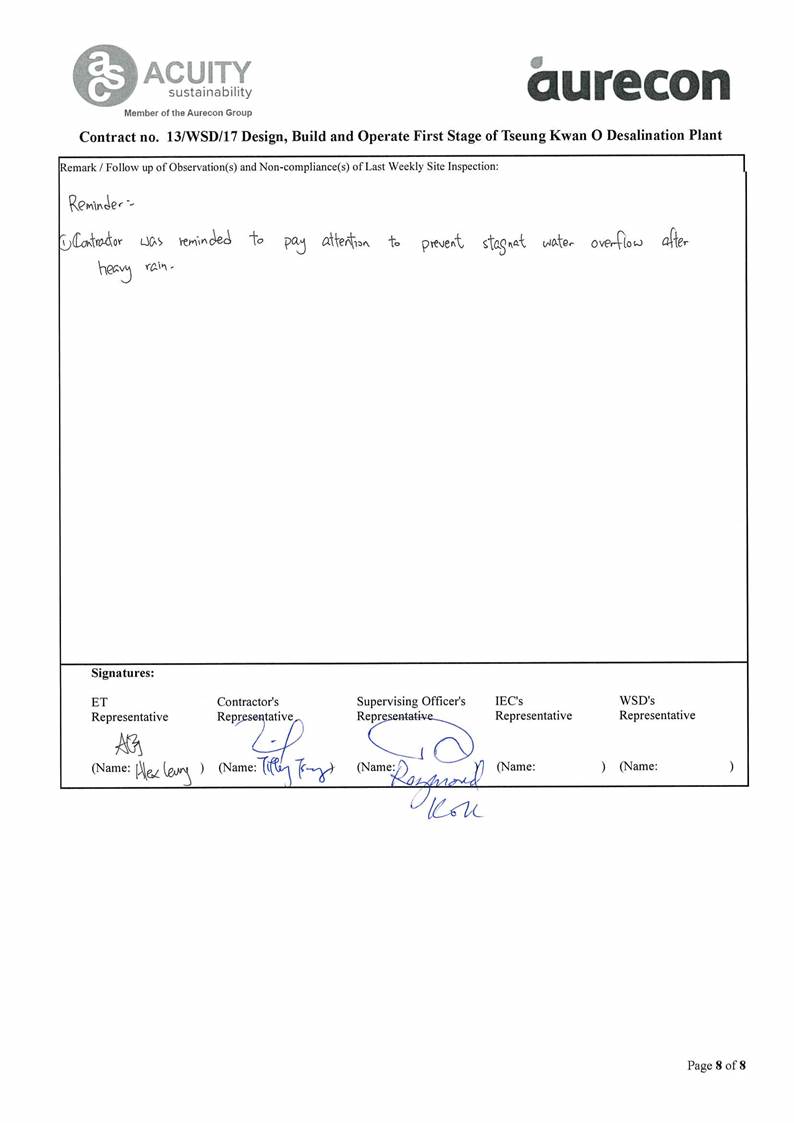
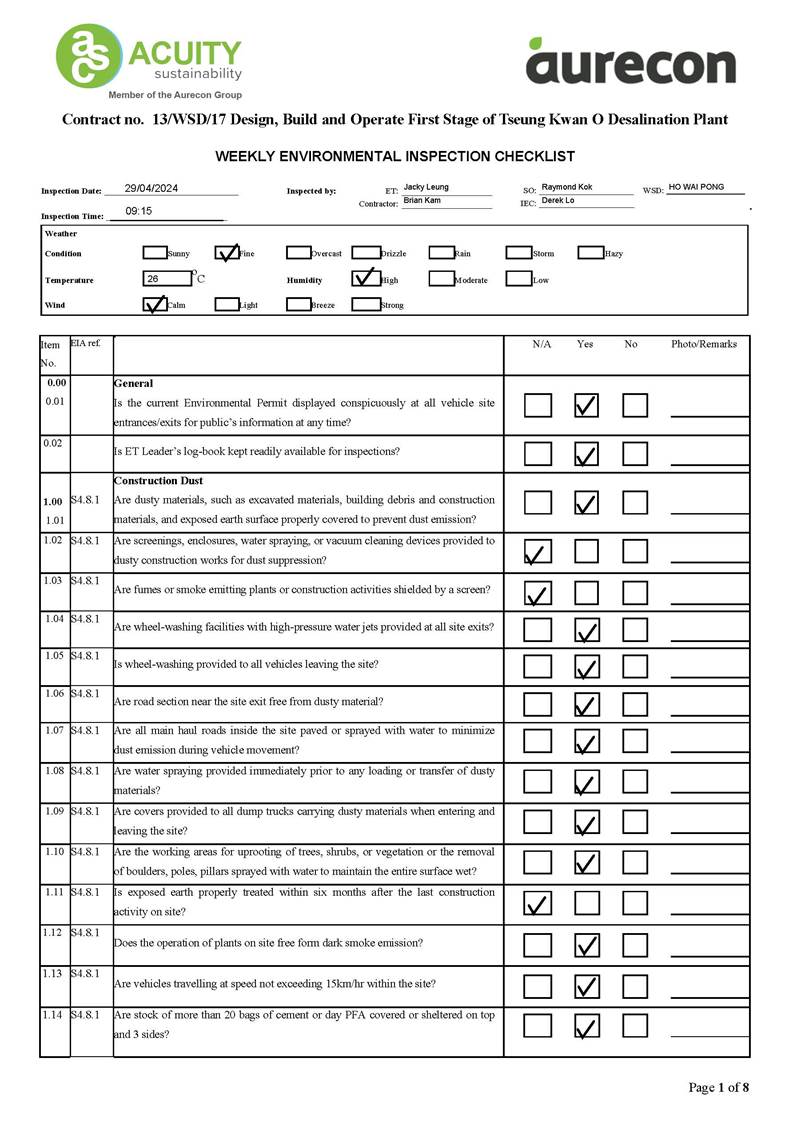
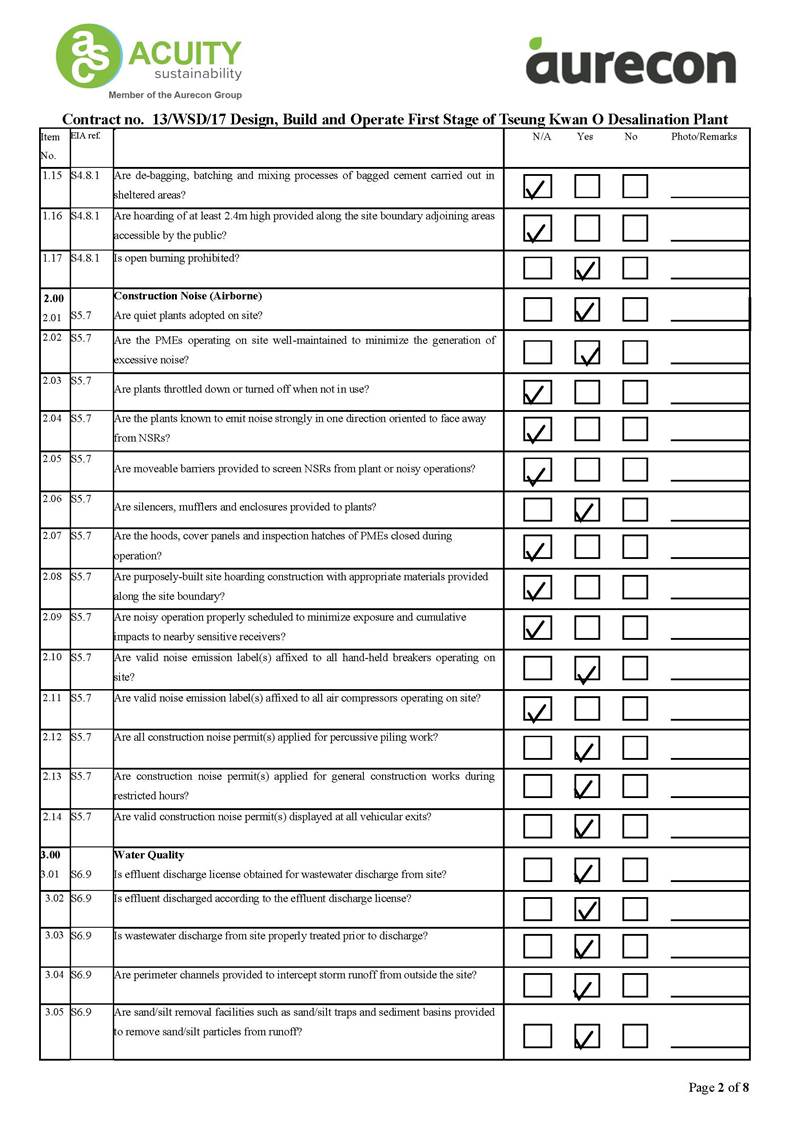
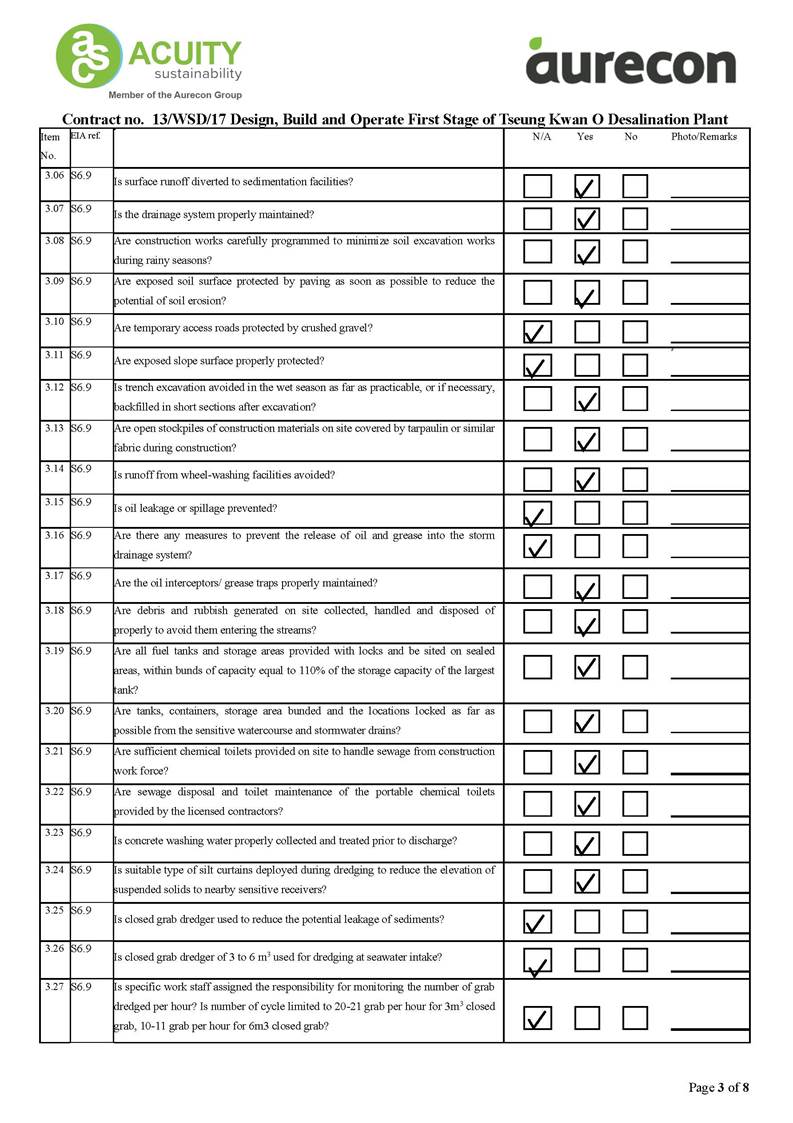
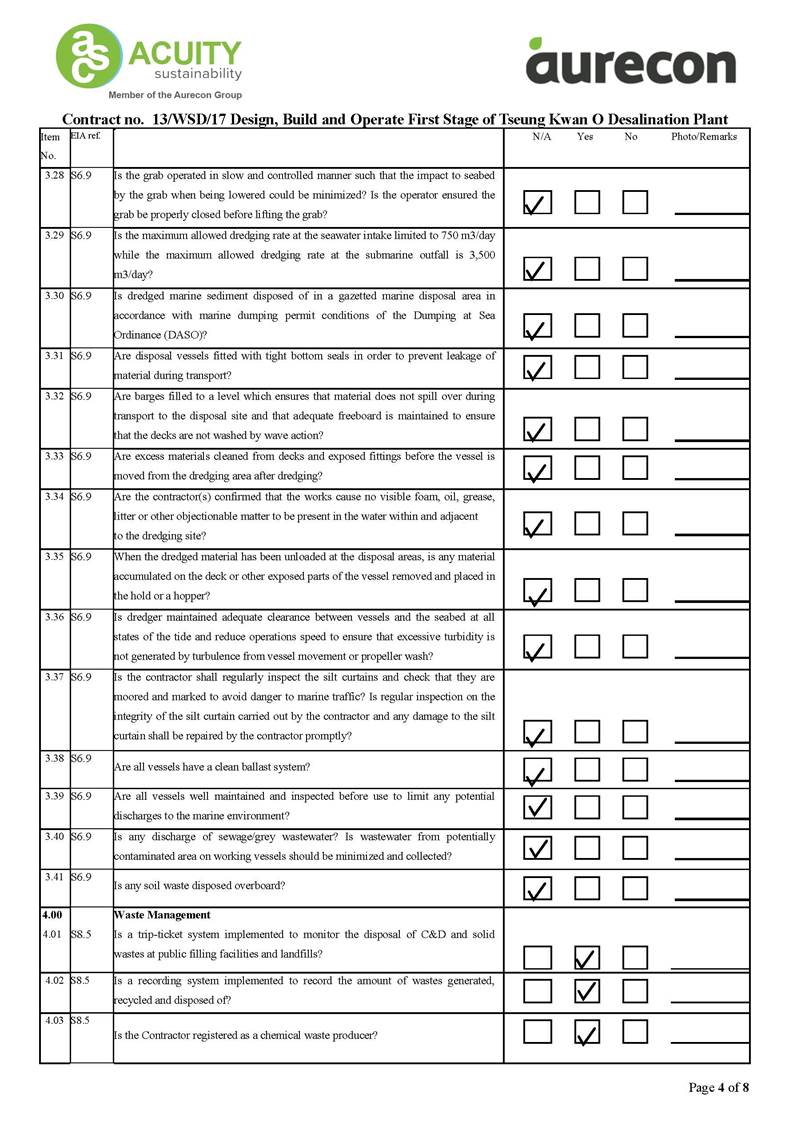
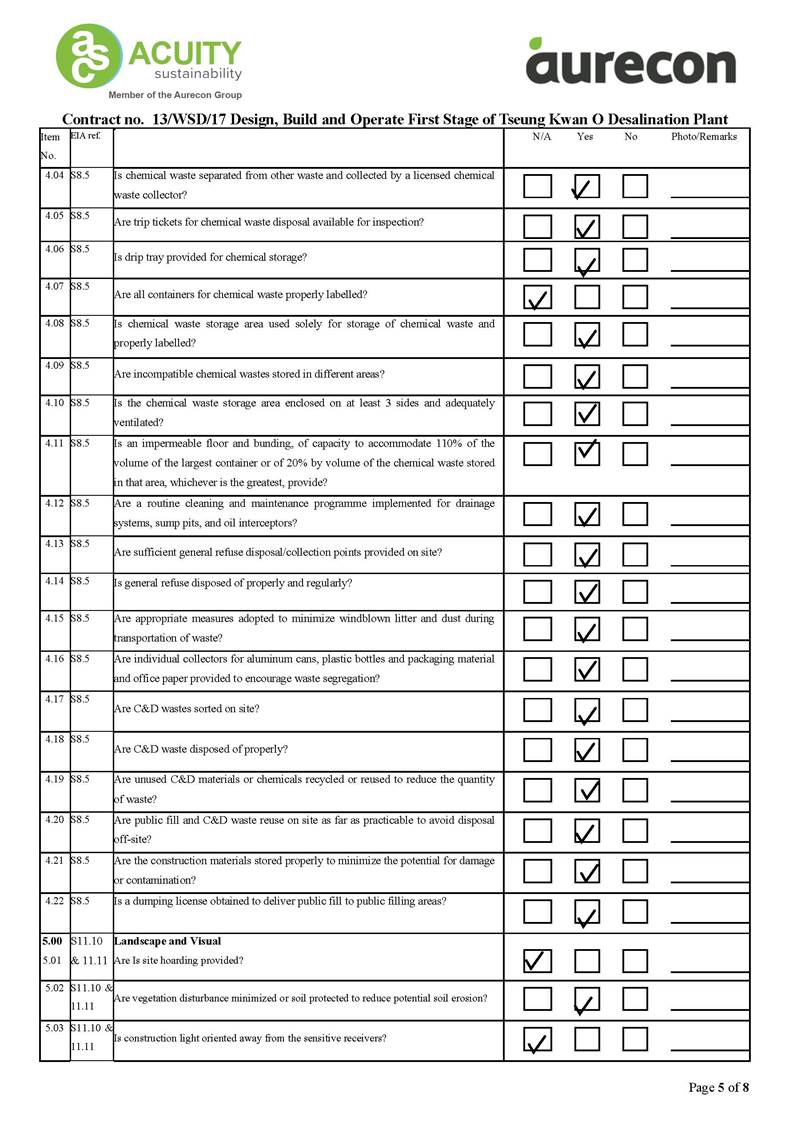
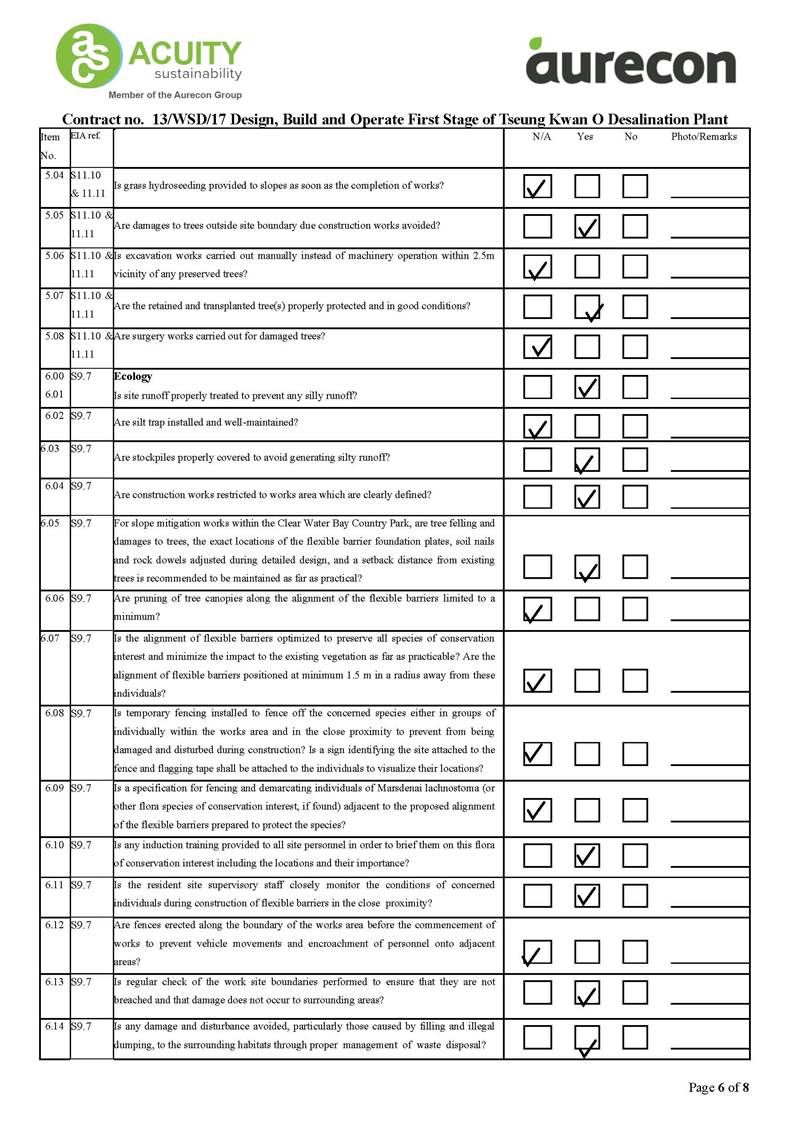
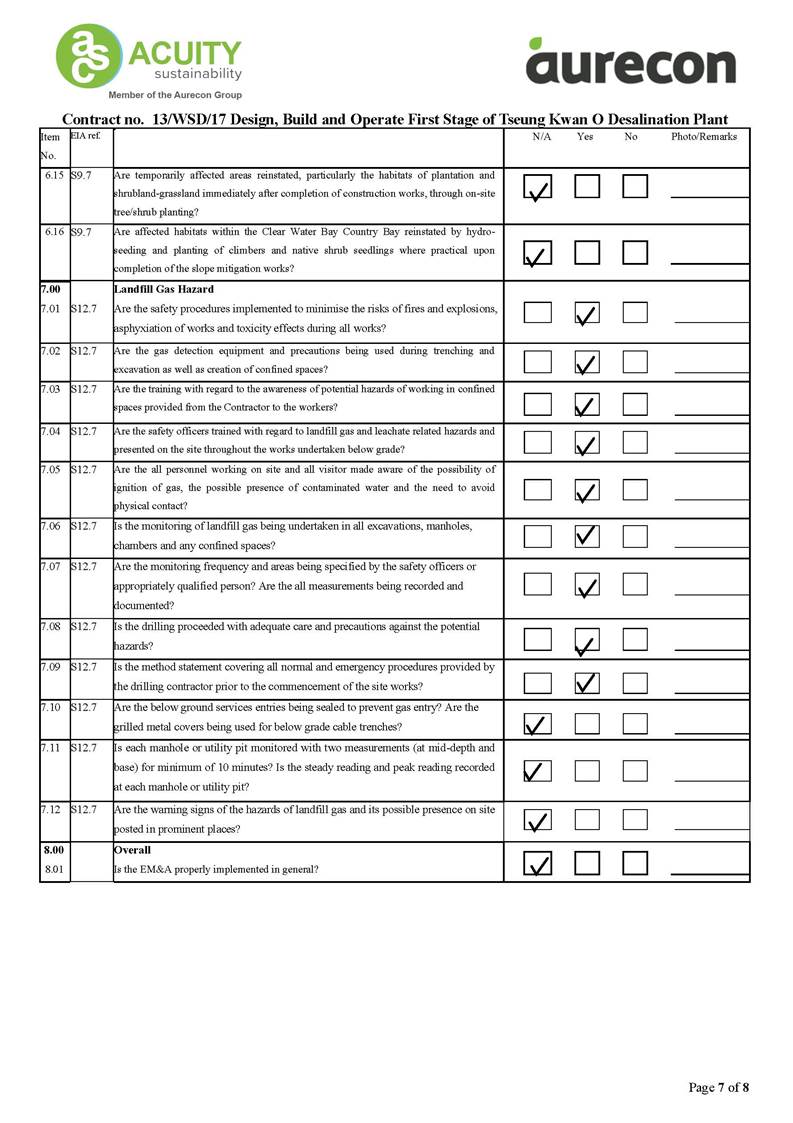
Appendix K
Complaint Log
Statistical Summary
of Environmental Complaints
|
Reporting Period
|
Environmental Complaint Statistics
|
|
Frequency
|
Cumulative
|
Complaint Nature
|
|
1 - 30 April
2024
|
0
|
2
|
N/A
|
Statistical
Summary of Environmental Summons
|
Reporting Period
|
Environmental Summons
Statistics
|
|
Frequency
|
Cumulative
|
Details
|
|
1 - 30 April
2024
|
0
|
0
|
N/A
|
Statistical
Summary of Environmental Prosecution
|
Reporting Period
|
Environmental Prosecution Statistics
|
|
Frequency
|
Cumulative
|
Details
|
|
1 - 30 April
2024
|
0
|
0
|
N/A
|
Appendix L
Exceedance Report (s)
Bi-Weekly Incident Report
on Action Level or Limit Level Non-Compliance
|
Date of exceedance
|
Monitoring Station
|
Tide
|
Parameter
|
Measurement Result (mg/L)
|
Sampling depth
|
Depth Average Result (mg/L)
|
Action Level (mg/L)
|
Limit Level (mg/L)
|
Exceedance
|
Marine construction activities with
contact with water (Y/N)
|
Exceedance related
to Project (Y/N)
|
Reasons of non-project related exceedance
|
|
95%-
ile
|
Control 120%
|
99%-
ile
|
Control 130%
|
(1)
|
(2)
|
(3)
|
(4)
|
(5)
|
(6)
|
(7)
|
|
02/04/2024
|
WSR3
|
Flood
|
Suspended Solid
(SS)
|
--
|
--
|
4.33
|
5.00
|
3.90
|
6.00
|
4.23
|
Limit Level
|
N
|
N
|
|
ü
|
|
|
ü
|
|
ü
|
|
WSR4
|
--
|
--
|
5.33
|
Limit Level
|
N
|
N
|
|
ü
|
|
|
ü
|
|
ü
|
|
WSR37
|
--
|
--
|
4.17
|
Action Level
|
N
|
N
|
|
ü
|
|
|
ü
|
|
ü
|
|
NF1
|
--
|
--
|
6.17
|
Limit Level
|
N
|
N
|
|
ü
|
|
|
ü
|
|
ü
|
|
NF2
|
--
|
--
|
6.83
|
Limit Level
|
N
|
N
|
|
ü
|
|
|
ü
|
|
ü
|
|
NF3
|
--
|
--
|
6.67
|
Limit Level
|
N
|
N
|
|
ü
|
|
|
ü
|
|
ü
|
|
04/04/2024
|
NF2
|
Flood
|
Suspended Solid (SS)
|
--
|
--
|
4.83
|
5.00
|
3.90
|
6.00
|
4.23
|
Limit Level
|
N
|
N
|
|
ü
|
|
ü
|
ü
|
|
ü
|
|
06/04/2024
|
NF2
|
Ebb
|
Suspended Solid
(SS)
|
--
|
--
|
5.00
|
5.00
|
4.50
|
6.00
|
4.88
|
Limit Level
|
N
|
N
|
|
ü
|
ü
|
ü
|
ü
|
ü
|
ü
|
|
NF3
|
--
|
--
|
5.08
|
Limit Level
|
N
|
N
|
|
ü
|
ü
|
ü
|
ü
|
ü
|
ü
|
|
09/04/2024
|
WSR3
|
Ebb
|
Suspended Solid
(SS)
|
--
|
--
|
5.83
|
5.00
|
6.20
|
6.00
|
6.72
|
Action Level
|
N
|
N
|
ü
|
ü
|
ü
|
ü
|
ü
|
|
ü
|
|
WSR4
|
--
|
--
|
5.33
|
Action Level
|
N
|
N
|
ü
|
ü
|
ü
|
ü
|
ü
|
|
ü
|
|
11/04/2024
|
WSR16
|
Flood
|
Suspended Solid
(SS)
|
--
|
--
|
5.75
|
5.00
|
6.40
|
6.00
|
6.93
|
Action Level
|
N
|
N
|
ü
|
ü
|
|
|
ü
|
|
ü
|
|
WSR33
|
--
|
--
|
7.42
|
Limit Level
|
N
|
N
|
ü
|
ü
|
|
|
ü
|
|
ü
|
|
WSR37
|
--
|
--
|
5.92
|
Action Level
|
N
|
N
|
ü
|
ü
|
|
|
ü
|
|
ü
|
|
NF2
|
--
|
--
|
6.50
|
Action Level
|
N
|
N
|
ü
|
ü
|
|
|
ü
|
|
ü
|
|
NF3
|
--
|
--
|
6.58
|
Action Level
|
N
|
N
|
ü
|
ü
|
|
|
ü
|
|
ü
|
|
13/04/2024
|
WSR1
|
Flood
|
Suspended Solid
(SS)
|
--
|
--
|
4.50
|
5.00
|
4.50
|
6.00
|
4.88
|
Action Level
|
N
|
N
|
|
ü
|
|
ü
|
ü
|
|
ü
|
|
WSR2
|
--
|
--
|
4.58
|
Action Level
|
N
|
N
|
|
ü
|
|
ü
|
ü
|
|
ü
|
|
WSR4
|
--
|
--
|
4.33
|
Action Level
|
N
|
N
|
|
ü
|
|
ü
|
ü
|
|
ü
|
|
WSR16
|
--
|
--
|
5.00
|
Limit Level
|
N
|
N
|
|
ü
|
|
ü
|
ü
|
|
ü
|
|
NF1
|
--
|
--
|
4.67
|
Action Level
|
N
|
N
|
|
ü
|
|
ü
|
ü
|
|
ü
|
1)
Control
station value already
exceed either the Action or Limit Level.
2)
No silt plume or pollution
discharge from site area was observed.
3)
Rainfall
was recorded at Tseung Kwan O during
the monitoring period, rainfall may lead to release of SS content
form the soil of the nearby lands (e.g., Country
Park, fill bank).
4)
No action and limit level exceedance observed
at WSR37 (Outfall
Shaft).
5)
Marine
construction activity was completed.
6)
No pre-operation activities related to the release of SS in the reporting period.
7)
Water quality mitigation measures were observed
maintained / implemented properly (double silt curtain).
Conclusion:
During water quality
monitoring on 2 April 2024, 4 April 2024, 6 April 2024,
9 April 2024, 11 April
2024 and 13 April 2024, seventeen (17) Action Level exceedances and eight (8) Limit Level exceedance were recorded during
mid-flood tide. Four
(4) Action Level exceedances and two (2)
Limit Level exceedance were recorded during mid-ebb tide. Total twenty-one (21)
Action Level and ten (10) Limit Level exceedances for SS of impact water
quality monitoring were recorded between 1
April to 15 April 2024.
The marine construction works were completed
on 1 September 2023. The commissioning activities were shown in the table below. The plant and the outfall shaft work normally.
After investigation, all exceedances were considered non-project related.
Pre-operation Activities:
|
02 April 2024
|
04 April 2024
|
|
-
Production of desalinated water
-
Actidaff backwashing
|
-
Production of desalinated water
-
Equipment checking and maintenance
-
Actidaff backwashing
|
|
06 April 2024
|
09 April 2024
|
|
-
Plant fully stopped. No water production.
-
Equipment checking and maintenance
|
-
Production of desalinated water
-
Equipment checking and maintenance
-
Actidaff backwashing
|
|
11 April 2024
|
13 April 2024
|
|
-
Production of desalinated water
-
Equipment checking and maintenance
-
Actidaff backwashing
|
-
Production of desalinated water
-
Equipment checking and maintenance
-
Actidaff backwashing
|
Supporting Photo:
|
Date of exceedance
|
Monitoring station(s)
|
|
02/04/2024
|
|
|
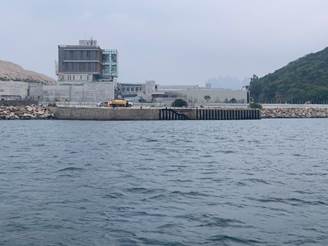
|
|
|
WSR3
|
WSR4
|
WSR37
|
NF1
|
|
|
|
|
|
|
NF2
|
NF3
|
|
|
|
04/04/2024
|
|
|
|
|
|
NF2
|
|
|
|
|
Date of exceedance
|
Monitoring station(s)
|
|
06/04/2024
|
|
|
|
|
|
NF2
|
NF3
|
|
|
|
09/04/2024
|
|
|
|
|
|
WSR3
|
WSR4
|
|
|
|
11/04/2024
|
|
|
|
|
|
WSR16
|
WSR33
|
NF2
|
NF3
|
|
Date of exceedance
|
Monitoring station(s)
|
|
13/04/2024
|
|
|
|
|
|
WSR1
|
WSR2
|
WSR4
|
WSR16
|
|
|
|
|
|
|
NF1
|
|
|
|
|
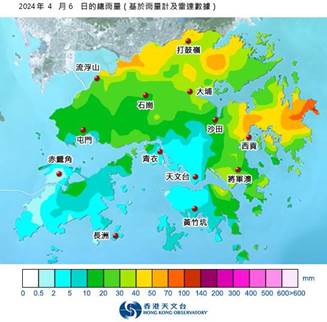
|
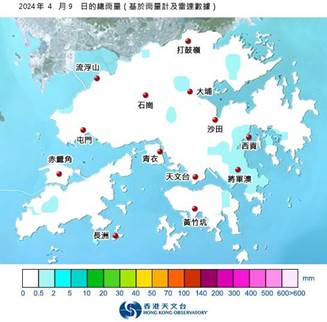
|
|
06 April
2024
|
09 April
2024
|
Bi-Weekly Incident Report
on Action Level or Limit Level Non-Compliance
|
Date of exceedance
|
Monitoring Station
|
Tide
|
Parameter
|
Measurement Result (mg/L)
|
Sampling depth
|
Depth Average Result (mg/L)
|
Action Level (mg/L)
|
Limit Level (mg/L)
|
Exceedance
|
Marine construction activities with
contact with water (Y/N)
|
Exceedance related
to Project (Y/N)
|
Reasons of non-project related exceedance
|
|
95%-
ile
|
Control 120%
|
99%-
ile
|
Control 130%
|
(1)
|
(2)
|
(3)
|
(4)
|
(5)
|
(6)
|
(7)
|
|
16/04/2024
|
WSR4
|
Flood
|
Suspended Solid
(SS)
|
--
|
--
|
5.00
|
5.00
|
5.00
|
6.00
|
5.42
|
Action Level
|
N
|
N
|
|
ü
|
|
ü
|
ü
|
|
ü
|
|
WSR16
|
--
|
--
|
5.33
|
Action Level
|
N
|
N
|
|
ü
|
|
ü
|
ü
|
|
ü
|
|
WSR33
|
--
|
--
|
6.00
|
Limit Level
|
N
|
N
|
|
ü
|
|
ü
|
ü
|
|
ü
|
|
WSR36
|
--
|
--
|
6.00
|
Limit Level
|
N
|
N
|
|
ü
|
|
ü
|
ü
|
|
ü
|
|
18/04/2024
|
NF2
|
Flood
|
Suspended Solid (SS)
|
--
|
--
|
5.33
|
5.00
|
5.40
|
6.00
|
5.85
|
Action Level
|
N
|
N
|
|
ü
|
|
ü
|
ü
|
|
ü
|
|
23/04/2024
|
WSR1
|
Ebb
|
Suspended Solid
(SS)
|
--
|
--
|
7.17
|
5.00
|
9.20
|
6.00
|
9.97
|
Limit Level
|
N
|
N
|
ü
|
ü
|
|
ü
|
ü
|
|
ü
|
|
WSR2
|
--
|
--
|
6.83
|
Limit Level
|
N
|
N
|
ü
|
ü
|
|
ü
|
ü
|
|
ü
|
|
WSR3
|
--
|
--
|
6.67
|
Limit Level
|
N
|
N
|
ü
|
ü
|
|
ü
|
ü
|
|
ü
|
|
WSR4
|
--
|
--
|
8.00
|
Limit Level
|
N
|
N
|
ü
|
ü
|
|
ü
|
ü
|
|
ü
|
|
WSR16
|
--
|
--
|
5.42
|
Limit Level
|
N
|
N
|
ü
|
ü
|
|
ü
|
ü
|
|
ü
|
|
NF1
|
--
|
--
|
7.50
|
Limit Level
|
N
|
N
|
ü
|
ü
|
|
ü
|
ü
|
|
ü
|
|
NF2
|
--
|
--
|
6.17
|
Limit Level
|
N
|
N
|
ü
|
ü
|
|
ü
|
ü
|
|
ü
|
|
NF3
|
--
|
--
|
7.67
|
Limit Level
|
N
|
N
|
ü
|
ü
|
|
ü
|
ü
|
|
ü
|
|
25/04/2024
|
WSR3
|
Ebb
|
Suspended Solid
(SS)
|
--
|
--
|
3.42
|
5.00
|
3.20
|
6.00
|
3.47
|
Action Level
|
N
|
N
|
|
ü
|
|
ü
|
ü
|
|
ü
|
|
WSR33
|
--
|
--
|
3.58
|
Limit Level
|
N
|
N
|
|
ü
|
|
ü
|
ü
|
|
ü
|
|
27/04/2024
|
WSR2
|
Ebb
|
Suspended Solid
(SS)
|
--
|
--
|
3.17
|
5.00
|
3.00
|
6.00
|
3.25
|
Action Level
|
N
|
N
|
|
ü
|
|
|
ü
|
|
ü
|
|
WSR37
|
--
|
--
|
3.42
|
Limit Level
|
N
|
N
|
|
ü
|
|
|
ü
|
|
ü
|
1)
Control
station value already
exceed either the Action or Limit Level.
2)
No silt plume or pollution
discharge from site area was observed.
3)
Rainfall
was recorded at Tseung Kwan O during
the monitoring period, rainfall may lead to release of SS content
form the soil of the nearby lands (e.g., Country
Park, fill bank).
4)
No action and limit level exceedance observed
at WSR37 (Outfall
Shaft).
5)
Marine
construction activity was completed.
6)
No pre-operation activities related to the release of SS in the reporting period.
7)
Water quality mitigation measures were observed
maintained / implemented properly (double silt curtain).
Conclusion:
During water
quality monitoring on 16 April 2024, 18 April 2024, 23 April 2024, 25 April
2024 and 27 April 2024, five (5) Action Level exceedances and two (2) Limit
Level exceedance were recorded during mid-flood tide. Twelve (12) Action Level
exceedances and ten (10) Limit Level exceedances were recorded
during mid-ebb tide. Total seventeen (17) Action Level
and Twelve (12) Limit Level
exceedances for SS of impact water quality monitoring were recorded between 16 April to 30 April
2024.
The marine construction works were completed
on 1 September 2023.
The pre-operation activities were shown in the table below. The plant commissioning and the outfall
shaft work normally. After investigation, all exceedances were considered non-project related.
Pre-operation Activities:
|
16 April 2024
|
18 April 2024
|
|
-
Production of desalinated water
-
ActiDAFF backwashing
|
-
Production of desalinated water
-
ActiDAFF backwashing
-
Equipment checking and
maintenance
|
|
23 April 2024
|
25 April 2024
|
|
-
Production of desalinated water
-
ActiDAFF backwashing
|
-
Production of desalinated water
-
ActiDAFF backwashing
|
|
27 April 2024
|
|
|
-
Production of desalinated water
-
ActiDAFF backwashing
|
Supporting Photo:
|
Date of exceedance
|
Monitoring station(s)
|
|
16/04/2024
|
|
|

|
|
|
WSR4
|
WSR16
|
WSR33
|
WSR36
|
|
18/04/2024
|
|
|
|
|
|
NF2
|
|
|
|
|
23/04/2024
|
|
|
|
|
|
WSR1
|
WSR2
|
WSR3
|
WSR4
|
|
Date of exceedance
|
Monitoring station(s)
|
|
|
|
|
|
|
|
WSR16
|
NF1
|
NF2
|
NF3
|
|
25/04/2024
|
|
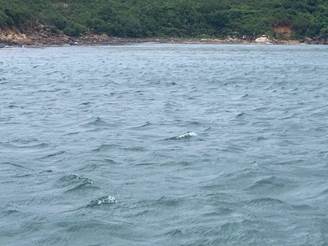
|
|
|
|
WSR3
|
WSR33
|
|
|
|
27/04/2024
|
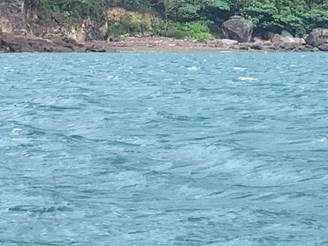
|
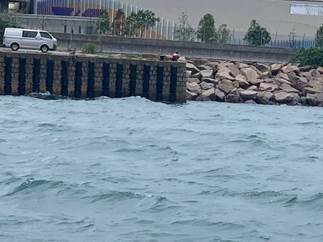
|
|
|
|
WSR2
|
WSR37
|
|
|
|
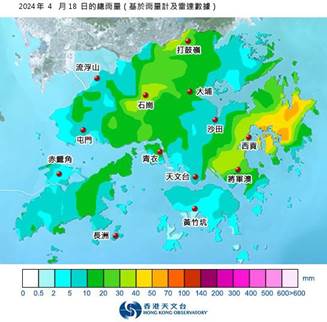
|
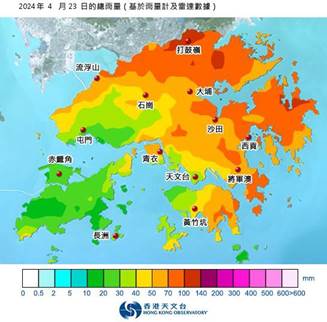
|
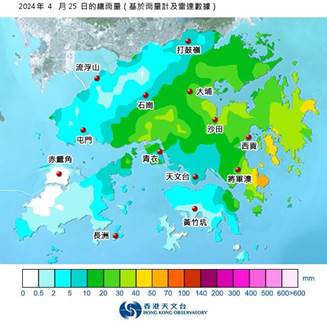
|
|
18 April
2024
|
23 April
2024
|
25 April
2024
|