TKO DP_ Operation Phase Monthly EM&A Reports 2026-05_v2.0
Revision History
|
Rev.
|
Description of Modification
|
Date
|
|
0.
|
1st Issue
|
30/7/2026
|
|
1.
|
2nd Issue
|
5/8/2026
|
i
The copyright of this document
is owned by Aurecon Hong Kong Limited.
It may not be reproduced except with prior written approval
from the Company.
Aurecon Hong Kong
Limited
CONTENTS
Executive Summary............................................................................................................................................................ 1
1.
Basic Contract Information............................................................................................................................... 3
2.
Water Quality.......................................................................................................................................................... 8
3.
Waste....................................................................................................................................................................... 12
4.
Landfill Gas Monitoring................................................................................................................................... 13
5.
Landscape.............................................................................................................................................................. 16
6.
Ecology (Coral Monitoring)........................................................................................................................... 17
7.
Ecology (Fishery Monitoring)....................................................................................................................... 19
8.
Summary of Exceedance, Complaints, Notification of Summons and Prosecutions.............. 22
9.
EM&A Site Inspection....................................................................................................................................... 24
10.
Future Key Issues............................................................................................................................................... 25
11. Conclusions and Recommendations.......................................................................................................... 26
Appendix A Overview of Desalination Plant in Tseung
Kwan O
Appendix B Summary of Implementation Status
of Environmental Mitigation Appendix C Impact
Monitoring Schedule
Appendix D Event/Action Plan
Appendix E Waste Flow
Table
Appendix F Site Inspection Proforma
Appendix G
Appendix H Appendix I
Complaint Log Coral Survey
Report
Fishery Survey
Report
ii
The copyright of this document
is owned by Aurecon Hong Kong Limited.
It may not be reproduced except with prior written approval
from the Company.
Executive Summary
Introduction
A1. The Project, Design,
Build and Operate
First Stage of Tseung
Kwan O Desalination Plant
(TKODP), is a Designated Project under the Environmental Impact Assessment
Ordinance (Cap. 499) (EIAO) and is currently governed by a Further
Environmental Permit (EP No. FEP 01/503/2015/B) for the operation phase of
the Contract.
A2. In accordance with the Environmental Monitoring and Audit
(EM&A) Manual for the Contract, EM&A works
for marine water quality, waste management and ecology should be carried out by Environmental
Team (ET), Aurecon Hong Kong Limited (Aurecon), during the Tseung Kwan O
Desalination Plant.
A3. The TKODP commenced the operation stage on 1 July 2024. This is
the 23rd Operation Phase
Monthly EM&A Report, prepared by Aurecon, for the Contract summarizing the
monitoring results and audit findings of the EM&A programme at and around
Tseung Kwan O Area 137 (TKO 137) during operation of Tseung Kwan O Desalination
Plant in May 2026.
A4. The EM&A programme for this contract has covered
environmental monitoring on water
quality and Contractors environmental performance auditing in the aspects of
dust, landfill gas, water quality, waste management, Landscape and Visual and Ecology.
Summary of exceedance & investigation & follow-up
WATER QUALITY MONITORING
A5. The first-year operation phase marine water quality monitoring
was completed on 30 June 2025. No marine water quality monitoring was conducted
during the reporting period.
A6. According to the approved proposal to change the operation
phase EM&A programme for the 2nd to 10th year, continuous
monitoring of effluent quality was discontinued and replaced with effluent water monitoring in compliance with
discharge license requirements starting from 15 August 2025.
Ecology Impact Monitoring
A7. According to the approved proposal to change the operation
phase EM&A programme for the 2nd to 10th year, coral monitoring
will be conducted on a quarterly
basis starting from August 2025.
A8. Coral monitoring was conducted on 21 May 2026 during the monitoring
period. No sediment, bleaching or increased mortality in the general condition
of all other tagged coral colonies were observed during the monthly operation
phase monitoring period. No
deterioration of the coral community was observed in the ecological monitoring results when
1
The copyright of this document
is owned by Aurecon Hong Kong Limited.
It may not be reproduced except with prior written approval
from the Company.
compared with the
baseline ecological monitoring results. There
is no AL/LL exceedance during the
monitoring period.
A9. Operation phase fishery monitoring for dry season 2026 was
carried out on 7 and 15 February 2026. The survey findings showed that the
abundance and diversity of fish eggs and larvae
are on the low side for the Study Area, and the abundance and diversity
of juveniles are very low for the Study Area. Survey findings
also showed that there was a very week relationship in recorded
families between ichthyoplankton assemblages, adult fish and juvenile
fish in the Study Area, which implies
that the Study Area does not
appear to be an important spawning or nursery grounds for commercial fishes.
Landfill Gas Monitoring
A10. According to the approved proposal to change the operation phase
EM&A programme for the 2nd to 10th year, landfill
gas monitoring will be conducted on a six-month basis starting from August
2025.
A11. No Landfill gas monitoring was conducted during
the reporting period.
Weekly Site Inspections
A12. In this reporting period, bi-weekly site inspections were
carried out by ET on 8 and 18 May 2026 to audit the mitigation measures
implementation status.
A13. According to the approved proposal to change the operation phase
EM&A programme for the 2nd to 10th year, site
inspection will be conducted on a bi-weekly basis starting from 15 August 2025.
Complaint Handling and
Prosecution
A14. No
environmental complaints, notification of summons and prosecution were received
in the reporting period.
Reporting Change
A15. The works of TKODP were substantially completed on 30 June 2024
and the plant commenced the operation phase on 1 July 2024. A Justification of Termination of the
EM&A Programme for the Construction Phase was resubmitted to the EPD on 11 August
2025 and approved by the EPD on 15 August 2025.
A proposal to change the operation phase
EM&A programme was submitted to the EPD on 11 August 2025 and approved by the
EPD on 15 August 2025.
2
The copyright of this document
is owned by Aurecon Hong Kong Limited.
It may not be reproduced except with prior written approval
from the Company.
Basic Contract
Information
Background
1.1.
The Acciona Agua, S.A. Trading,
Jardine Engineering Corporation, Limited and China State
Construction Engineering (Hong Kong) Limited
as AJC Joint Venture (AJCJV)
is contracted to carry out the Design, Build and Operate
First Stage of Tseung Kwan O Desalination Plant (TKODP) under Contract No. 13/WSD/17 (the Contract).
1.2.
Aurecon Hong Kong Limited (Aurecon) is
commissioned by AJCJV to undertake the Environmental Team (ET) services as
required and/or implied, both explicitly and implicitly, in the Environmental
Permit (EP), Environmental Impact Assessment Report (EIA Report) (Register No.
AEIAR-192/2015) and Environmental Monitoring and Audit Manual (EM&A Manual)
for the Contract; and to carry out the Environmental Monitoring and Audit (EM&A) programme in fulfillment of the EIA Reports EM&A
requirements and Contract No.
13/WSD/17 Specification requirements.
1.3.
Pursuant to the Environmental Impact Assessment
Ordinance (EIAO), the Director of Environmental Protection granted the
Environmental Permit (No. EP-01/503/2015/B) to
Water Supplies Department (WSD); and granted
the Further Environmental Permit (No.
FEP-01/503/2015/B) to AJCJV for the Contract.
The Reporting Scope
1.4.
This is the 23rd Operation Phase
Monthly EM&A Report for the Contract which summarizes the key findings
of the EM&A programme of the Tseung
Kwan O Desalination Plant Operation phase during the reporting period
from 1 May to 31 May 2026.
Contract Organization
1.5.
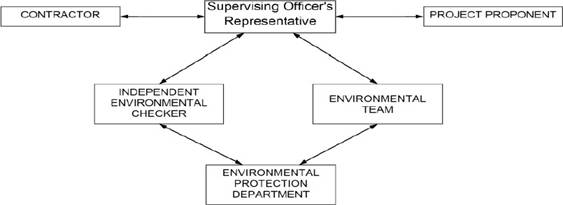
The Contract Organization structure for Operation
Phase is presented in Figure 1.1.
Figure
1.1 Contract Organization Chart
1.6.
Contact details of the key personnel are presented in Table 1.1 below:
3
The copyright of this document
is owned by Aurecon Hong Kong Limited.
It may not be reproduced except with prior written approval
from the Company.
Table 1.1 Contact Details
of Key Personnel
|
Party
|
Position
|
Name
|
Telephone no.
|
|
Contract Proponent
(Water Supplies Department)
|
SE/CM2
|
Milton Law
|
2634-3573
|
|
Supervising Officer
(Binnies Hong Kong Limited)
|
Project Manager
|
Augustine Li
|
2608-7671
|
|
Senior Resident Engineer
|
Mason Pau
|
6765-4131
|
|
The Jardine Engineering Corporation, Limited, China
State Construction Engineering (Hong Kong) Limited and
Acciona Agua, S.A. Trading
|
Project Manager (Acting)
|
Arnes Parra, Victor
|
6468-6710
|
|
Environmental Monitoring Manager
|
Tommy Law
|
6468-1782
|
|
Aurecon Hong Kong
Limited
|
Environmental Team Leader
|
Toby Wan
|
9719-5422
|
|
SGS Hong Kong
Limited
|
Independent
Environmental Checker (IEC)
|
Roy Hung
|
2774-7406
|
Summary of Operation Works
1.7.
Details of the major operation activities
undertaken in this reporting period are shown below.
1.8.
As informed by the Contractor, key activities
carried out in this reporting period for the Contract included the followings:
l Potable Water Production
1.9.
The key environmental mitigation measures implemented for the Contract
in this reporting period associated with the above operation works
include:
·
Regularly monitoring of the effluent
·
Sorting and storage
of general refuse
and operation waste
1.10.
Summary of the valid permits,
licences, and/or notifications on environmental protection for this Contract is presented
in Table 1.2.
Table 1.2 Summary of the Status of Valid Environmental
Licence, Notification, Permit and Documentations
4
The copyright of this document
is owned by Aurecon Hong Kong Limited.
It may not be reproduced except with prior written approval
from the Company.
|
Permit/ Licences
|
Valid Period
|
Status
|
Remark
|
|
From
|
To
|
|
Environmental Permit
|
|
EP-503/2015/B
|
Throughout the Contract
|
Valid
|
-Issued on 3 April
2024
|
|
FEP
01/503/2015/B
|
Throughout the Contract
|
Valid
|
-Issued
on 3 April 2024
|
|
Billing Account for Disposal
|
|
7036276
|
Throughout the Contract
|
Valid
|
-
|
|
Admission Ticket for Disposal of Sludge Waste
to WENT Landfill
|
|
No.127432
|
2 April 2026
|
8 July 2026
|
Valid
|
-
|
|
Chemical Waste Producer Registration
|
|
5213-839-A2987-01
|
Throughout the Contract
|
Valid
|
-
|
|
Wastewater Discharge Licence (Land and Marine works)
|
|
WT00044188-2023
|
16/06/2023
|
30/06/2028
|
Valid
|
-
For Plant T&C
and operation.
-
Variation sampling point S.P.1
is approved by the EPD on
25 June 2024 (EPD ref.: EP640/W3/D1358/46
2874).
EPD advise that we can use the current discharge license
for the anti-scalant dosing and discharge limit. They agreed that the report
can show the 5PPM is the lowest detection limit. The variation of application
was withdrawn on 13
Dec 2024.
|
1.11.
The status for all environmental aspects is presented in Table 1.3.
5
The copyright of this document
is owned by Aurecon Hong Kong Limited.
It may not be reproduced except with prior written approval
from the Company.
Table 1.3 Summary of Status for Key Environmental Aspects
under the EM&A Manual
|
Parameters
|
Status
|
|
Water Quality
|
|
Baseline Monitoring under EM&A Manual
|
The baseline water quality
monitoring was conducted between 12 May 2020 to 6 Jun
2020.
|
|
Operation phase Marine Water
Quality Monitoring
|
Completed on 30 June 2025
|
|
Continuous Monitoring of Effluent
Quality Monitoring
|
According to the
approved proposal to change
the operation phase
EM&A programme for
the 2nd to 10th years, continuous monitoring of effluent quality was discontinued
and replaced with effluent water monitoring in compliance with
discharge license
requirements starting from 15 August
2025.
|
|
Monthly Effluent Quality Monitoring (Discharge License Requirement)
|
On-going
|
|
Waste Management
|
|
Mitigation Measures in Waste Management Plan
|
On-going
|
|
Landfill Gas
|
|
Monthly Monitoring for buildings,
manholes and utility pits within the Project Site and along the fresh water mains
|
According to the approved proposal to change the operation phase EM&A programme for the 2nd to 10th years, landfill gas monitoring will
be conducted on a six-month basis starting from
August 2025.
|
|
Six-month Basis Monitoring for buildings, manholes and
utility pits
within
the Project Site
and along the fresh water mains
|
On-going
|
|
Ecology (Coral)
|
|
Operation phase Regular Coral Monitoring (Monthly)
|
According to the approved proposal to change the operation phase EM&A programme for the 2nd to 10th years, coral
monitoring will be conducted on a quarterly basis
starting from
August 2025.
|
|
Operation phase Regular Coral Monitoring (Quarterly)
|
On-going
|
|
Ecology (Fishery)
|
|
Operation phase Regular Fishery Monitoring (Seasonally)
|
On-going
|
6
The copyright of this document
is owned by Aurecon Hong Kong Limited.
It may not be reproduced except with prior written approval
from the Company.
|
Parameters
|
Status
|
|
Landscape
|
|
Weekly
Operation phase Landscape and Visual Site Inspection
|
According to the
approved proposal to change
the operation phase
EM&A programme for
the 2nd to 10th years, site inspection will
be
conducted on a bi-weekly basis starting from 15
August 2025.
|
|
Bi-Weekly Operation phase Landscape and Visual Site Inspection
|
On-going
|
|
Environmental Audit
|
|
Weekly Site Inspection covering Measures of Air Quality, Water Quality,
Waste, Ecological Quality, Fisheries, Landscape and Visual
|
According to the
approved proposal to change
the operation phase
EM&A programme for
the 2nd to 10th years, site inspection will be conducted on a bi-weekly basis starting from
15 August 2025.
|
|
Bi-Weekly Site Inspection covering
Measures of Air Quality, Water
Quality, Waste, Ecological Quality, Fisheries, Landscape and Visual
|
On-going
|
1.12. Other than the EM&A work by ET, environmental briefings,
trainings, and regular environmental management meetings were conducted, in
order to enhance environmental awareness and closely monitor the environmental
performance of the contractors.
1.13. The EM&A programme has been implemented in accordance with the
recommendations presented in the approved EIA Report and the EM&A Manual. A
summary of implementation status of the environmental mitigation measures for the operation phase of the Contract during the reporting period is provided in
Appendix B.
7
The copyright of this document
is owned by Aurecon Hong Kong Limited.
It may not be reproduced except with prior written approval
from the Company.
Water Quality
2.1.
In accordance with the recommendations of the EIA, water
quality monitoring is required
during operation phase. The following Section provides details of the water
quality monitoring to be undertaken by the Environmental Team (ET) to verify
the distance of sediment and brine plume dispersion and to identify
whether the potential
exists for any indirect impacts to occur to
ecological sensitive receivers.
2.2.
The first-year operation phase marine water
quality monitoring was completed on 30 June 2025. No marine water quality
monitoring was conducted during the reporting period.
2.3.
According to the approved proposal
to change the operation phase EM&A programme for the 2nd to 10th years, continuous
monitoring of effluent quality was discontinued and replaced with effluent
water monitoring in compliance with discharge license requirements starting
from 15 August 2025.
WATER DISCHARGE LICENSE (WT00044188-2023
PART
1)
2.4.
In accordance with the WT00044188-2023 Part 1,
the sampling should be followed the specified frequency, and the parameters of
the sample should not be exceeded the limit stated as the water discharge
license. Details derived limit levels for water quality are presented in Table
2.1.
Table 2.1 Derived Limit Levels for Water Quality
|
Parameters
|
Limit
|
|
Monitoring of Effluent Quality
|
|
Flow Rate in m3/day
|
216841
|
|
Temperature in °C
|
Maximum 40
|
|
Salinity
|
71347
|
|
SS in mg/L
|
13
|
|
pH
|
6-9
|
|
Iron in mg/L
|
0.6
|
|
Total residual chlorine in mg/L
|
0.1
|
|
Total Inorganic Nitrogen in mg/L
|
2
|
|
Total Phosphorous in mg/L
|
1
|
|
Sodium Metabisulphite in mg/L
|
0.5
|
|
Anti scalant in mg/L*
|
2.2
|
*Remark:
1. Anti-scalant water quality
testing will only be conducted
whenever anti-scalant dosage
is adopted.
8
The copyright of this document
is owned by Aurecon Hong Kong Limited.
It may not be reproduced except with prior written approval
from the Company.
Monitoring Location
2.5.
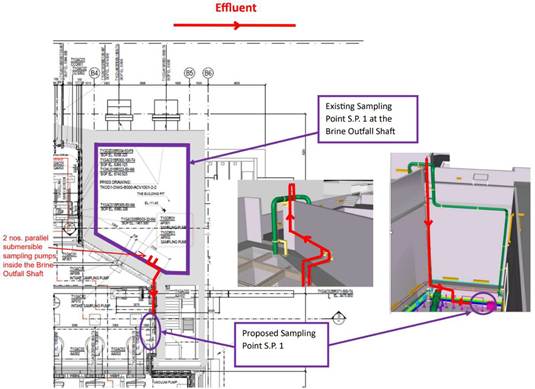
In accordance with the discharge license, the Monitoring shall be sampling
at Brine Outfall Shaft.
Monitoring Results and Observations
2.6.
According to the contractor's information, the
Anti-scalant dosage commenced on 10 April 2025. The Anti-scalant water quality test was also conducted starting
from the same date.
2.7.
The weekly In-situ monitoring was carried out on
2, 8, 15, 22 and 29 April 2026 and the monthly laboratory measurement was
carried out on 13 April 2026.
2.8.
No exceedance of the results was obtained during
the reporting period. The detailed results are summarized in Table 2.2, 2.3 and
2.4.
Table 2.2 Summary of In-situ Results
for Discharge License
(Weekly)
|
Date
|
Determinant
|
Results
|
Duplicate
|
Average
|
|
6 May 2026
|
Temp (°C)
|
26.0
|
26.2
|
26.1
|
|
Salinity (ppm)
|
56662
|
56570
|
56616
|
|
pH
|
8.0
|
7.8
|
7.9
|
|
Total Residual Chlorine (mg/L)
|
0.04
|
0.03
|
0.04
|
|
13 May
2026
|
Temp (°C)
|
27.0
|
27.0
|
27.0
|
|
Salinity (ppm)
|
56741
|
56746
|
56744
|
|
pH
|
7.7
|
7.9
|
7.8
|
|
Total Residual Chlorine (mg/L)
|
0.03
|
0.03
|
0.03
|
9
The copyright of this document
is owned by Aurecon Hong Kong Limited.
It may not be reproduced except with prior written approval
from the Company.
|
20 May
2026
|
Temp (°C)
|
27.7
|
27.7
|
27.0
|
|
Salinity (ppm)
|
56580
|
56585
|
56583
|
|
pH
|
7.9
|
7.9
|
7.9
|
|
Total Residual Chlorine (mg/L)
|
0.03
|
0.04
|
0.04
|
|
27 Apr 2026
|
Temp (°C)
|
29.0
|
29.0
|
29.0
|
|
Salinity (ppm)
|
56175
|
56177
|
56176
|
|
pH
|
7.7
|
7.8
|
7.8
|
|
Total Residual Chlorine (mg/L)
|
0.03
|
0.04
|
0.04
|
Table 2.3 Summary of Lab Results
for Discharge License
(Monthly)
|
Date
|
Determinant
|
Results
|
|
6 May 2026
|
Flow Rate (m3/day)
|
Shown in Table
2.4
|
|
Suspended Solids (mg/L)
|
<2
|
|
Total Inorganic Nitrogen (mg/L)
|
0.48
|
|
Total Phosphorous (mg/L)
|
<0.01
|
|
Iron (mg/L)
|
<0.1
|
|
Sodium Metabisulphite (mg/L)1
|
<2
|
|
ACUMER 4035 (mg/L)2
|
N/A
|
Remark:
1.
As confirmed by various laboratories in
Hong Kong, the lowest detection limit for Sodium Metabisulphite is <2 mg/L. Due to the limitation of the laboratory, the
lowest result for Sodium Metabisulphite will only be shown as < 2 mg/L.
2.
As discussed and agreed with EPD on 12
December 2024, since the lowest detection limit of anti-scalant chemical(s)
(ACUMER 4035) in Hong Kong is 5 mg/L due to the limitation of laboratory, the
lowest measurement result of anti-scalant chemical(s) (ACUMER 4035) will only be shown as
< 5mg/L.
Table 2.4 Summary of Daily Flow Rate of Reporting Period
|
Date
|
Outfall (m3/day)
|
|
1-May-26
|
26.5
|
|
2-May-26
|
3,177.21
|
|
3-May-26
|
93.5
|
|
4-May-26
|
17,304.94
|
|
5-May-26
|
0.00
|
|
6-May-26
|
14,780.23
|
|
7-May-26
|
0.00
|
|
8-May-26
|
13,533.96
|
|
9-May-26
|
0.00
|
|
10-May-26
|
626
|
|
11-May-26
|
16,214.95
|
|
12-May-26
|
0.00
|
|
13-May-26
|
11,337.48
|
|
14-May-26
|
0.00
|
|
15-May-26
|
14,526.63
|
|
16-May-26
|
0.00
|
|
17-May-26
|
635
|
|
18-May-26
|
16,183.19
|
|
19-May-26
|
0.00
|
|
20-May-26
|
12,637.53
|
|
21-May-26
|
0.00
|
|
22-May-26
|
20,359.00
|
|
23-May-26
|
0.00
|
10
The copyright of this document
is owned by Aurecon Hong Kong Limited.
It may not be reproduced except with prior written approval
from the Company.
|
24-May-26
|
0.00
|
|
25-May-26
|
191.50
|
|
26-May-26
|
12,490.41
|
|
27-May-26
|
12,618.50
|
|
28-May-26
|
0.00
|
|
29-May-26
|
14,101.94
|
|
30-May-26
|
0.00
|
|
31-May-26
|
0.00
|
11
The copyright of this document
is owned by Aurecon Hong Kong Limited.
It may not be reproduced except with prior written approval
from the Company.
Waste
3.1. The waste generated
from this Contract
includes inert construction and demolition (C&D)
materials, and non-inert
C&D materials. Non-inert C&D materials are made up of general refuse,
vegetative wastes and recyclable wastes
such as plastics
and paper/cardboard packaging waste. Steel materials
generated from the Contract are
also grouped into non-inert C&D materials as the materials were not disposed of with other inert C&D materials. With
reference to relevant handling records and trip tickets of this Contract, the
quantities of different types of waste generated in the reporting
month are summarized in Table 3.1.
Details of cumulative waste management data are presented
as a waste flow table in Appendix
E.
Table 3.1 Quantities of Waste Generated from the Contract
during the reporting period
|
Reporting Month
|
Actual Quantities of Inert C&D Materials Generated Monthly
|
Actual Quantities of C&D Wastes
Generated Monthly
|
|
Total
Quantity Generated
|
Hard Rock
and Large Broken Concrete
|
Reused
in the Contract
|
Reused
in other Projects
|
Disposed as Public
Fill
|
Imported Fill
|
Metals
|
Paper / cardboard
packaging
|
Plastics (1)
|
Chemical Waste
|
Others, e.g., general refuse
|
|
(in 000kg)
|
(in 000kg)
|
(in 000kg)
|
(in 000kg)
|
(in 000kg)
|
(in 000kg)
|
(in 000kg)
|
(in 000kg)
|
(in 000kg)
|
(in 000kg)
|
(in 000kg)
|
|
May 2026
|
0.000
|
0.000
|
0.000
|
0.000
|
0.000
|
0.000
|
0.000
|
0.000
|
0.000
|
0.000
|
5.890
|
Notes: (1) Plastics
refer to plastic
bottles / containers, plastic sheets / foam from packaging material
3.2.
No dewater sludge
was generated by the operation
in the reporting period.
12
The copyright of this document
is owned by Aurecon Hong Kong Limited.
It may not be reproduced except with prior written approval
from the Company.
Landfill Gas
Monitoring
Monitoring Requirement
4.1.
In accordance with Section 11 of the EM&A Manual, monthly monitoring of landfill gas is required for the
first year of operation at buildings within the Project Site and consultation
zone. Part of the desalination plant
and the indicative area of natural slope mitigation works fall within the SENT
Landfill Extension Consultation Zone; and part of the 1,200 mm diameter
freshwater mains along Wan Po Road falls within the SENT Landfill and SENT
Landfill Extension Consultation Zones, TKO Stage II/III Restored Landfill and
TKO Stage I Restored Landfill Consultation Zones.
4.2.
Routine monitoring is required at buildings within the Project
Site and consultation zones. The monitoring frequency will be monthly for the first
year of operation.
4.3.
For the manholes
and utility pits within
the Project Site and along the fresh water mains, each manhole/
utility pit should be monitored
with two measurements (at mid depth and
base). Each measurement should be
monitored for a minimum of 10 minutes. A
steady reading and peak reading should be recorded at each manhole/ utility pit
and for each measurement.
4.4.
Monitoring oxygen, methane, carbon dioxide and
barometric pressure would be performed monthly during the operation phase.
Monitoring Location
4.5.
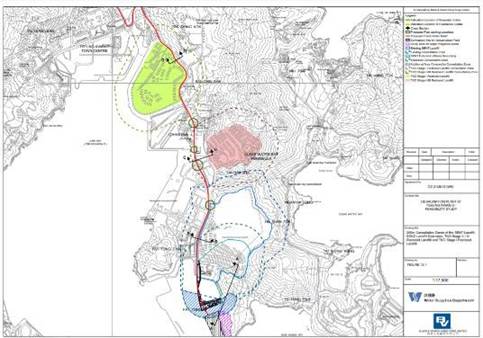
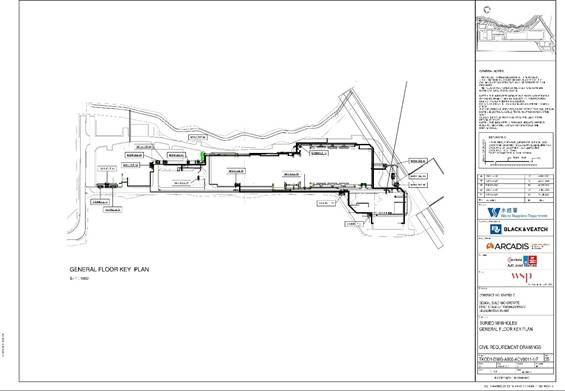
The area required
to be monitored for landfill
gas in the reporting period is shown in
Figure 4.1, Figure 4.2 and Figure 4.3.
Figure 4.1 Overview
of the SENT Extension Consultation Zone and the Contract Site Area
13
The copyright of this document
is owned by Aurecon Hong Kong Limited.
It may not be reproduced except with prior written approval
from the Company.
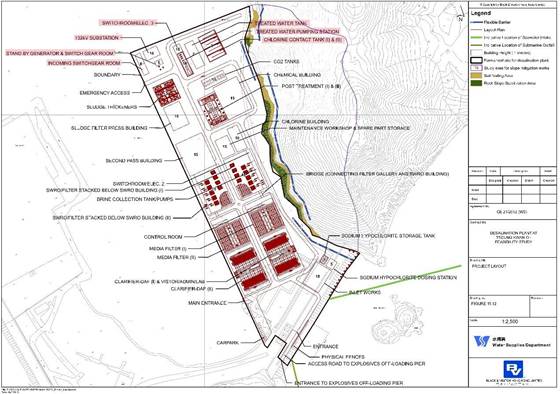
Figure 4.2 Landfill
Gas Monitoring Location
For Building
Figure 4.3 Landfill
Gas Monitoring Location
For Manholes/Pits
14
The copyright of this document
is owned by Aurecon Hong Kong Limited.
It may not be reproduced except with prior written approval
from the Company.
Monitoring Parameters
4.6.
The landfill
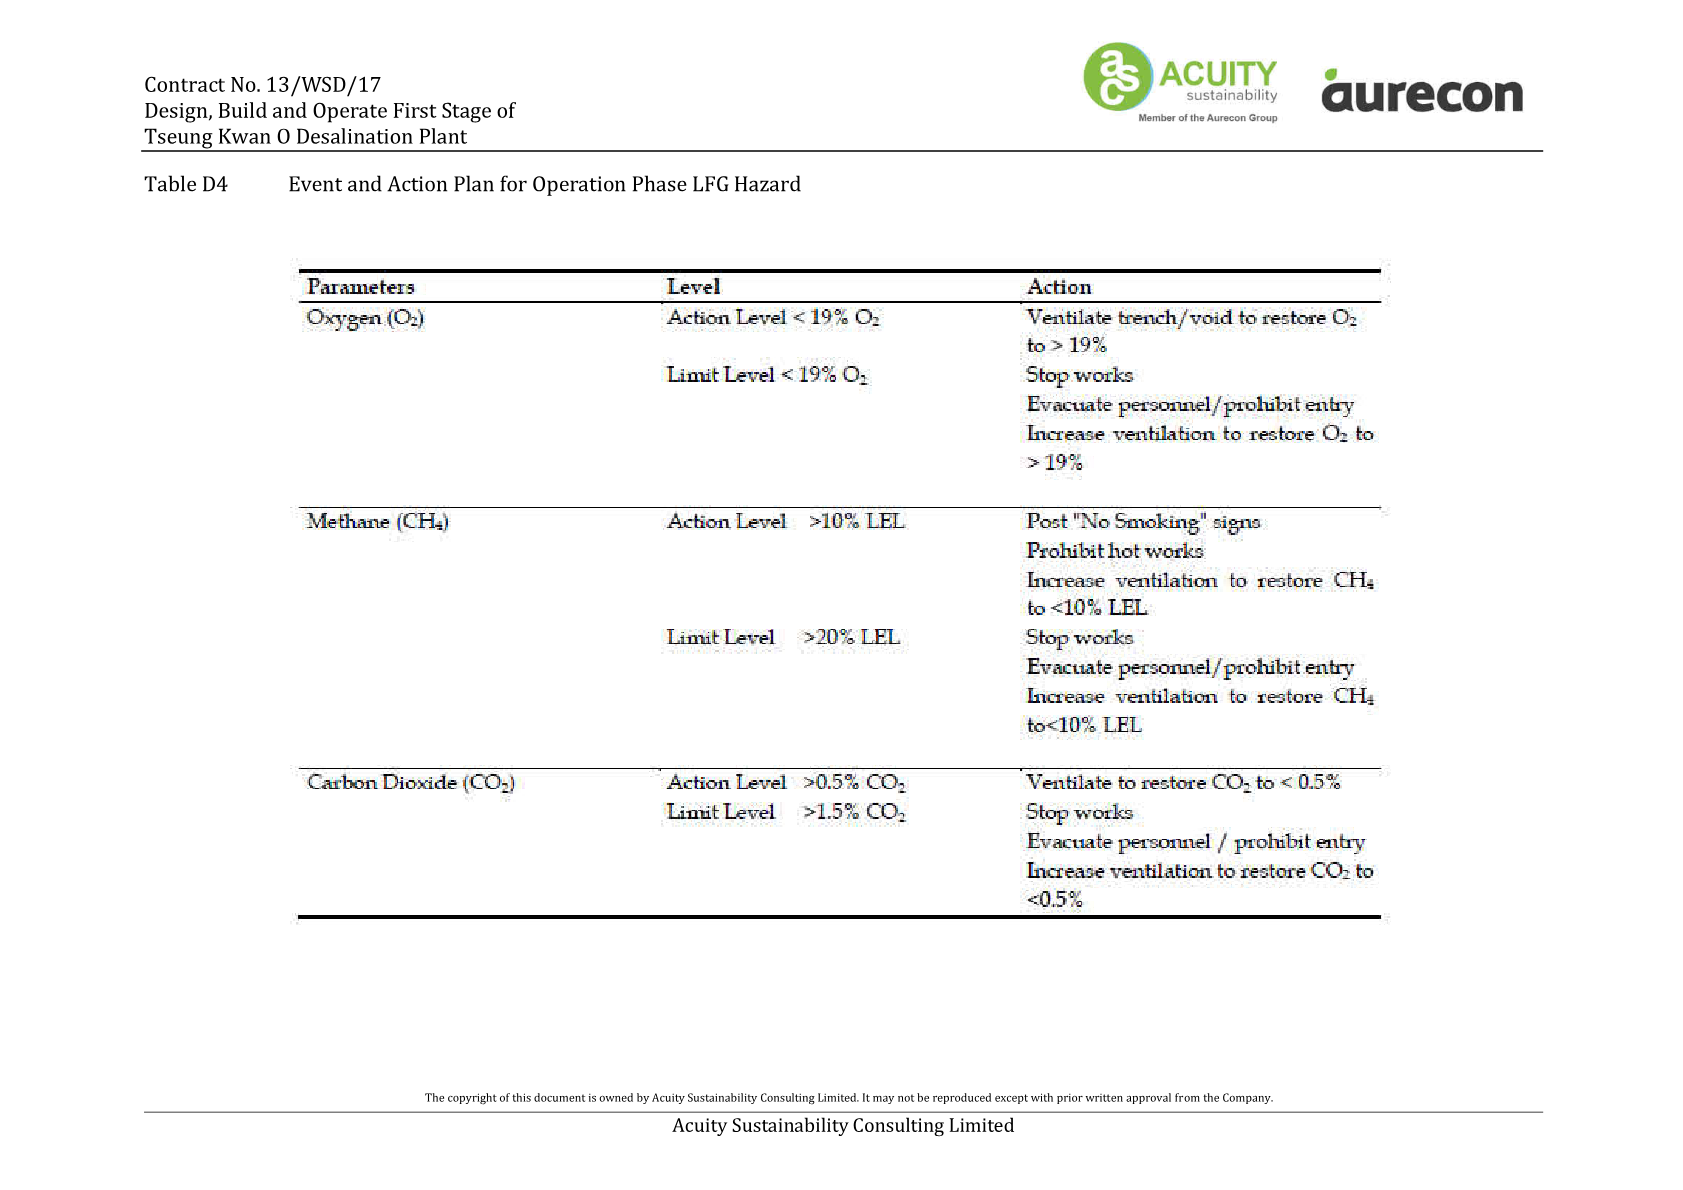
gas monitoring parameters and the action and limit level are summarized in
Table 4.1.
Table 4.1 Action and Limit Level
for Landfill Gas Monitoring Equipment
|
Parameters
|
Action Level
|
Limit Level
|
|
Oxygen (O2)
|
<19% O2
|
<19% O2
|
|
Methane (CH4)
|
>10% LEL
|
>20% LEL
|
|
Carbon Dioxide (CO2)
|
>0.5% CO2
|
>1.5% CO2
|
MONITORING EQUIPMENT
4.7.
Landfill Gas monitoring was carried out using
intrinsically-safe, portable multi-gas monitoring instruments. The gas
monitoring equipment is:
·
Complying with the Landfill Gas Hazard
Assessment Guidance Note as intrinsically safe;
·
Capable of continuous barometric pressure and gas pressure
measurements;
·
Normally operated in diffusion mode unless required
for spot sampling, when it should be
capable of operating by means of an aspirator or pump;
·
Having low battery,
fault and over range indication incorporated;
·
Capable of storing monitoring data, and shall be capable of being downloaded directly;
·
Measure in the following ranges:
|
methane
|
0-100% Lower
Explosion Limit (LEL)
and 0-100% v/v;
|
|
oxygen
|
0-25%
V/V;
|
|
carbon
dioxide
|
0-5%
v/v; and
|
|
barometric pressure
|
mBar
(absolute)
|
alarm (both audibly
and visually) in the event that the concentrations of the following are exceeded:
|
methane
|
>10% LEL;
|
|
oxygen
|
<19%
|
|
carbon
dioxide
|
>0.5% by volume
|
|
barometric pressure
|
mBar
(absolute)
|
Monitoring results and observations
4.8.
According to the approved proposal
to change the operation phase EM&A programme for the 2nd to 10th year, landfill gas monitoring will be conducted
on a six-month basis starting from August 2025.
4.9.
No Landfill gas monitoring was conducted during the reporting period.
15
The copyright of this document
is owned by Aurecon Hong Kong Limited.
It may not be reproduced except with prior written approval
from the Company.
Landscape
Monitoring Requirements
5.1.
In accordance with Section 8.1 of the EM&A Manual,
weekly site audit
shall be carried
out by the ET including checking
whether good site practices are being properly
implemented by the Contractor and the extent of the works area within
the Clear Water Bay Country Park should be checked by the ET during the weekly
site audit.
Site Inspection
5.2.
Bi-Weekly site
audit was carried out by the ET in
the reporting month. Health conditions were concerned with trees. The
contractor has been reminded to provide proper maintenance.
5.3.
If non-compliance were found during the operation
phase, the actions
in accordance with the Event and Action Plan will be
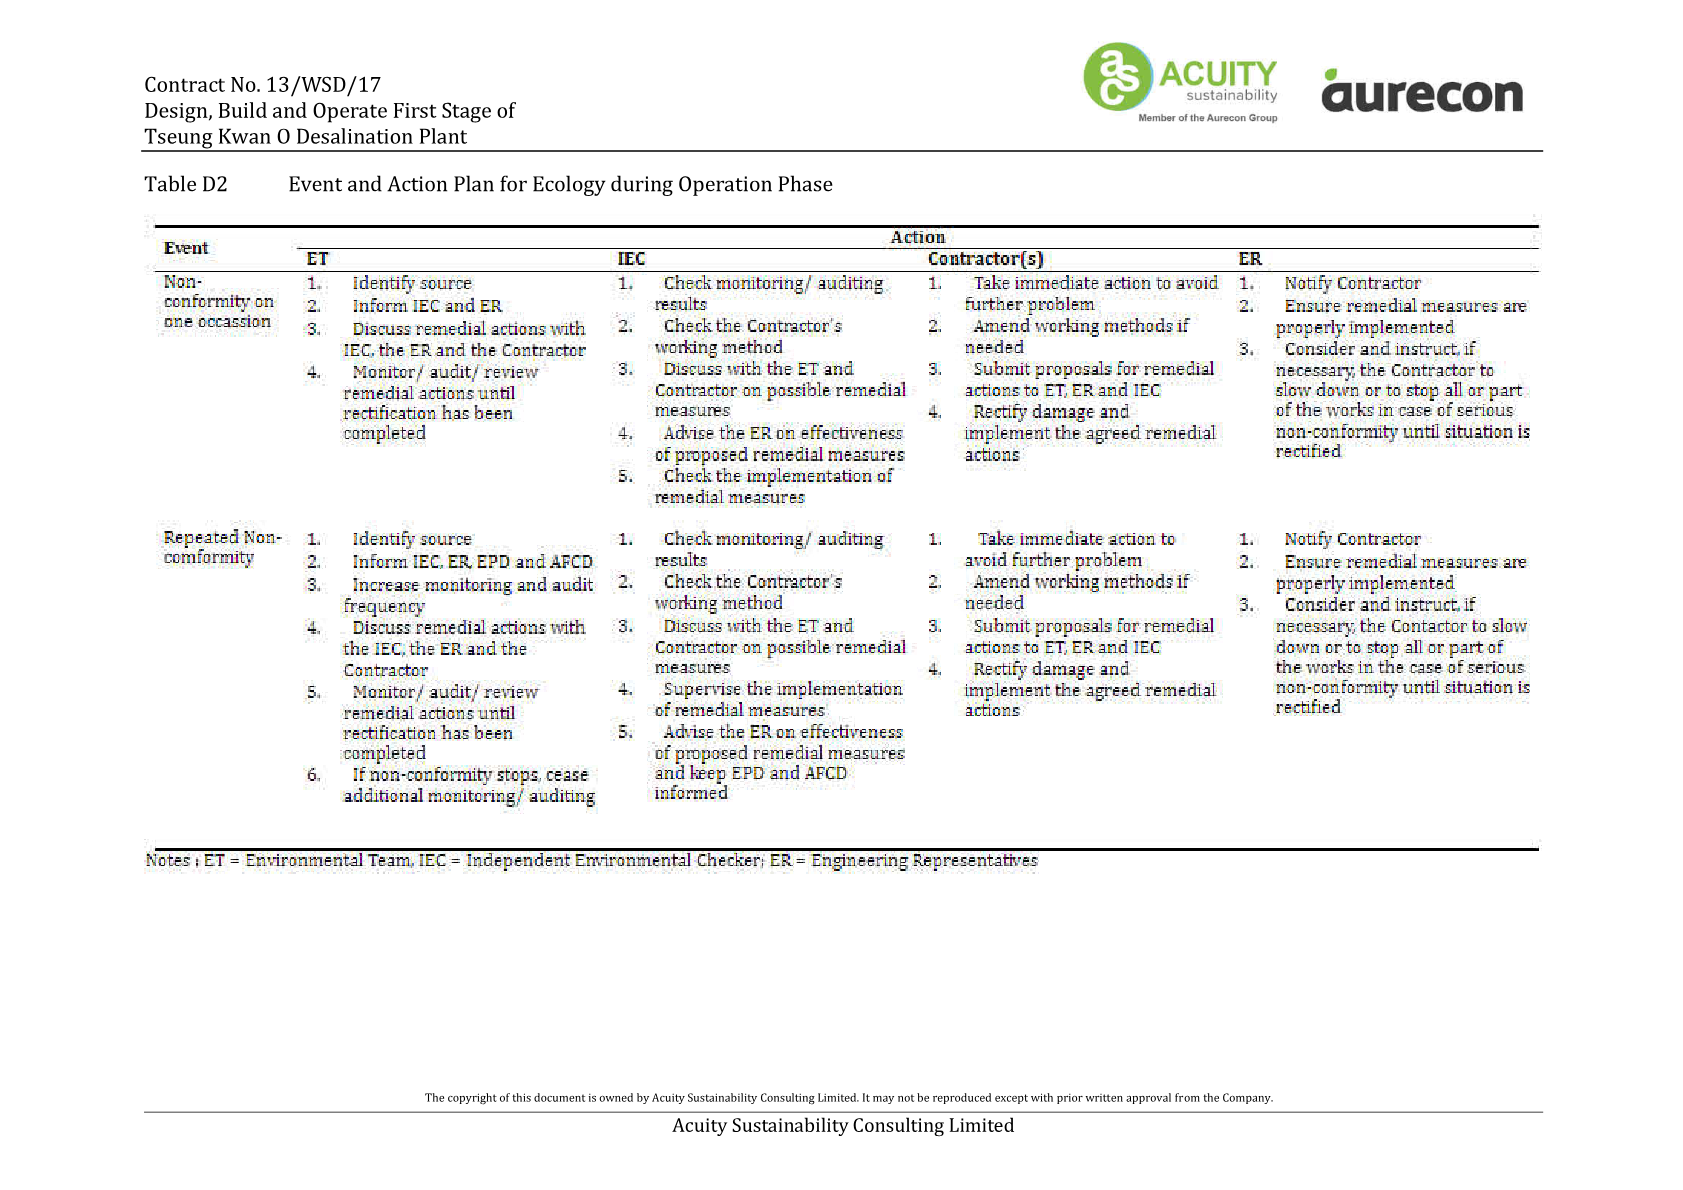
carried out according to Appendix D.
16
The copyright of this document
is owned by Aurecon Hong Kong Limited.
It may not be reproduced except with prior written approval
from the Company.
Ecology (Coral
Monitoring)
6.1.
Under the approval
conditions of the EIA Report
for the Project, an EM&A
programme on coral for the
operation phase of the Project is recommended. Pursuant to these EIA approval
conditions and Condition 3.1 of the EP and FEP, details of the regular coral
monitoring programme have been proposed based on the baseline coral monitoring
results in the Report on operation Baseline Coral Monitoring and Regular Coral
Monitoring Methodology.
Monitoring Location
6.2.
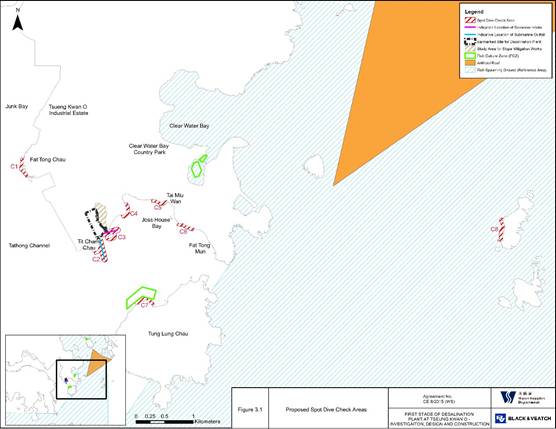
In accordance with Appendix B Section 5.1 of the approved supplementary EM&A Manual, two
indirect impact sites (C2 and C3) and one control site (C8) as shown in Figure
6.1 should be monitored during the operation Phase. Operation coral survey
should be conducted at the indirect impact and control sites. Ten selected hard
coral colonies with similar species should be tagged at each of the control and
indirect impact sites before commencement of
the operation phase. Tagged hard
coral colonies should be monitored
in open waters during the operation phase.
Figure 6.1 Spot Dive Check Areas Two Proposed
Indirect Impact Sites (C2 and C3) and one
control site (C8) during Operation Phase
Action and Limit Levels
6.3.
The Action and Limit Levels
have been set based on the derivation criteria specified in the
EM&A Manual. The Action/Limit Levels have been derived and are presented in
Table 6.1.
17
The copyright of this document
is owned by Aurecon Hong Kong Limited.
It may not be reproduced except with prior written approval
from the Company.
Table 6.1 Action and Limit Level for Coral
Monitoring Equipment
|
Parameter
|
Action Level
Definition
|
Limit Level
Definition
|
|
Mortality
|
If
during Impact Monitoring a 15% increase in the percentage of partial
mortality on the corals
occurs at more than
20% of the tagged indirect impact
site coral colonies that
is not recorded on the
tagged corals at the control site, then the Action Level is exceeded
|
If
during Impact Monitoring a 25% increase in the percentage of partial
mortality on the corals
occurs at more than 20%
of the tagged indirect impact
site coral colonies that
is not recorded on the tagged corals at the
control site, then the Limit Level is exceeded
|
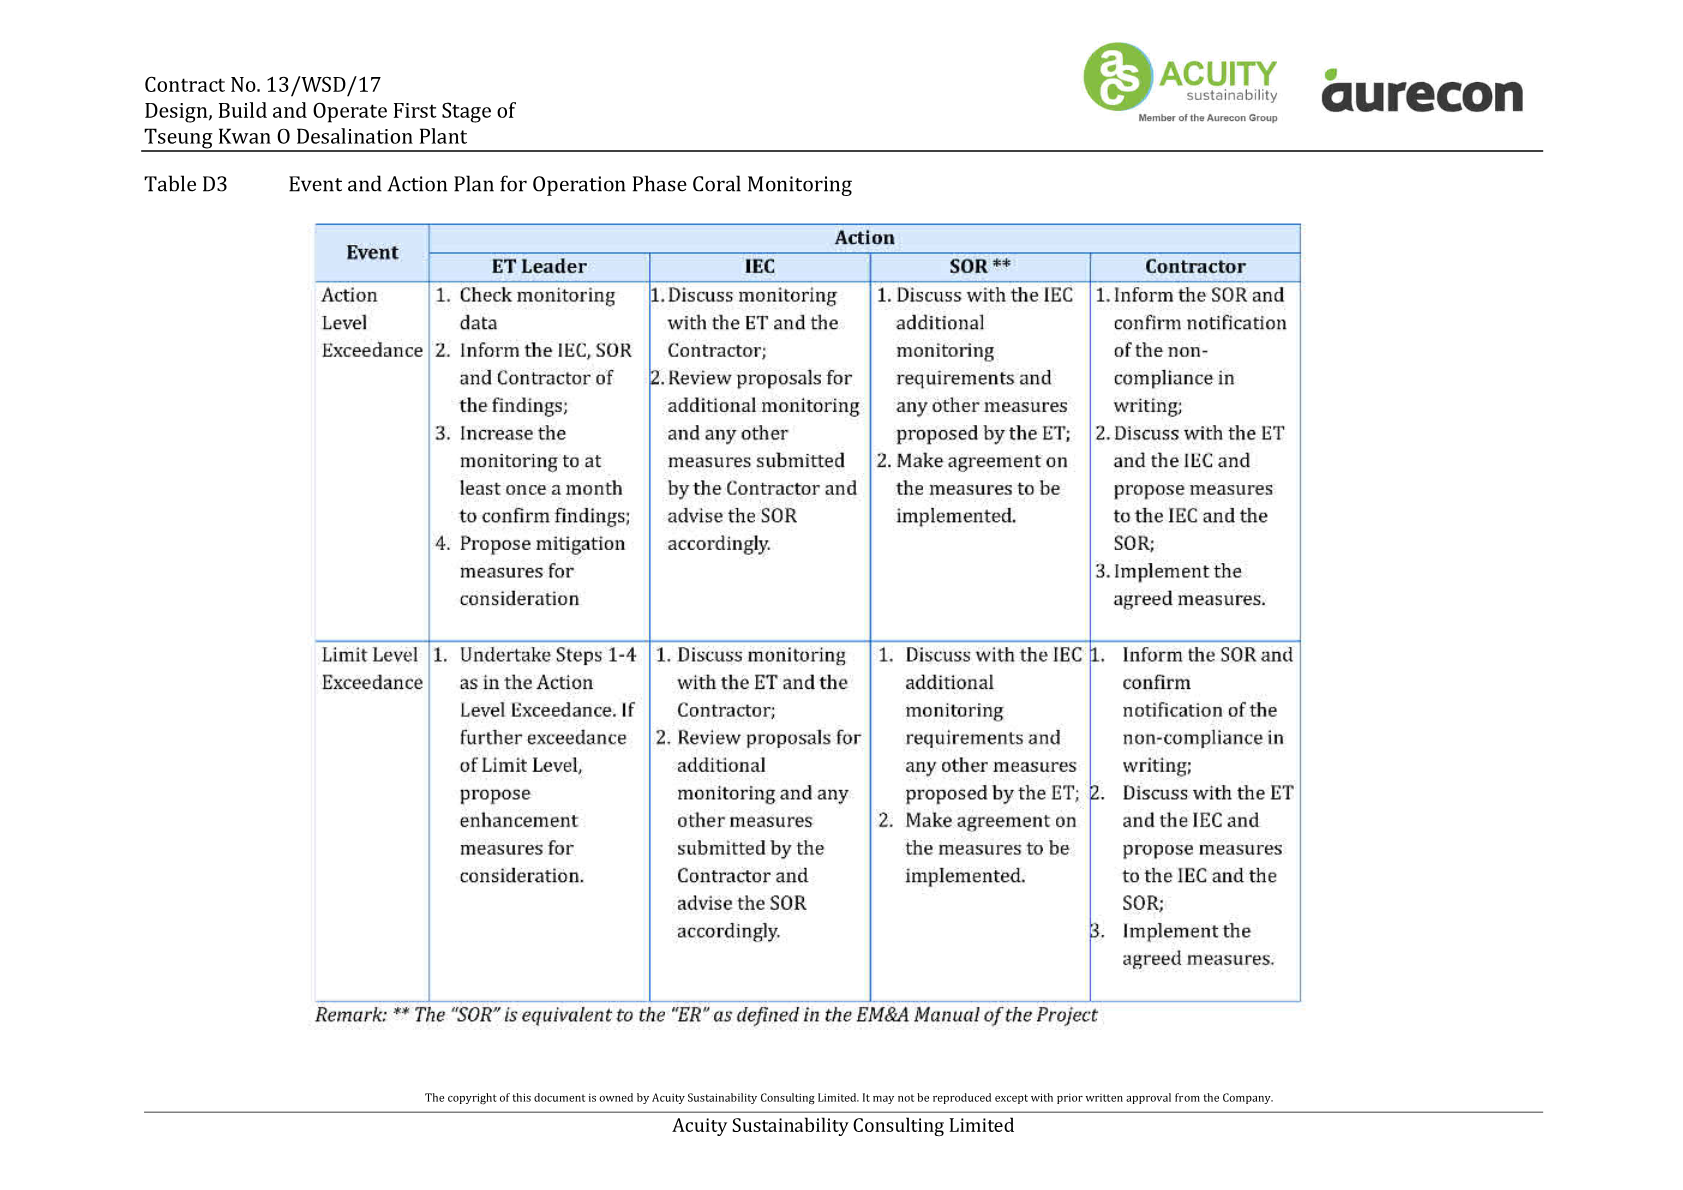
Note: If the defined Action Level or Limit Level for coral monitoring is exceeded, the actions as set out in
Appendix D, Table D3 will be implemented.
6.4.
If non-compliance were found during
the opertaion works,
the actions in accordance with the Event and Action Plan will be
carried out according to Appendix D.
Monitoring Frequency
6.5.
Operation phase coral
monitoring shall be monitored once per month
as the requirement of the first year of operational phase.
Monitoring Result and Observation
6.6.
According to the approved proposal
to change the operation phase EM&A programme for the 2nd to 10th year, coral monitoring will be conducted
on a quarterly basis starting
from August 2025.
6.7.
Coral monitoring was conducted on 21 May 2026 during the reporting period. No sediment, bleaching or increased mortality
in the general condition of all other
tagged coral colonies
were observed during the monthly operation phase monitoring period. No deterioration of the coral community was observed in the ecological monitoring results when compared with the baseline ecological monitoring results.
There is no AL/LL exceedance during the monitoring period. Details of the monitoring results is presented in Appendix H.
18
The copyright of this document
is owned by Aurecon Hong Kong Limited.
It may not be reproduced except with prior written approval
from the Company.
Ecology (Fishery
Monitoring)
7.1.
The purpose of the operation
phase regular fisheries
monitoring programme is to monitor the potential impacts on fisheries
resources in the vicinity of the project site. Apart from the regular fisheries
monitoring programme, a water quality monitoring programme in addition to the
water quality monitoring programme in the approved EM&A Manual is also
described in Section 2.4 to (i) provide supplementary information in the
interpretation of the findings of the fisheries monitoring and (ii) assist the
monitoring of the potential impact on the Tung Lung Chau Fish Culture Zone
(FCZ) in Joss House Bay.
Monitoring Location
7.2.
In accordance with Section 2.3 of the approved
Methodology Paper on Regular Fisheries Monitoring, it is recommended to set up
six (6) fisheries monitoring locations in Joss House Bay and its vicinity to
monitor the fisheries resources.
7.3.
Two (2) sampling locations are set up in close
proximity of the direct footprint of the proposed submarine utilities around
TKO Area 137. These sampling locations represent the potential Project impact
zones (i.e. areas at and in close proximity to the footprint of the proposed
submarine utilities that will be directly affected by the Project works).
7.4.
Two (2) gradient locations are proposed between
the proposed submarine utilities and Tung Lung Chau FCZ to assist in the
interpretation and identification of any potential fisheries impact in the
vicinity of the FCZ.
7.5.
Two (2) reference
locations are proposed
in the outer Joss House Bay between
the waters of Tung Lung Chau and Fat Tong Mun. These reference
locations are further
away and will not be affected by the Project
discharge (based on the EIA prediction) and will serve as control stations. Any
significant fisheries impact identified at the reference locations should be caused by other natural
factors or non-Project activities. The trends
of fisheries conditions
recorded in the reference locations
will be used to assist in the
interpretation of the trends of fisheries impact identified in the impact and
gradient locations.
7.6.
The coordinates of the proposed
monitoring locations are shown in Figure 7.1.
19
The copyright of this document
is owned by Aurecon Hong Kong Limited.
It may not be reproduced except with prior written approval
from the Company.
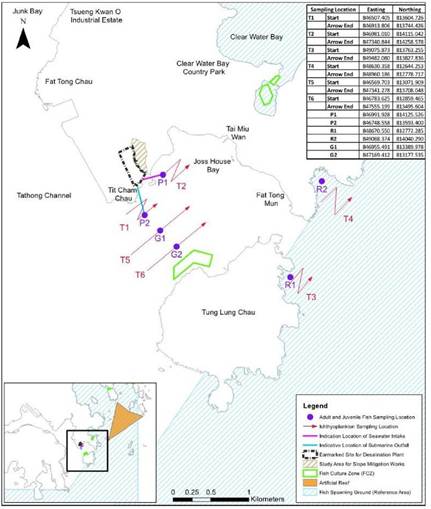
Figure 7.1 Monitoring Location of Regular
Fishery Monitoring during
Operation Phase
Monitoring Frequency
7.7.
Operation phase fishery monitoring shall be
carried out 2 times in wet season (April to October) and 2 times in dry season
(December to March) to examine the following:
·
Fish species composition;
·
Abundance: number of fish captured;
·
Diversity of fish resources: species
diversity and evenness;
·
Size: range of total length;
Biomass in weight;
and
·
Values of catches of commercial species: catch
per unit effort (CPUE) and yield per unit effort (YPUE).
Monitoring Result and Observation
7.8. Operation phase fishery monitoring for dry season 2026 was carried
out on 7 and 15 February 2026. The survey findings showed that the abundance
and diversity of fish eggs and larvae
are on the low side for the Study Area, and the abundance and diversity
20
The copyright of this document
is owned by Aurecon Hong Kong Limited.
It may not be reproduced except with prior written approval
from the Company.
of juveniles are very low for the Study Area. Survey findings
also showed that there was a very week relationship in recorded
families between ichthyoplankton assemblages, adult fish and juvenile
fish in the Study Area, which implies
that the Study Area does not
appear to be an important spawning or nursery grounds for commercial fishes.
Details of the survey finding is presented in Appendix I.
21
The copyright of this document
is owned by Aurecon Hong Kong Limited.
It may not be reproduced except with prior written approval
from the Company.
8.
Summary of Exceedance,
Complaints, Notification of Summons and Prosecutions
8.1.
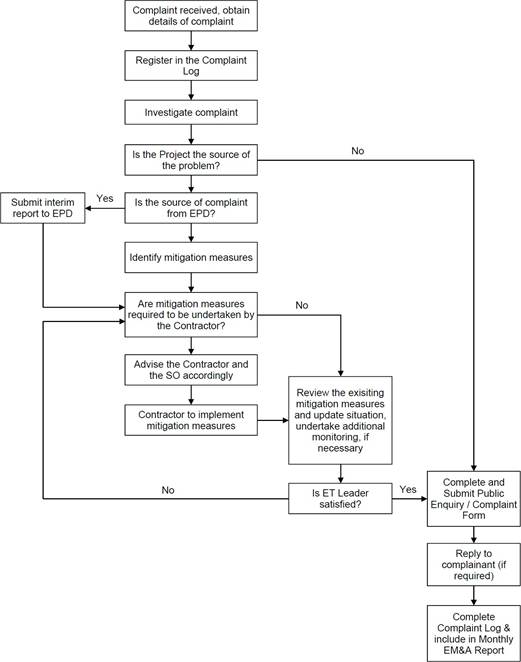
The Environmental Complaint
Handling Procedure is shown in below Figure
9.1:
Figure
9.1 Environmental Complaint Handling Procedures
22
The copyright of this document
is owned by Aurecon Hong Kong Limited.
It may not be reproduced except with prior written approval
from the Company.
8.2.
The first-year operation phase marine water
quality monitoring was completed on 30 June 2025. No marine water quality
monitoring was conducted during the reporting period.
8.3.
Effluent Quality was conducted sampling point in
the reporting month. No exceedance of the results was obtained during the
reporting period.
8.4.
Coral monitoring was conducted on 21 May 2026
during the reporting period. No
sediment, bleaching or increased mortality in the general condition of all
other tagged coral colonies were observed during the monthly operation phase
monitoring period. No deterioration of the coral community was observed in the ecological monitoring results when compared with the baseline
ecological monitoring results. There is no AL/LL exceedance during the
monitoring period.
8.5.
Operation phase fishery monitoring for dry
season 2026 was carried out on 7 and 15 February 2026. The survey findings
showed that the abundance and diversity of fish eggs and larvae are on the low side for the Study Area, and the abundance and diversity
of juveniles are very low for the Study Area. Survey findings
also showed that there was a very week relationship in recorded
families between ichthyoplankton assemblages, adult fish and juvenile
fish in the Study Area, which implies
that the Study Area does not
appear to be an important spawning or nursery grounds for commercial fishes.
8.6.
No Landfill gas monitoring was conducted during the reporting
period.
8.7.
No environmental complaint, notification of
summons and prosecution Statistics on complaint and notification of summons and
prosecution are summarized in Appendix G.
23
The copyright of this document
is owned by Aurecon Hong Kong Limited.
It may not be reproduced except with prior written approval
from the Company.
EM&A Site Inspection
9.1.
According to the approved proposal
to change the operation phase EM&A programme for the 2nd to 10th years, site
inspection will be conducted on a bi-weekly basis starting from 15 August 2025.
9.2.
Site inspections were carried out to monitor
the implementation of proper environmental pollution control and
mitigation measures under the Contract. In the reporting period, site
inspections were carried out on 5 and 24 March 2026 at the site portions listed
in Table 9.1 below.
9.3.
Table 9.1 Summaries of Site Inspection Record
|
Date
|
Inspected Site Portion
|
Time
|
|
8 May 2026
|
TKO Area 137
|
14:00 15:00
|
|
18 May 2026
|
TKO Area 137
|
13:30 14:30
|
9.4.
No Environmental deficiencies were observed during
site inspection. The site inspections during the reporting period
are summarized in Table 9.2.
Table 9.2 Site Observations
|
Date
|
Environmental Observations
|
Follow-up Status
|
|
8 May 2026
|
No major
environmental deficiency
was observed.
|
N/A
|
|
18 May 2026
|
No major
environmental deficiency
was observed.
|
N/A
|
9.5.
According to the EIA Study Report, Environmental Permit, contract documents and EM&A Manual,
the mitigation measures detailed in the documents should be implemented as much
as practical during the reporting period. An updated Implementation Status of
Environmental Mitigation Measures (EMIS) is provided in Appendix B. Site
inspection proforma of the reporting period is provided in Appendix F.
24
The copyright of this document
is owned by Aurecon Hong Kong Limited.
It may not be reproduced except with prior written approval
from the Company.
Future Key Issues
10.1.
Works to be undertaken in the next reporting month
are:
l Potable Water Production
10.2.
The major environmental impacts brought by the above operation works include:
·
Effluent of the water production work and system
cleaning works;
·
Waste generation from the operation activities
10.3.
The key environmental mitigation measures implemented for the Contract
in this reporting period associated with the above operation works
include:
·
Regularly monitoring of the effluent
·
Sorting and storage
of general refuse and operation waste
25
The copyright of this document
is owned by Aurecon Hong Kong Limited.
It may not be reproduced except with prior written approval
from the Company.
Conclusions and Recommendations
11.1. This is the 23rd Monthly EM&A Report
for the Project which summarizes the key findings of the EM&A programme during
the reporting period from 1 May to 31 May 2026, in accordance with the EM&A
Manual and the requirement under FEP-01/503/2015/B.
11.2. The first-year operation phase marine water quality monitoring was
completed on 30 June 2025. No marine water quality monitoring was conducted
during the reporting period.
11.3. Effluent Quality was conducted sampling point in the reporting month. No
exceedance of the results was
obtained during the reporting period.
11.4. Coral monitoring was conducted on 21 May 2026 during the reporting period. No sediment, bleaching or increased mortality
in the general condition of all other
tagged coral colonies
were observed during the monthly operation phase monitoring period. No deterioration of the coral community was observed in the ecological monitoring results when compared with the baseline ecological monitoring results.
There is no AL/LL exceedance during the monitoring period.
11.5. Operation phase fishery monitoring for dry season 2026 was carried
out on 7 and 15 February 2026. The survey findings
showed that the abundance and diversity of fish eggs and larvae are on the low side for
the Study Area, and the abundance and diversity of juveniles are very low for
the Study Area. Survey findings also showed that there was a very week relationship in recorded families
between ichthyoplankton assemblages, adult fish and juvenile
fish in the Study Area,
which implies that the Study Area does not appear to be an important spawning or
nursery grounds for commercial fishes.
11.6.
No Landfill gas monitoring was conducted during the reporting
period.
11.7. Environmental site inspections were conducted during the reporting
period. Observations and reminders were reported during the site inspections.
All items are rectified within the reporting period. The environmental
performance of the project was therefore considered satisfactory.
11.8. No environmental complaints, notification of summons
and prosecution were received in the reporting period.
11.9. The ET will keep track on the operation works to confirm compliance
of environmental requirements and the proper implementation of all necessary
mitigation measures.
26
The copyright of this document
is owned by Aurecon Hong Kong Limited.
It may not be reproduced except with prior written approval
from the Company.
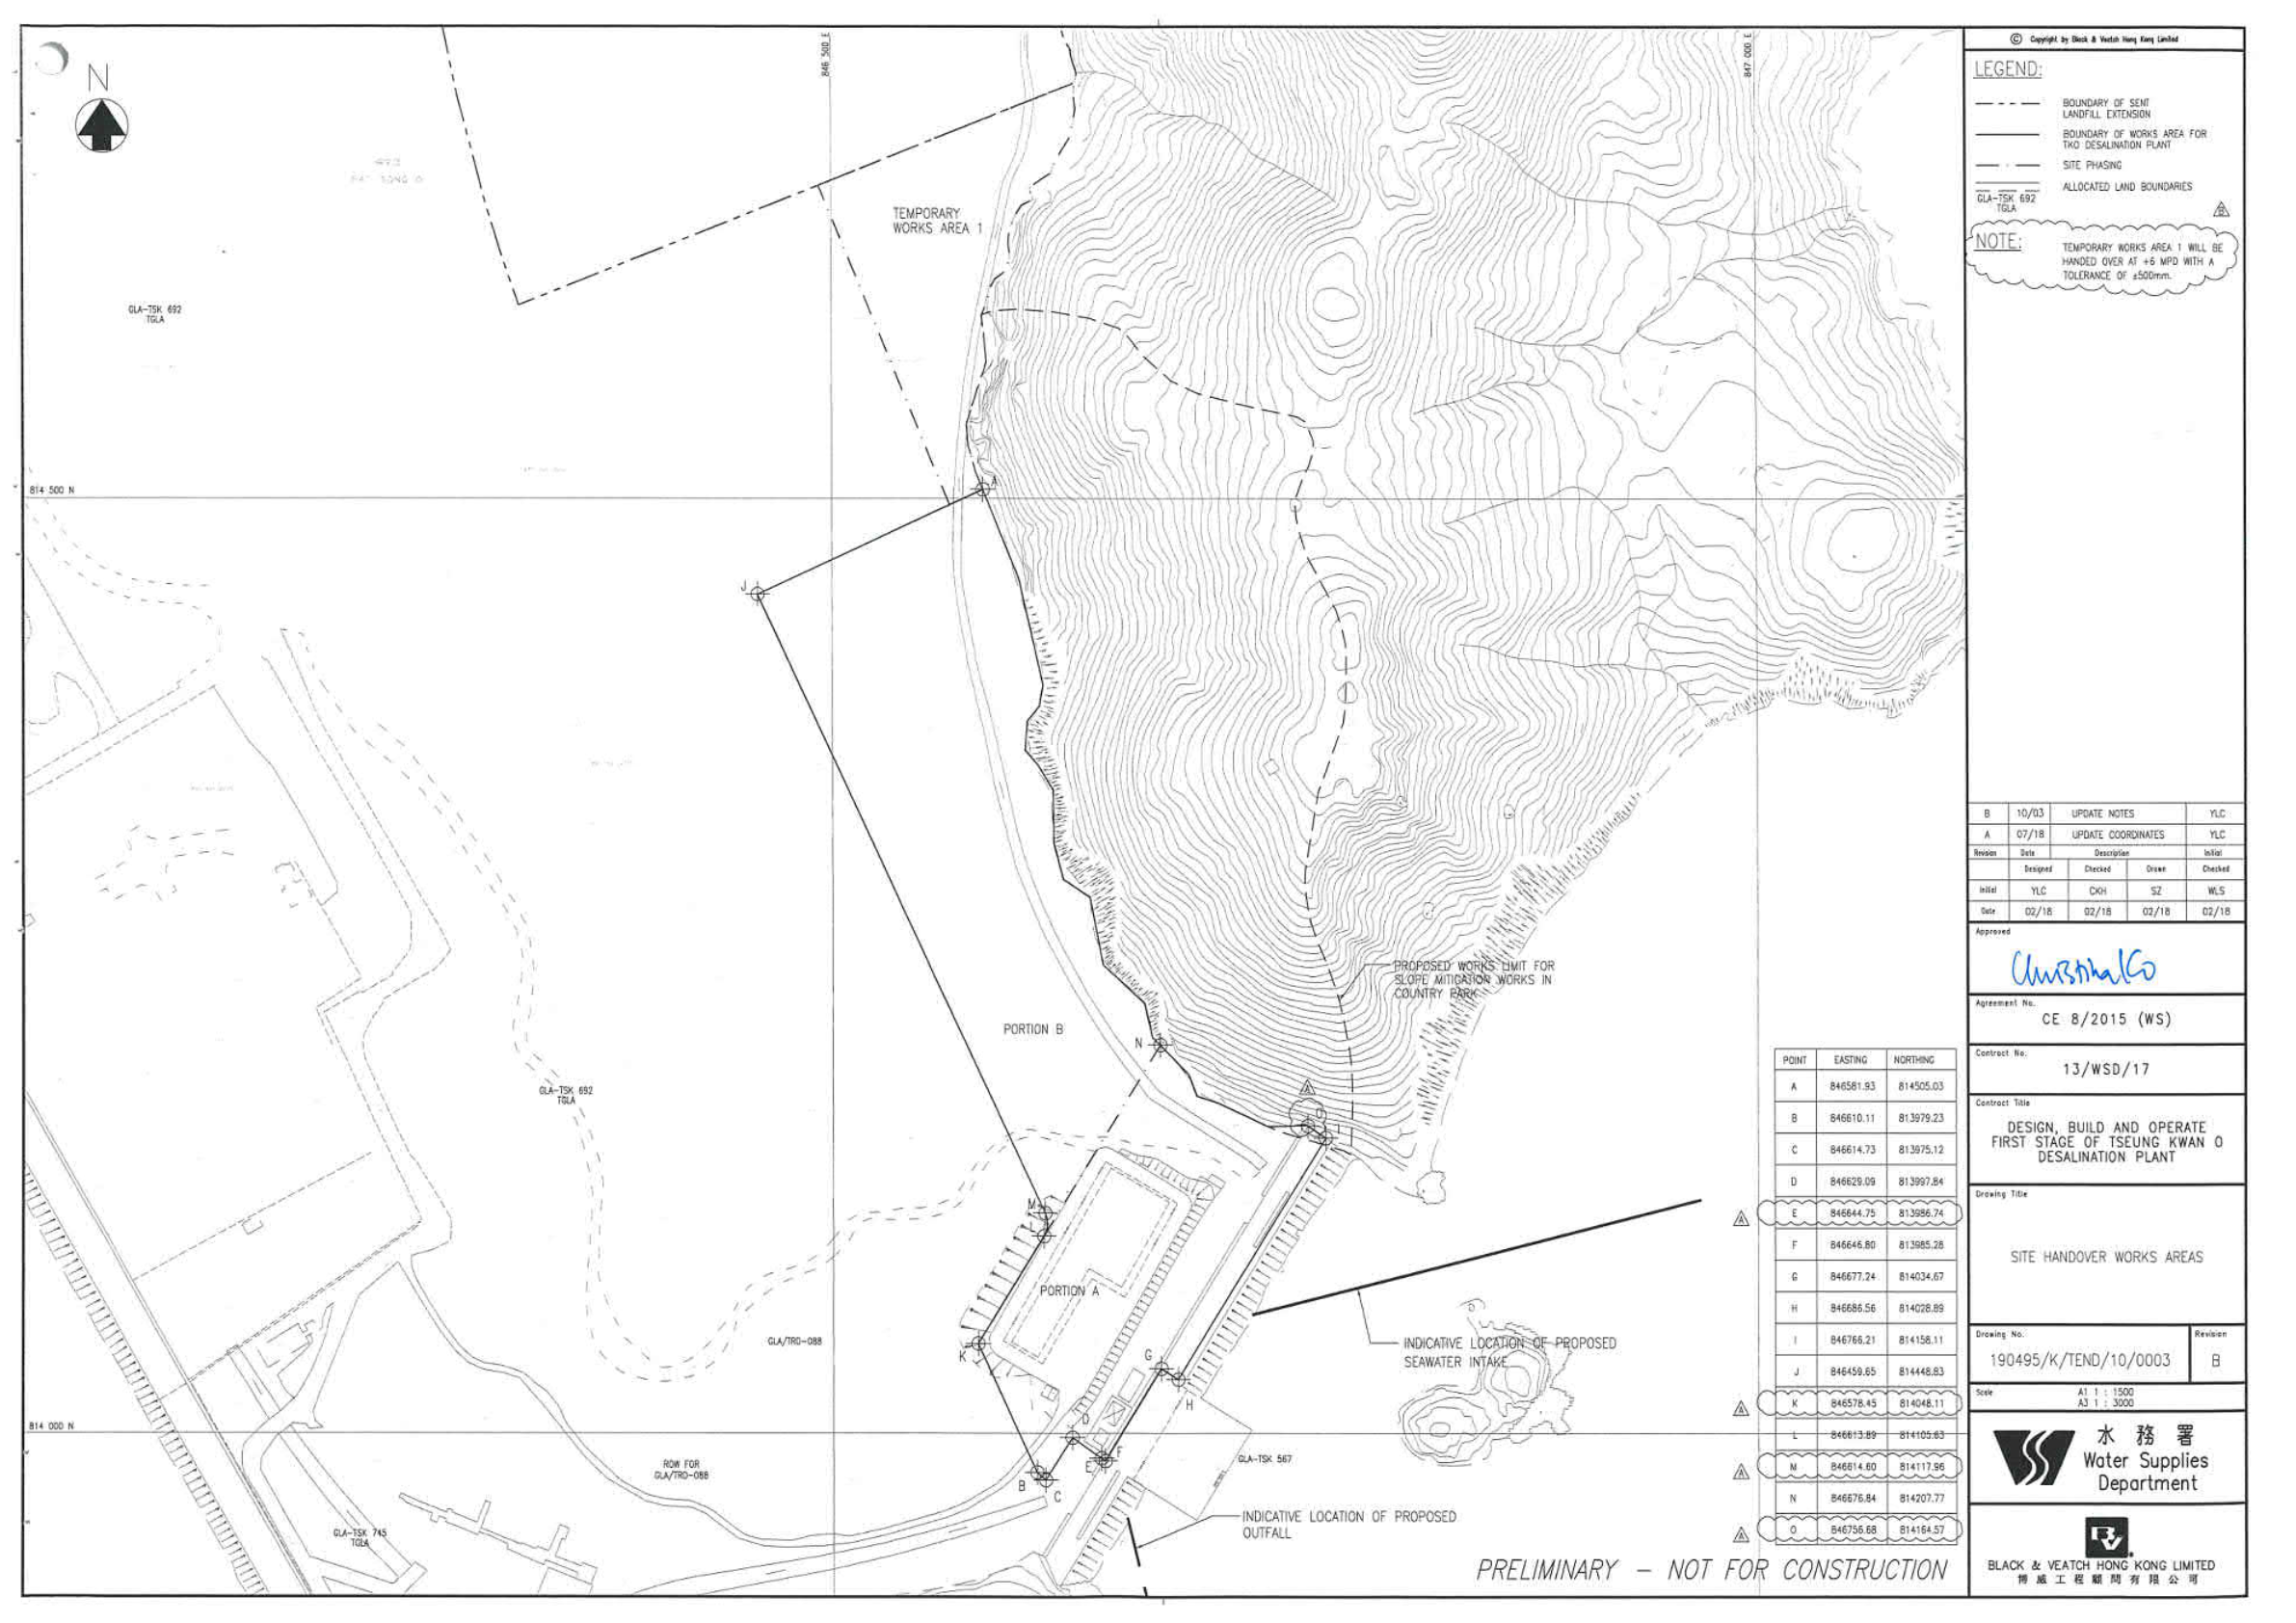
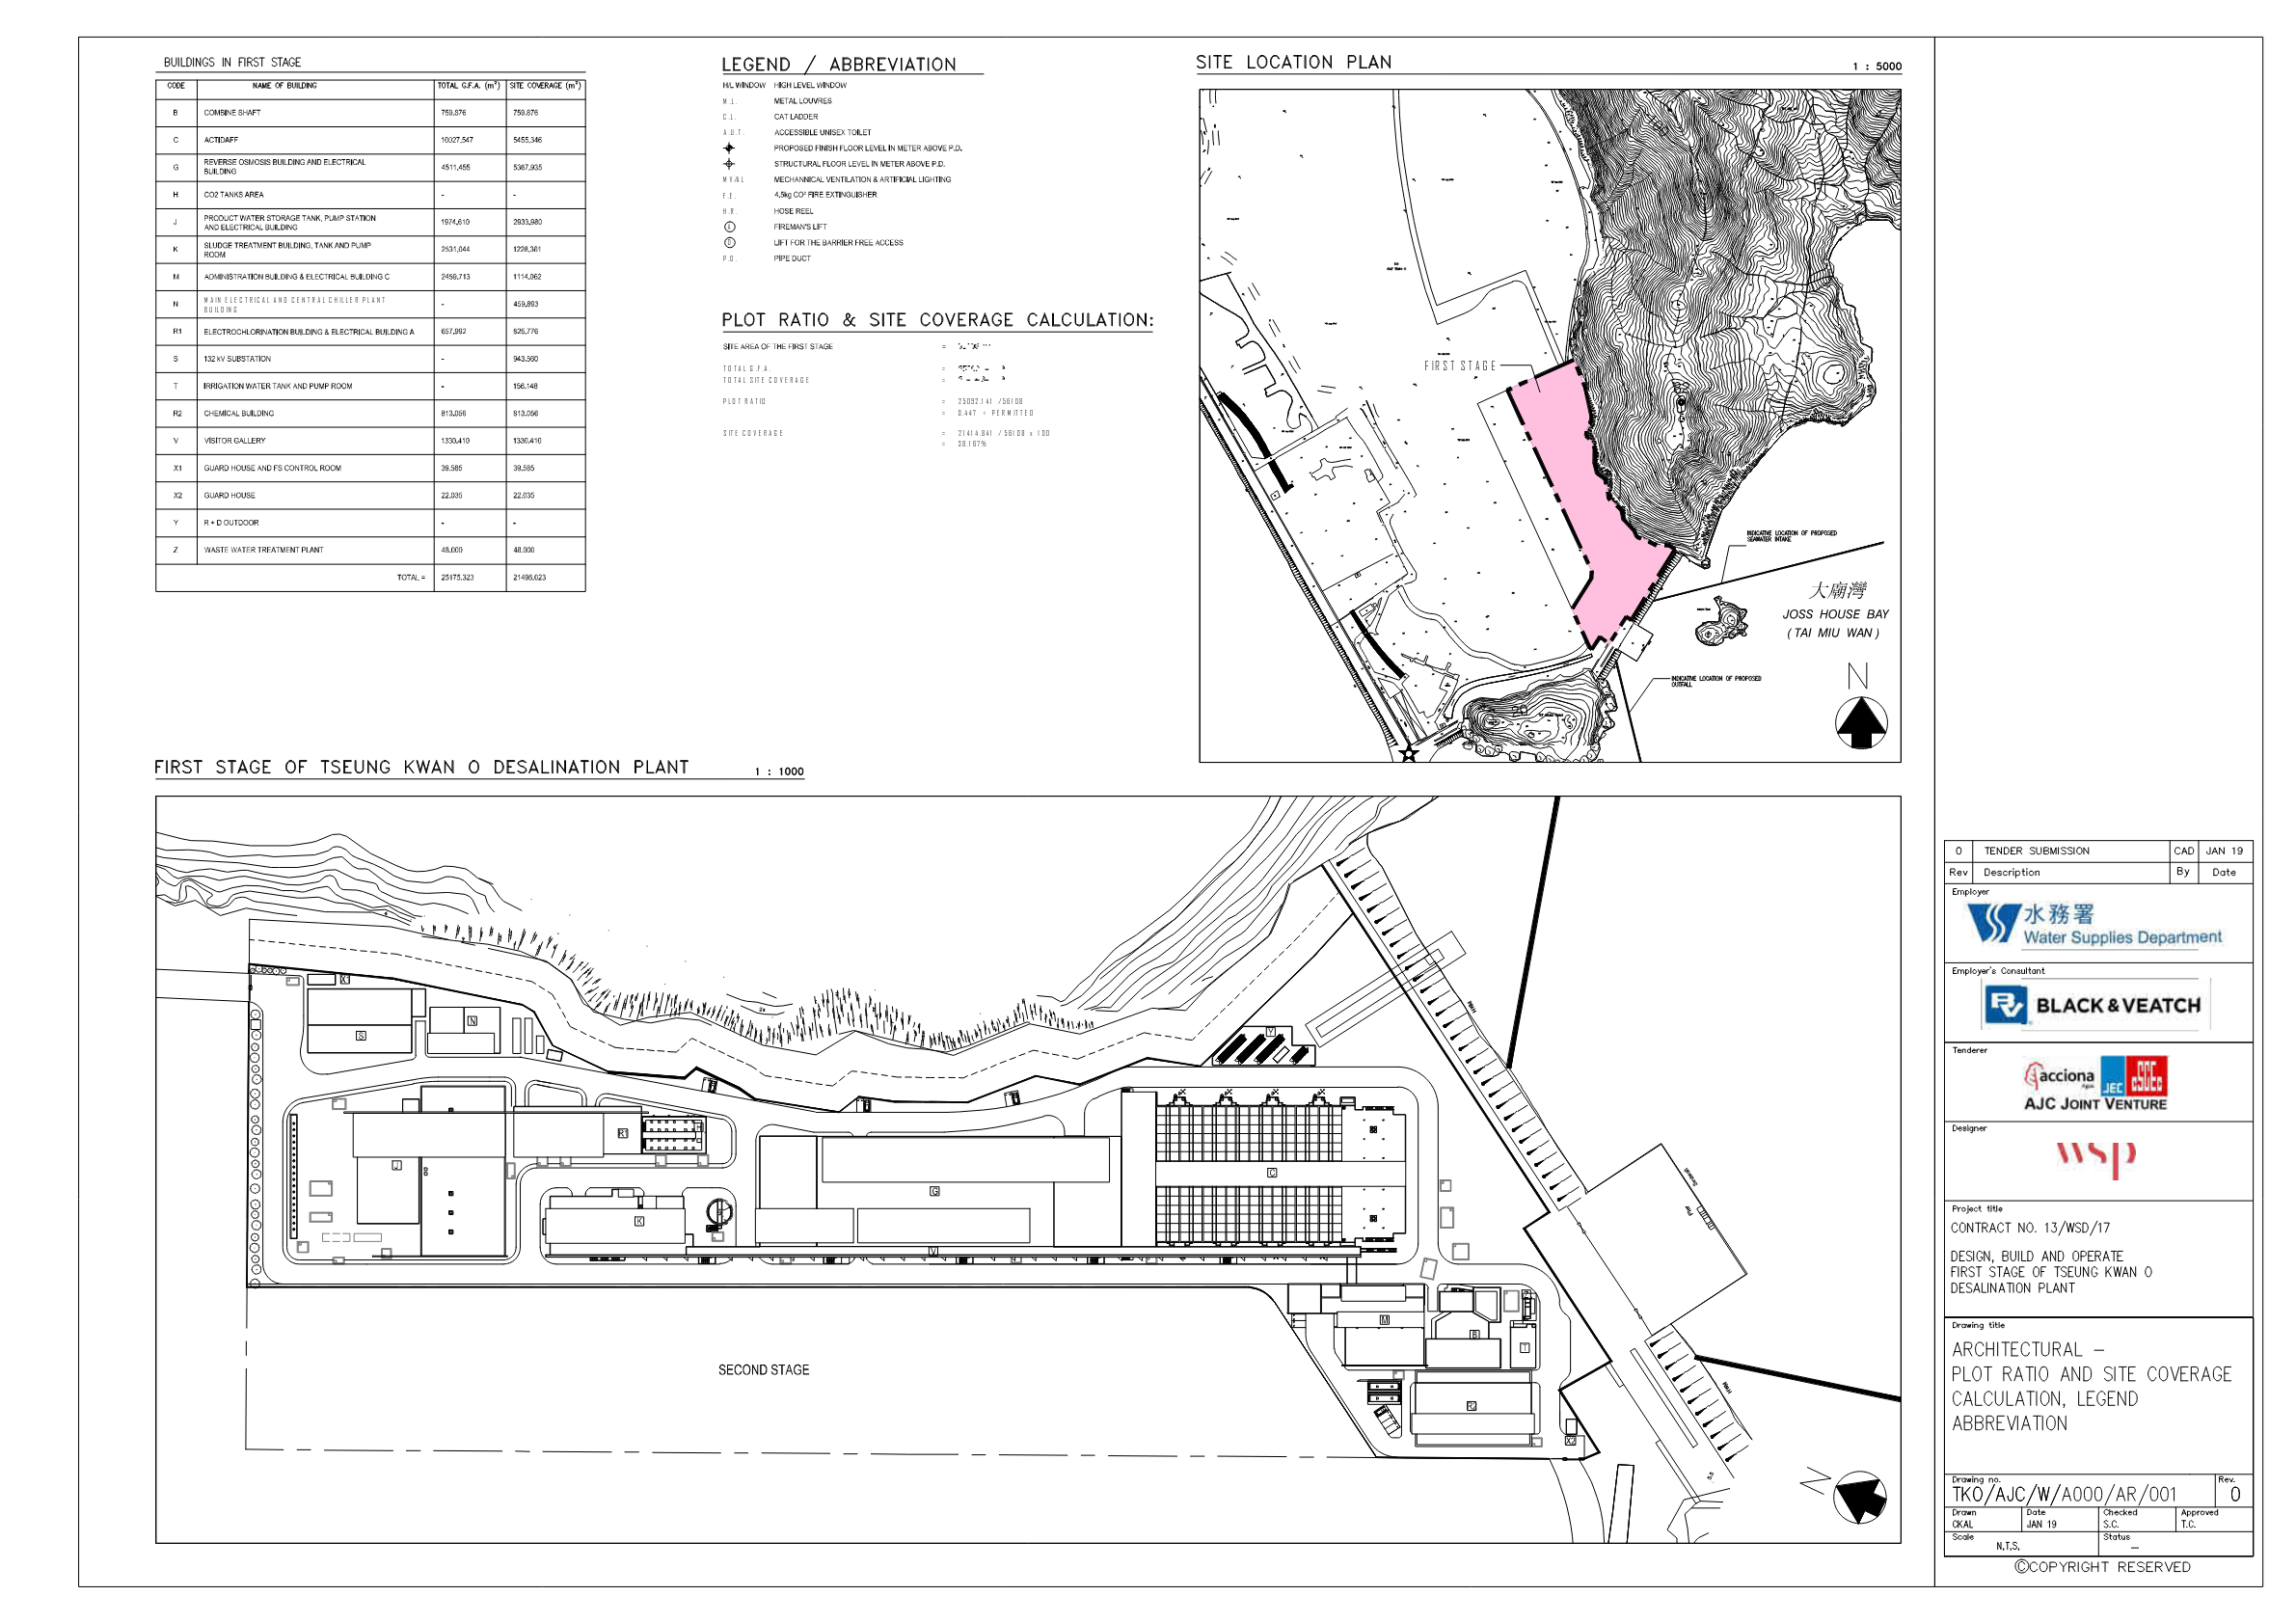
Appendix A
Overview of Desalination Plant in Tseung Kwan O
Appendix B
Summary of Implementation
Status of Environmental Mitigation
The copyright
of this document is owned by Acuity Sustainability Consulting Limited. It may not be reproduced except with prior written approval from the Company.
|
EIA
Reference
|
Recommended Environmental Protection Measures/ Mitigation Measures
|
Objectives of the recommended measures & main concerns to address
|
Implementation
Agent
|
Implementation Stage
|
Implementation status
|
Relevant Legislation & Guidelines
|
|
D
|
C
|
O
|
|
Air Quality
|
|
|
S4.8.1
|
Ultra-low-sulphur diesel
(ULSD) will be used for all construction plant
on-site, as defined as diesel fuel containing not more than 0.005% sulphur by weight) as stipulated
in Environment, Transport and Works
Bureau Technical Circular (ETWB-TC(W)) No 19/2005 on Environmental Management on Construction Sites.
|
Land site/
During construction/ During
Operation
|
Contractor(s)
|
|
ü
|
ü
|
Implemented
|
Environment, Transport and Works Bureau Technical Circular (ETWB-
TC(W)) No
19/2005 on Environmental Management on Construction Sites
|
|
Water Quality
|
|
S6.9 and S6.12
|
The sterilization water should
be dechlorinated with total residual chlorine (TRC) level below 1 mg/L before discharge to public sewer. In situ testing of TRC should
also be conducted for the discharge
of chlorinated water for pipeline disinfection to ensure sufficient dechlorination before
discharge to public sewer.
|
Sterilization of water mains prior to commissioning
|
Contractor(s)
|
|
ü
|
ü
|
Implemented
|
Technical Memorandum for Effluents Discharged into Drainage and Sewerage Systems Inland and Coastal Waters
|
|
S6.9
|
The cleaning and flushing water should also be treated and desilted to the relevant discharge requirement stipulated in TM-DSS before
discharging.
|
Sterilization of water mains prior to commissioning
|
Contractor(s)
|
|
ü
|
ü
|
Implemented
|
|
S6.9
|
Site drainage should be well
maintained, and good construction practices should
be observed to ensure that
oil, fuels, solvents, and other chemicals are managed, stored
and handled properly and do
not enter the nearby
water streams.
|
Land site & drainage/ During construction/ During
operation
|
Contractor(s)
|
|
ü
|
ü
|
Implemented
|
-
|
|
Waste Management
|
|
S8.5
|
Provision of sufficient waste
disposal points and
regular collection for disposal.
|
All area/ During construction/ During operation
|
Contractor(s)
|
|
ü
|
ü
|
Implemented
|
DEVB TC(W) No.
8/2010, Enhanced Specification for Site Cleanliness and
Tidiness.
|
|
S8.5
|
Chemical waste
container shall be suitable for the substance they are holding, resistant to corrosion, maintained in a good
condition, and securely
closed.
|
All area/ During construction/ During operation
|
Contractor(s)/ WSD
|
|
ü
|
ü
|
Implemented
|
Waste Disposal (Chemical Waste)
(General) Regulation; Code of Practice on the Packaging, Handling and Storage
of Chemical Wastes
|
|
S8.5
|
Chemical waste
container shall have a capacity of less than 450 L unless the specifications have been approved by the EPD.
|
All area/ During construction/ During operation
|
Contractor(s)/ WSD
|
|
ü
|
ü
|
Implemented
|
|
S8.5
|
A label in English and
Chinese shall be displayed on the chemical
container in accordance
with instructions prescribed in Schedule 2 of the Regulations.
|
All area/ During construction/ During operation
|
Contractor(s)/ WSD
|
|
ü
|
ü
|
Implemented
|
|
EIA
Reference
|
Recommended Environmental Protection Measures/ Mitigation Measures
|
Objectives of the recommended measures & main concerns to address
|
Implementation
Agent
|
Implementation Stage
|
Implementation status
|
Relevant Legislation & Guidelines
|
|
D
|
C
|
O
|
|
S8.5
|
Storage areas for chemical
waste shall be enclosed
on at least 3 sides.
|
All area/ During construction/ During operation
|
Contractor(s)/ WSD
|
|
ü
|
ü
|
Implemented
|
|
S8.5
|
Storage areas
for chemical waste shall have an impermeable floor and bunding,
of capacity to accommodate 110% of the volume of the largest container or 20% by volume of the chemical waste stored in that area, whichever is the
greatest.
|
All area/ During construction/ During operation
|
Contractor(s)/ WSD
|
|
ü
|
ü
|
Implemented
|
|
S8.5
|
Storage areas
for chemical waste
shall have adequate ventilation.
|
All area/ During construction/ During operation
|
Contractor(s)/ WSD
|
|
ü
|
ü
|
Implemented
|
|
S8.5
|
Storage areas
for chemical waste shall be covered to prevent rainfall entering (water collected within the bund must be
tested and disposed of as chemical
waste, if necessary).
|
All area/ During construction/ During operation
|
Contractor(s)/ WSD
|
|
ü
|
ü
|
Implemented
|
|
S8.5
|
Storage areas
for chemical waste
shall be arranged so that incompatible materials are appropriately
separated.
|
All area/ During construction/ During operation
|
Contractor(s)/ WSD
|
|
ü
|
ü
|
Implemented
|
|
S8.5
|
General refuse
will be stored
in enclosed bins
or compaction units
separately from construction and chemical wastes.
|
All area/ During construction/ During operation
|
Contractor(s)/ WSD
|
|
ü
|
ü
|
Implemented after reminder
|
|
S8.5
|
Adequate number
of waste containers will be provided to avoid over-spillage of waste.
|
All area/ During construction/ During operation
|
Contractor(s)/ WSD
|
|
ü
|
ü
|
Implemented
|
DEVB TC(W) No.
8/2010
Enhanced Specification for Site Cleanliness and Tidiness.
|
|
S8.5
|
A reputable waste collector will be employed by the Contractor to remove general
refuse from the site, separately from construction and chemical wastes, on a daily
basis to minimize odour, pest and litter
impacts.
|
All area/ During construction/ During operation
|
Contractor(s)/ WSD
|
|
ü
|
ü
|
Implemented
|
-
|
|
S8.5
|
Recycling bins will be provided at strategic locations within the Site to facilitate recovery of recyclable materials (including aluminum
can, wastepaper, glass bottles and plastic bottles)
from the Site.
Materials recovered will be sold for recycling.
|
All area/ During construction/ During operation
|
Contractor(s)/ WSD
|
|
ü
|
ü
|
Implemented
|
-
|
|
Landscape & Visual
|
|
S11.10 & 11.11
|
The construction area and area allowed for temporary structures, such as the contractors office, will be minimized to a practical minimum. (MM1)
|
All area/
Detailed design/ During
construction/ During
operation
|
WSD/ Contractor(s)
|
ü
|
ü
|
ü
|
Implemented
|
-
|
|
EIA
Reference
|
Recommended Environmental Protection Measures/ Mitigation Measures
|
Objectives of the recommended measures & main concerns to address
|
Implementation
Agent
|
Implementation Stage
|
Implementation status
|
Relevant Legislation & Guidelines
|
|
D
|
C
|
O
|
|
S11.10 & 11.11
|
At the detailed design
stage, the design
team will seek to minimize the landscape footprint of the Project and above ground
facilities, while satisfying
all other requirements. (MM2)
|
All area/ Detailed design/
During construction/ During operation
|
WSD/ Contractor(s)
|
ü
|
ü
|
ü
|
Implemented
|
-
|
|
S11.10 & 11.11
|
Design principles will be
adopted to take into account the surrounding area, particularly Clear
Water Bay Country Park behind and the nearby waterfront, with due consideration given to:
-
green roofs where practical (i.e. without equipment on the roof);
-
roadside
planting;
-
aesthetic treatment of all structures;
-
vertical greening;
-
screen planting along application site; and
-
landscape enhancement with amenity planting where practical including planting along the edge (site
boundary) fence with
native shrubs
where feasible, to reduce their visual impact
and blend them into the surrounding landscape. (MM3)
|
All
area/ Detailed design/ During
construction/ During operation
|
WSD/ Contractor(s)
|
ü
|
ü
|
ü
|
Implemented
|
-
|
|
S11.10 & 11.11
|
All trees within the Project
Site or the potential slope mitigation works area will be carefully protected during construction according to DEVB TCW No. 10/2013
Tree Preservation (MM4)
|
All
area/ Detailed design/ During
construction/ During
operation
|
WSD/ Contractor(s)
|
ü
|
ü
|
ü
|
Implemented
|
ETWB TCW
No. 3/2006
- Tree
Preservation.
|
|
S11.10 & 11.11
|
No tree within the Country
Park will be felled. Trees within
the Site unavoidably affected by the works
will be transplanted where necessary and
practical. For trees that need to
be felled, compensatory planting
will be provided to the
satisfaction of relevant Government departments.
A compensatory tree planting proposal including locations of tree compensation will be submitted to seek relevant government departments approval, in accordance with DEVB TC(W)
No.
10/2013. (MM5)
|
All area/
Detailed design/ During
construction/ During operation
|
WSD/ Contractor(s)
|
ü
|
ü
|
ü
|
Implemented
|
DEVB TC(W)
No. 10/2013
|
|
S11.10 & 11.11
|
Any slope mitigation
works necessary to address natural
terrain hazards, will be
minimized to minimize any potential environmental impact to the Country Park e.g. soil nailing and rock stabilization will aim to avoid existing trees e.g. should any restoration of vegetation be necessary, the best planting matrix with native species
will be established, with the aim of resembling
the existing vegetation. (MM6)
|
All area/
Detailed design/ During
construction/ During operation
|
WSD/ Contractor(s)
|
ü
|
ü
|
ü
|
Implemented
|
|
|
S11.10 & 11.11
|
Dredging works
for the installation of intake structures and outfall diffusers should be minimized to avoid
or reduce any potential environmental impacts to as low as reasonably practicable (ALARP). The intake and outfall structures (e.g. intake openings and diffuser heads) will be prefabricated and transferred to site for
|
All area/
Detailed design/ During
construction/ During operation
|
WSD/ Contractor(s)
|
ü
|
ü
|
ü
|
Implemented
|
|
|
EIA
Reference
|
Recommended Environmental Protection Measures/ Mitigation Measures
|
Objectives of the recommended measures & main concerns to address
|
Implementation
Agent
|
Implementation Stage
|
Implementation status
|
Relevant Legislation & Guidelines
|
|
D
|
C
|
O
|
|
|
installation. (MM7)
|
|
|
|
|
|
|
|
|
S11.10 & 11.11
|
All night-time lighting will
be reduced to a practical minimum both in terms of number of level and
will be hooded and directional. (MM8) units and lux level and will be hooded
and
directional. (MM8)
|
All
area/ Detailed design/ During
construction/ During operation
|
WSD/ Contractor(s)
|
ü
|
ü
|
ü
|
Implemented
|
-
|
|
Landfill Gas Hazard
|
|
S12.7
|
During all
works, safety procedures should be implemented to minimize the risks
of fires and explosions, asphyxiation of workers and toxicity effects
resulting from contact
with contaminated soil
and groundwater.
|
All area/ Detailed design/
During construction/operation
|
Contractor(s)
|
ü
|
ü
|
ü
|
Implemented
|
-
|
|
S12.7
|
During trenching and
excavation as well as creation of confined
spaces at near to or below ground level, precautions should be clearly laid down and rigidly Gas
detection equipment and appropriate breathing apparatus should be available and used
when entering confined spaces
or trenches deeper
than 1 meter.
|
All area/ Detailed design/
During construction/operation
|
Contractor(s)
|
ü
|
ü
|
ü
|
Implemented
|
|
|
S12.7
|
The Contractor should make
the workers are aware of potential hazards
of working in confined spaces (any chamber, manhole or culvert which is large enough
to permit access
to personnel). Such work in confined spaces is controlled by
the Factories and Industrial
Undertakings (Confined Spaces) Regulations of the Factories and Industrial Undertakings Ordinance.
Following the Safety Guide
to Working in Confined Spaces
ensures compliance with the
above regulations.
|
All area/ Detailed design/
During construction/operation
|
Contractor(s)
|
ü
|
ü
|
ü
|
Implemented
|
|
|
S12.7
|
Safety officers,
specifically trained with regard to landfill gas and leachate related hazards and the appropriate actions to take
in adverse circumstances, should be
present on the site throughout the works,
in particular, when works are undertaken below
grade.
|
All area/ Detailed design/
During construction/operation
|
Contractor(s)
|
ü
|
ü
|
ü
|
Implemented
|
|
|
S12.7
|
All personnel who work
on site and all visitors to the site should be made aware
of the possibility of ignition of gas in the vicinity of the works, the possible presence of
contaminated water and the need to
avoid physical contact with it.
|
All area/ Detailed design/
During construction/operation
|
Contractor(s)
|
ü
|
ü
|
ü
|
Implemented
|
|
|
S12.7
|
Monitoring for
landfill gas should
be undertaken in all excavations, manholes, chambers (particularly during pipe jacking) and any confined spaces through the use of an intrinsically safe portable
instrument, appropriately calibrated and capable of measuring the concentrations
of methane. carbon dioxide and oxygen.
|
All area/ Detailed design/
During construction/operation
|
Contractor(s)
|
ü
|
ü
|
ü
|
Implemented
|
|
|
S12.7
|
Monitoring frequency and
areas to be monitored should be specified
prior to commencement of groundwork, either by the Safety Officer, or by an appropriately qualified person. All measurements
should be recorded and documented.
|
All area/ Detailed design/
During construction/operation
|
Contractor(s)
|
ü
|
ü
|
ü
|
Implemented
|
|
|
EIA
Reference
|
Recommended Environmental Protection Measures/ Mitigation Measures
|
Objectives of the recommended measures & main concerns to address
|
Implementation
Agent
|
Implementation Stage
|
Implementation status
|
Relevant Legislation & Guidelines
|
|
D
|
C
|
O
|
|
S12.7
|
Proceed drilling with adequate care and precautions against the potential
hazards which may be encountered.
|
All area/
Detailed design/
During construction/operation
|
Contractor(s)
|
ü
|
ü
|
ü
|
Implemented
|
|
|
S12.7
|
Prior to the commencement of
the site works, the drilling contractor
should devise a 'method-of- working' statement covering all normal and emergency procedures (including but
not limited to number of
operatives, experience and special skills of
operatives, normal method of operations, emergency procedures, supervisors responsibilities,
storage and use of safety equipment, safety procedures and signs, barriers and guarding). The site
supervisor and all operatives must be familiar with this statement.
|
All area/ During construction/operation
|
Contractor(s)
|
ü
|
ü
|
ü
|
Implemented
|
|
|
S12.7
|
Where below ground service entries are necessary to the Incoming Switchgear Room, 132 kV Substation and Chlorine Store (I) and (II), the entry point should be sealed
to prevent gas entry. In addition, any below grade
cable trenches entering the Incoming
Switchgear Room and 132 kV Substation can become the
pathway for landfill gas and
hence grilled metal covers should be used.
|
All area/ Detailed design/
During construction/operation
|
Contractor(s)
|
ü
|
ü
|
ü
|
Implemented
|
|
|
S12.7
|
It is
recommended regular landfill gas monitoring should be carried out at the Incoming Switchgear Room, 132 kV Substation and Chlorine Store (I) and (II). The
monitoring frequency will be monthly for the first
year of operation. If the monitoring results
show no sign of landfill gas
migration, reduce the monitoring frequency
to once every six months.
|
All area/ Detailed design/
During construction/operation
|
Contractor(s)
|
ü
|
ü
|
ü
|
Implemented
|
|
|
S12.7
|
The manholes and utility pits within the Project Site and along the fresh
water mains. Each manhole/ utility pit should be monitored with two measurements (at mid depth and
base). Each measurement should be
monitored for a minimum of 10 minutes. A
steady reading and peak reading should be recorded at each manhole/ utility pit and for each measurement. The need for
venting the manhole/ utility
pit and further monitoring will be reviewed
after the initial monitoring.
|
All area/ Detailed design/
During construction/operation
|
Contractor(s)
|
ü
|
ü
|
ü
|
Implemented
|
|
|
S12.7
|
All construction, operation
and maintenance personnel working on-site
as well as visitors should be made aware of the hazards of landfill gas and its possible presence
on-site. This should be achieved
through a combination of posting warning signs in prominent places and
also by access
to detailed information on
landfill gas hazards and the
designs and procedural means by which
these hazards are being minimized on-site.
|
All area/ Detailed design/
During construction/operation
|
Contractor(s)
|
ü
|
ü
|
ü
|
Implemented
|
|
Note: D Design
stage C Construction O Operation
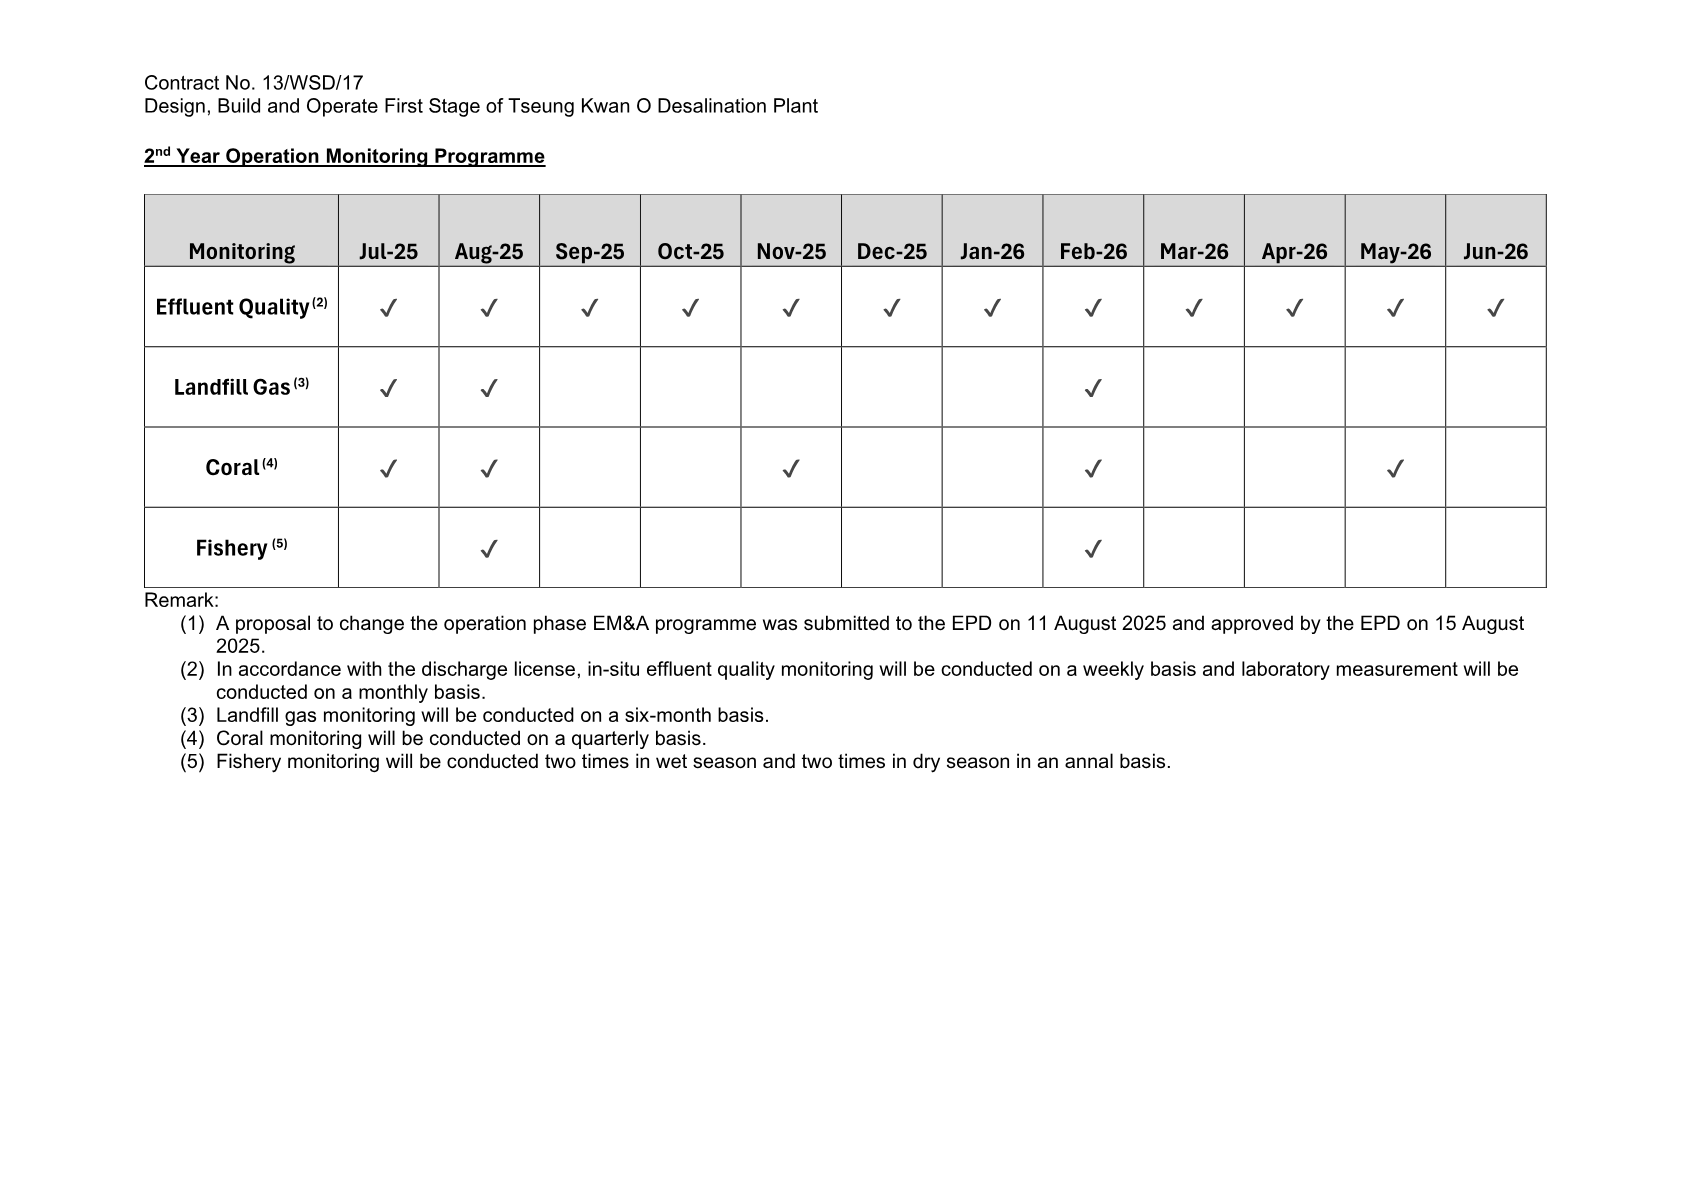
Appendix C
Impact Monitoring Schedule
Appendix D
Event /
Action Plan
Appendix E
Waste Flow Table
Name of Department: WSD Contract
No.: 13/WSD/17
Monthly Summary
Waste Flow Table
for 2026 (year)
|
Month
|
Actual Quantities of Inert C&D
Materials Generated Monthly
|
Actual Quantities of C&D Wastes
Generated Monthly
|
|
Total Quantity Generated
|
Hard Rock
and Large Broken Concrete
|
Reused in the
Contract
|
Reused in other
Projects
|
Disposed as Public Fill
|
Imported Fill
|
Metals
|
Paper/ cardboard packaging
|
Plastics
(see Note
3)
|
Chemical Waste
|
Others, e.g.
general refuse
|
|
(in '000kg)
|
(in '000kg)
|
(in '000kg)
|
(in '000kg)
|
(in '000kg)
|
(in '000kg)
|
(in '000 kg)
|
(in '000kg)
|
(in '000kg)
|
(in '000kg)
|
(in '000kg)
|
|
Jan
|
0.000
|
0.000
|
0.000
|
0.000
|
0.000
|
0.000
|
0.000
|
0.000
|
0.000
|
0.000
|
22.300
|
|
Feb
|
0.000
|
0.000
|
0.000
|
0.000
|
0.000
|
0.000
|
0.000
|
0.000
|
0.000
|
0.000
|
18.070
|
|
Mar
|
0.000
|
0.000
|
0.000
|
0.000
|
0.000
|
0.000
|
0.000
|
0.000
|
0.000
|
0.000
|
66.120
|
|
Apr
|
0.000
|
0.000
|
0.000
|
0.000
|
0.000
|
0.000
|
0.000
|
0.000
|
0.000
|
0.000
|
88.530
|
|
May
|
0.000
|
0.000
|
0.000
|
0.000
|
0.000
|
0.000
|
0.000
|
0.000
|
0.000
|
0.000
|
5.890
|
|
Jun
|
|
|
|
|
|
|
|
|
|
|
|
|
Sub-total
|
0.000
|
0.000
|
0.000
|
0.000
|
0.000
|
0.000
|
0.000
|
0.000
|
0.000
|
0.000
|
200.910
|
|
Jul
|
|
|
|
|
|
|
|
|
|
|
|
|
Aug
|
|
|
|
|
|
|
|
|
|
|
|
|
Sep
|
|
|
|
|
|
|
|
|
|
|
|
|
Oct
|
|
|
|
|
|
|
|
|
|
|
|
|
Nov
|
|
|
|
|
|
|
|
|
|
|
|
|
Dec
|
|
|
|
|
|
|
|
|
|
|
|
|
Total
|
0.000
|
0.000
|
0.000
|
0.000
|
0.000
|
0.000
|
0.000
|
0.000
|
0.000
|
0.000
|
200.910
|
Notes: (1) The performance targets
are given in Section 1.69 of Specification B
(2) The waste flow table shall also include C&D
materials that are specified in the Contract
to be imported for use at the Site.
(3) Plastics refer to plastic
bottles/containers, plastic sheets/
foam from packaging
material
Appendix F
Site Inspection
Proforma
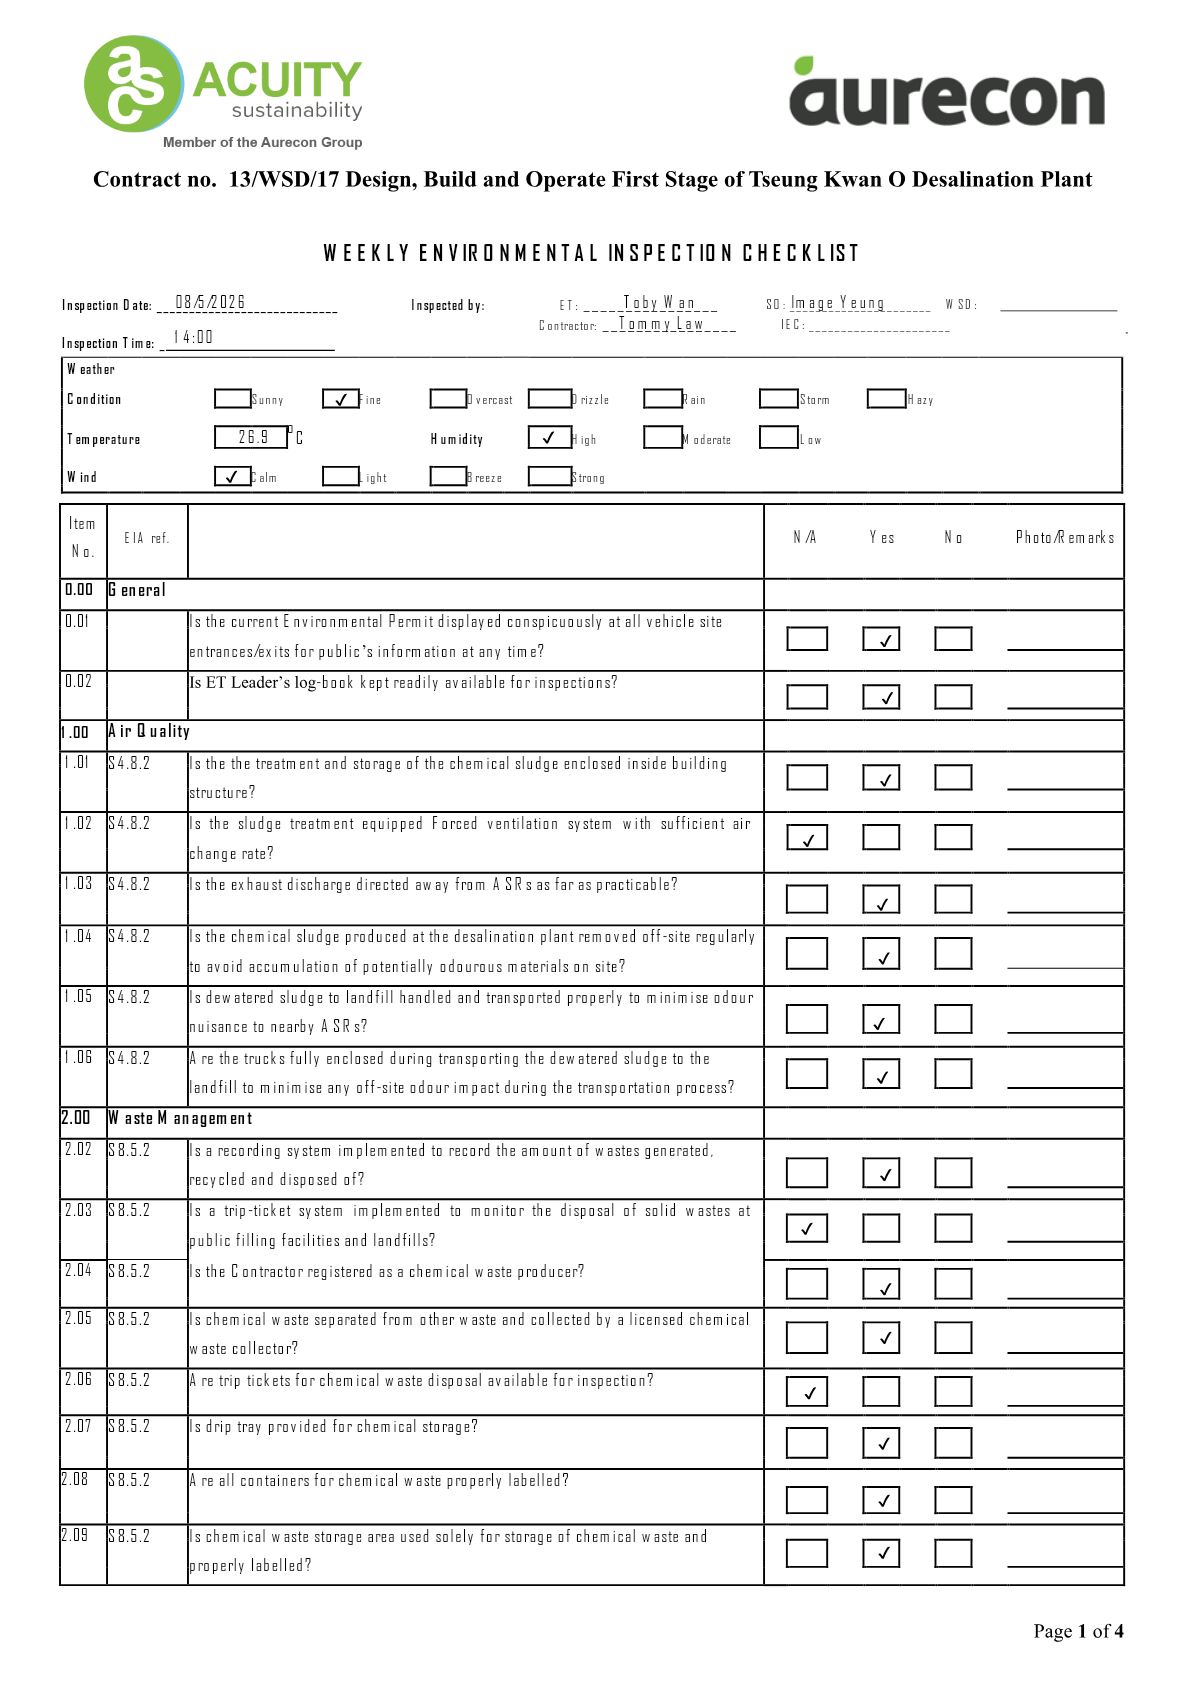
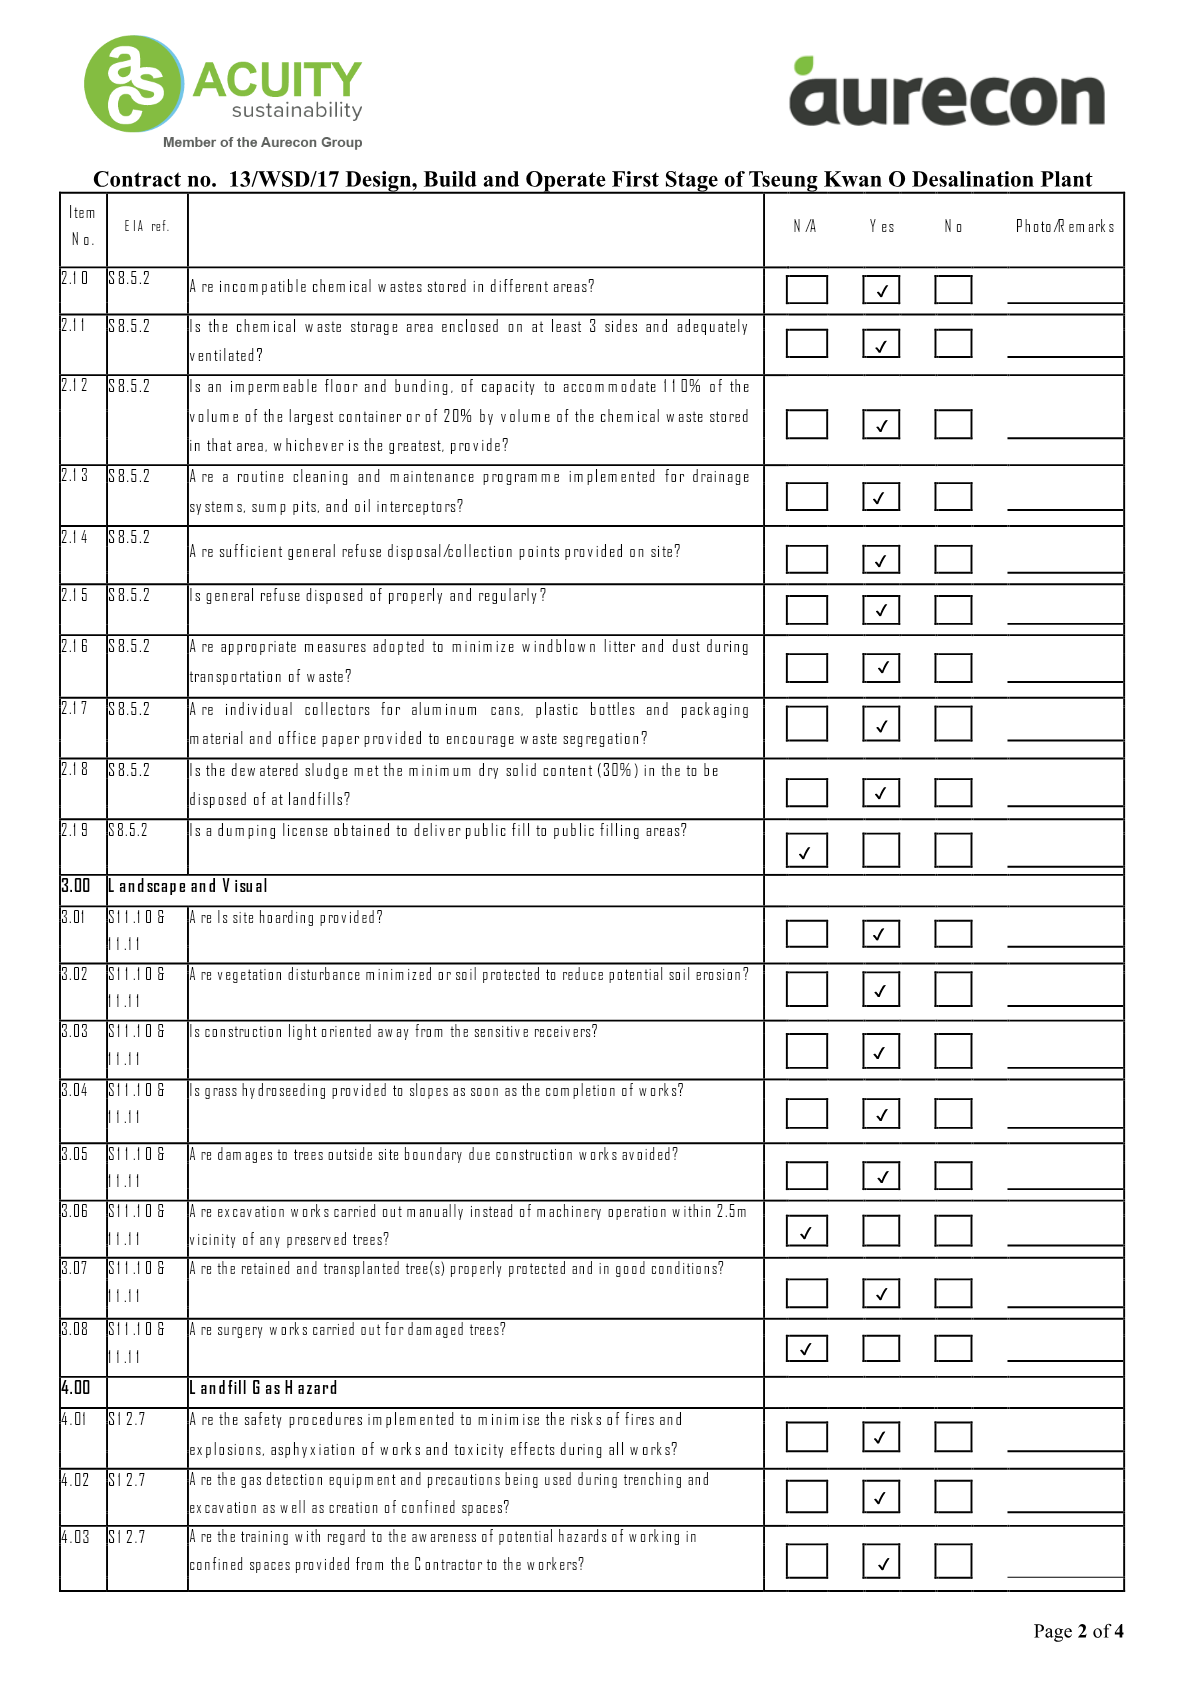
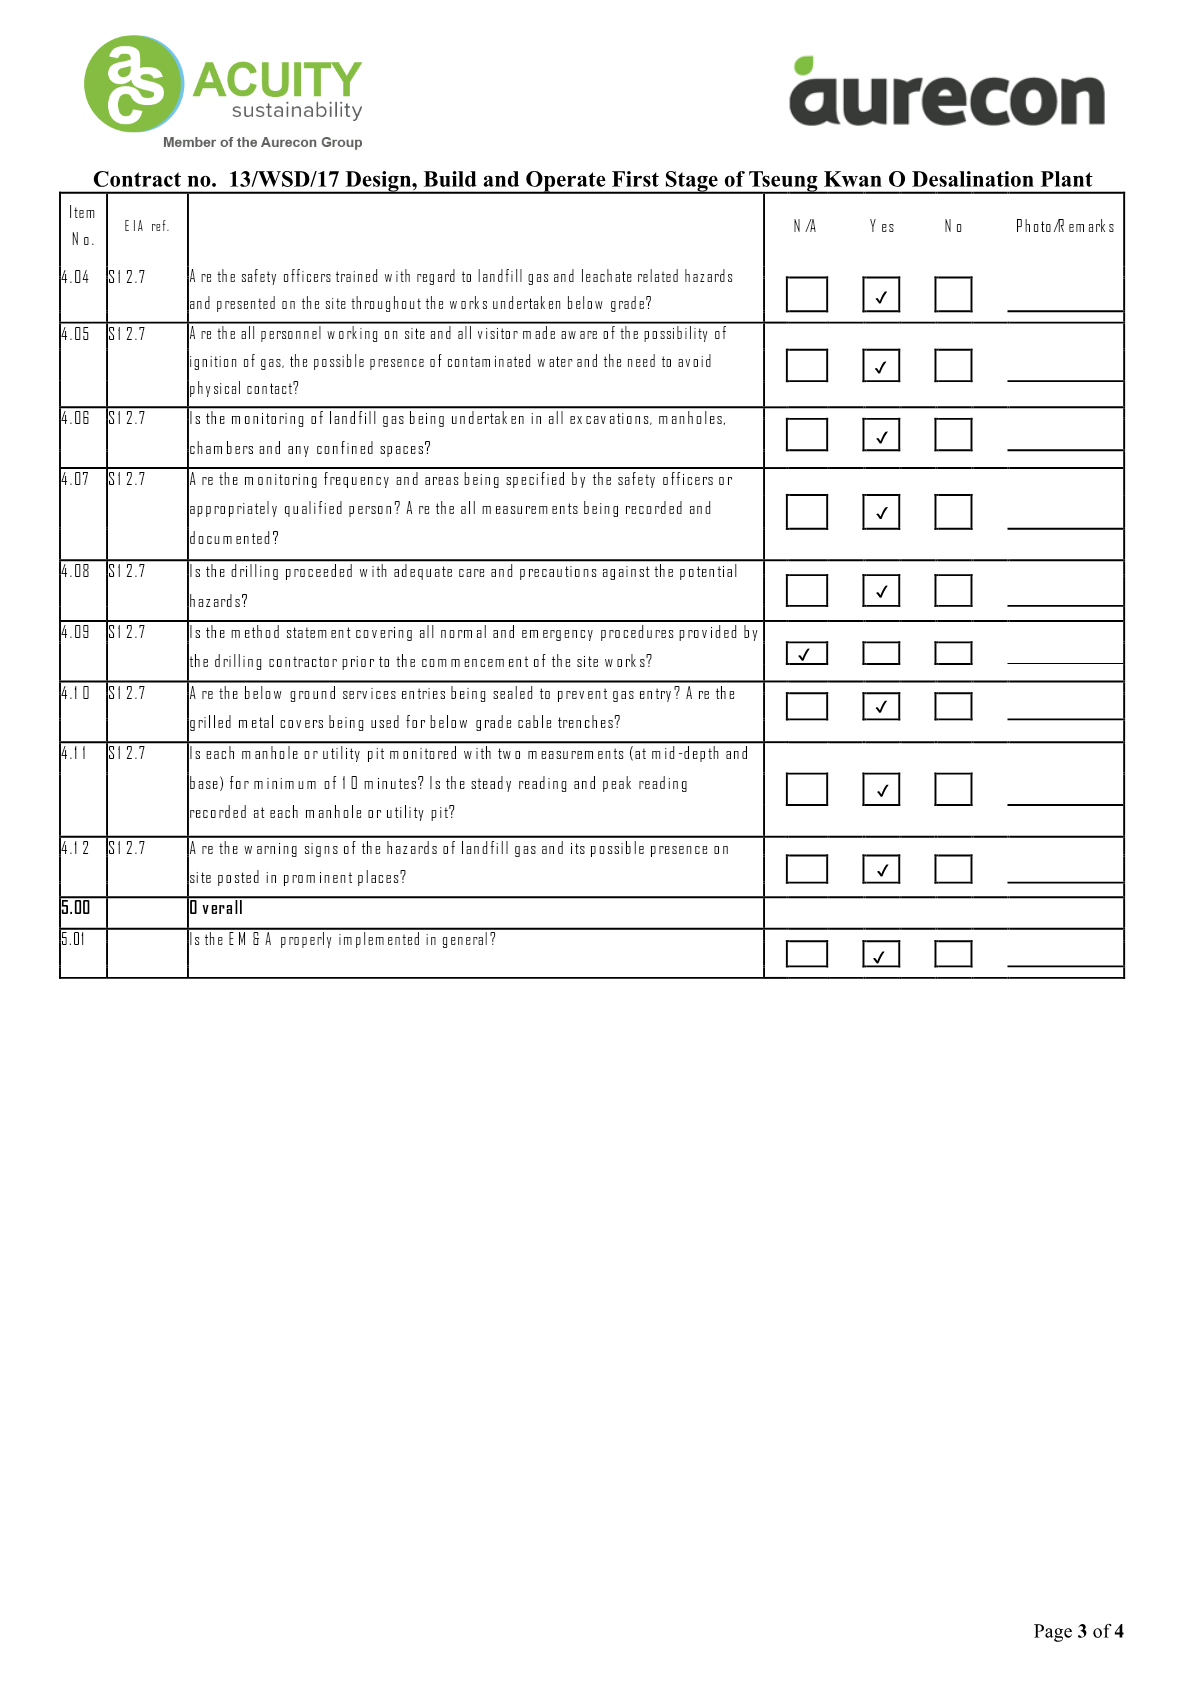
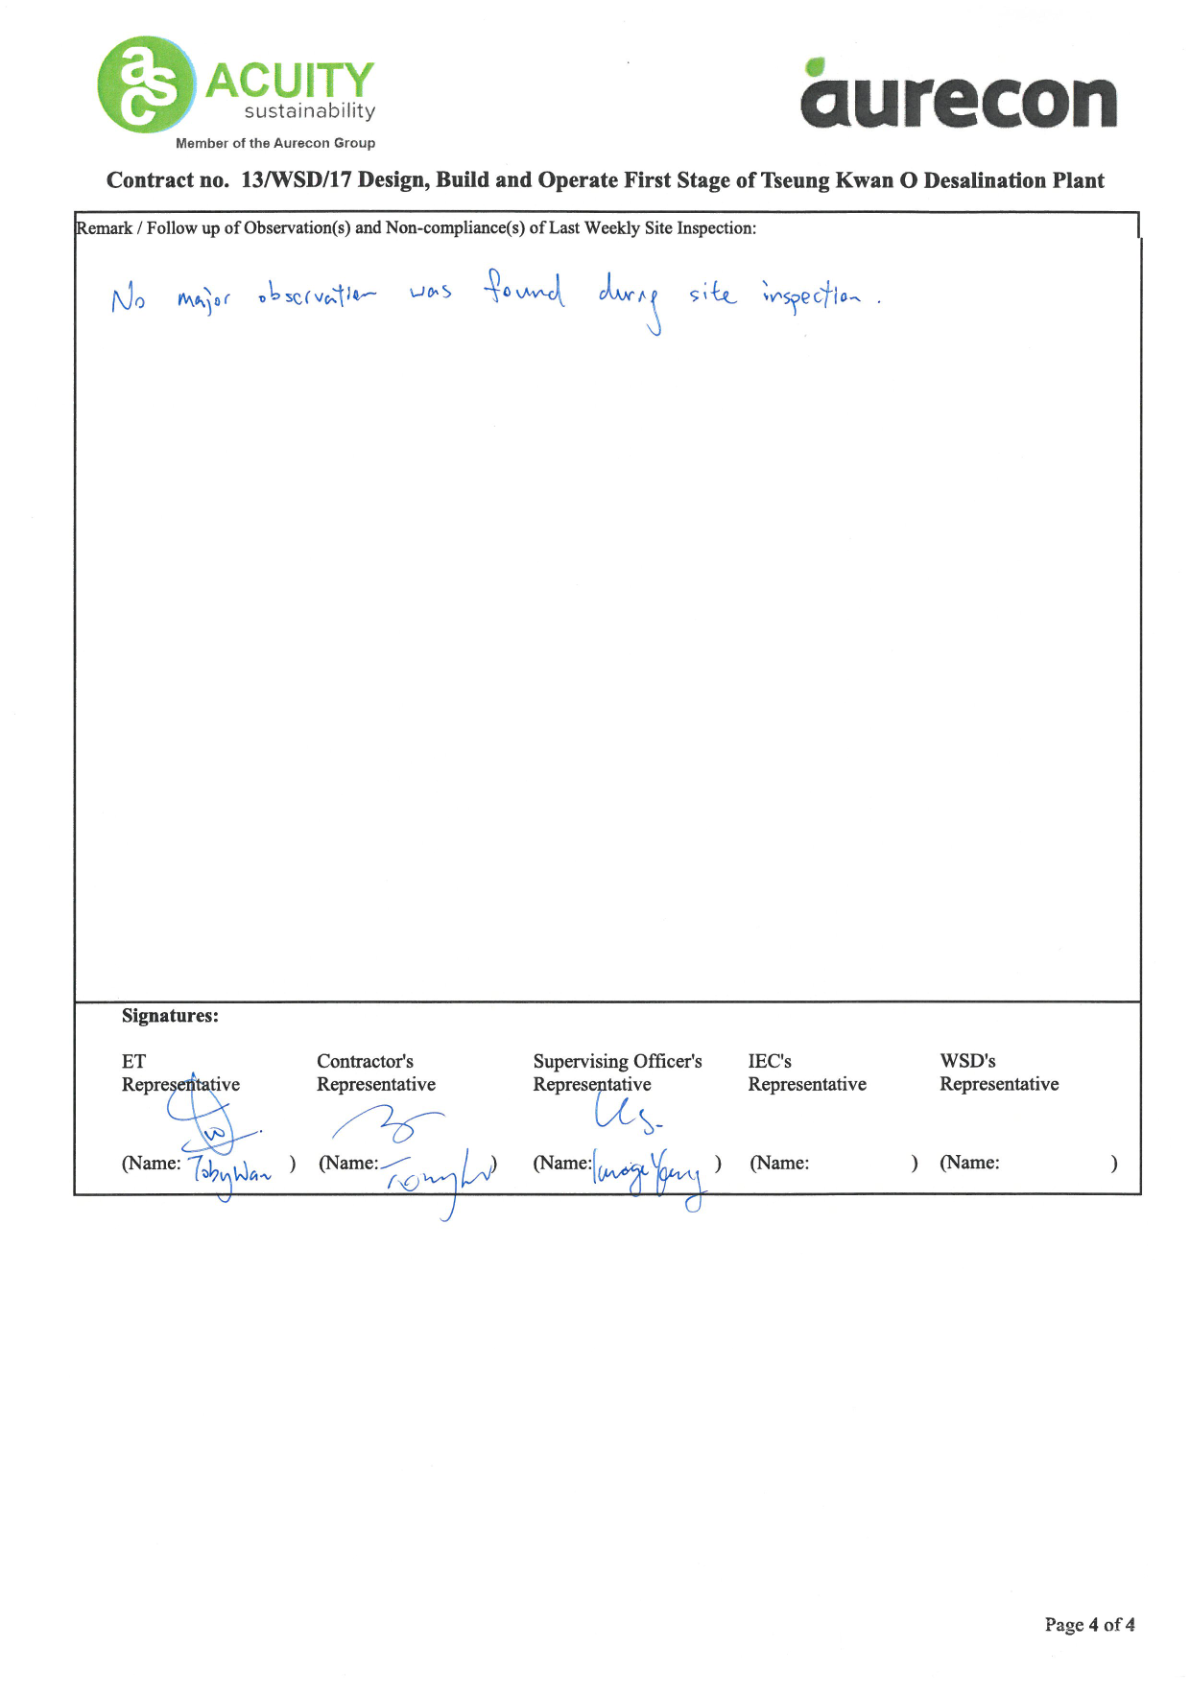
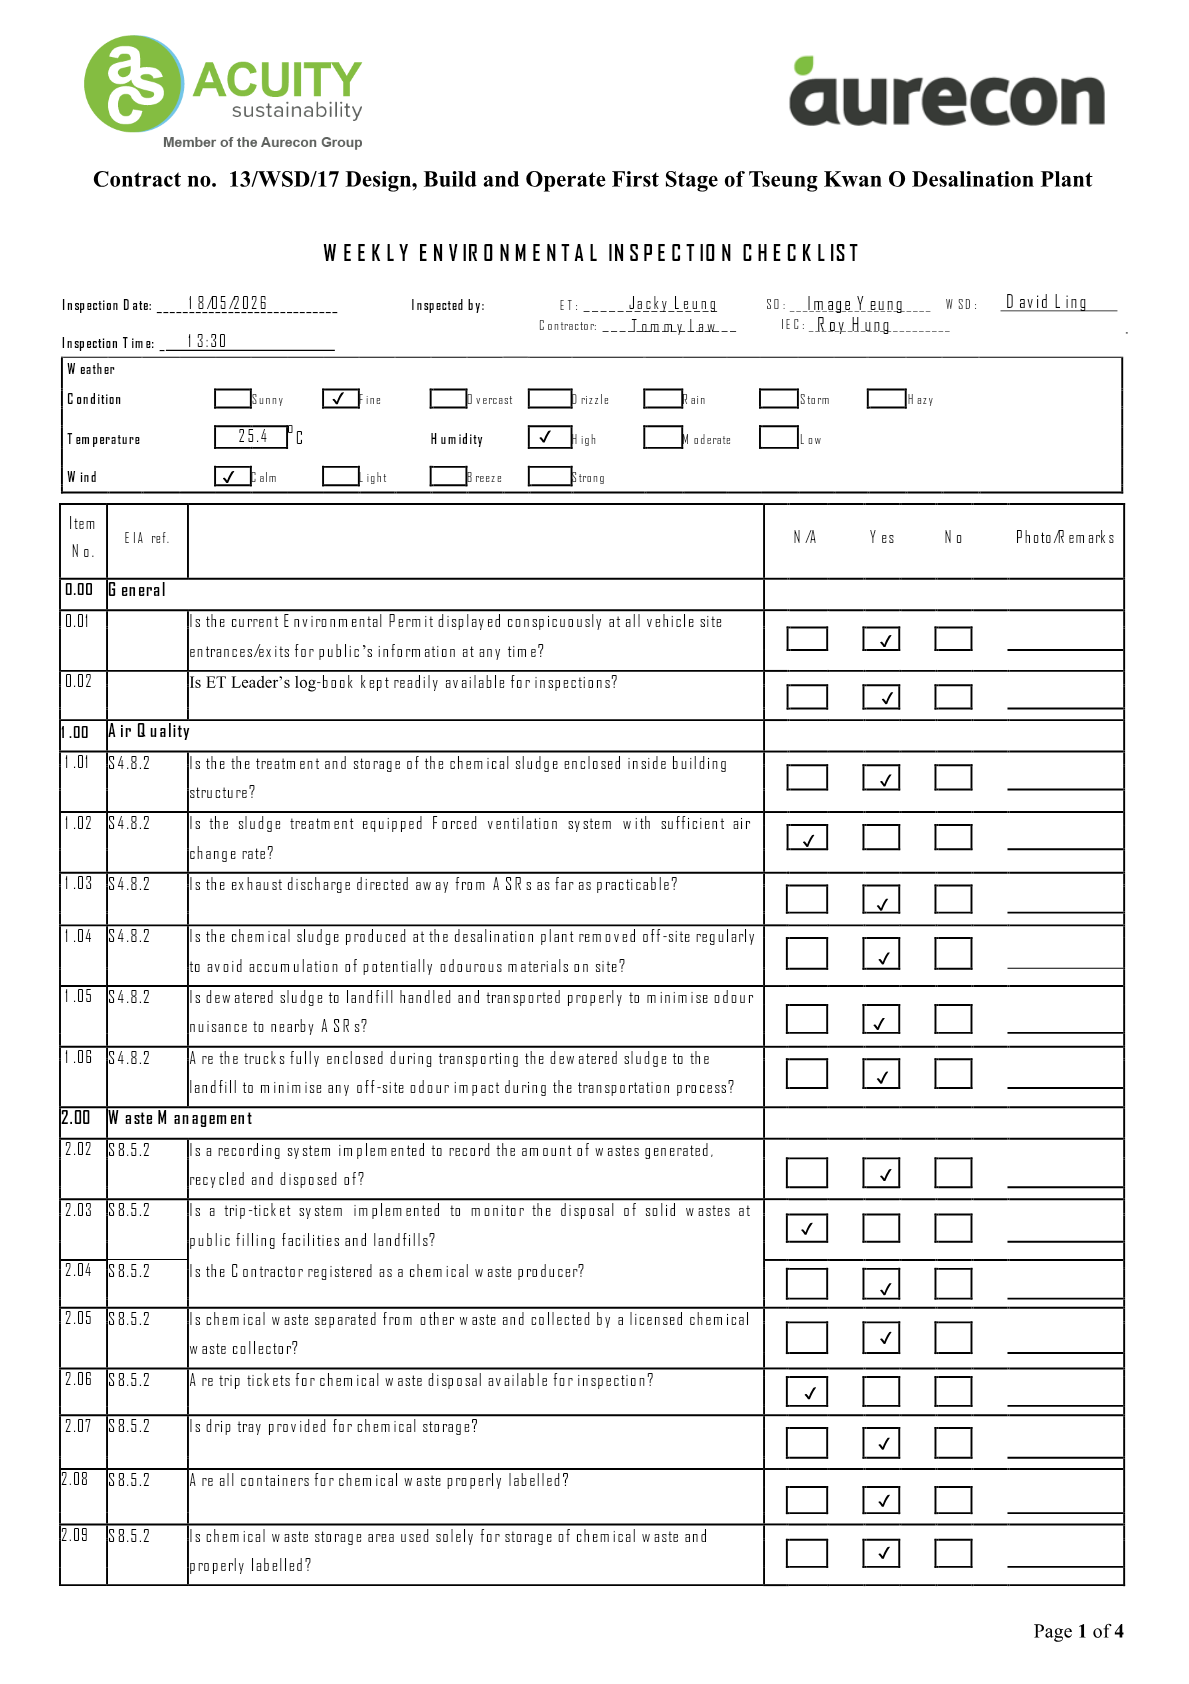
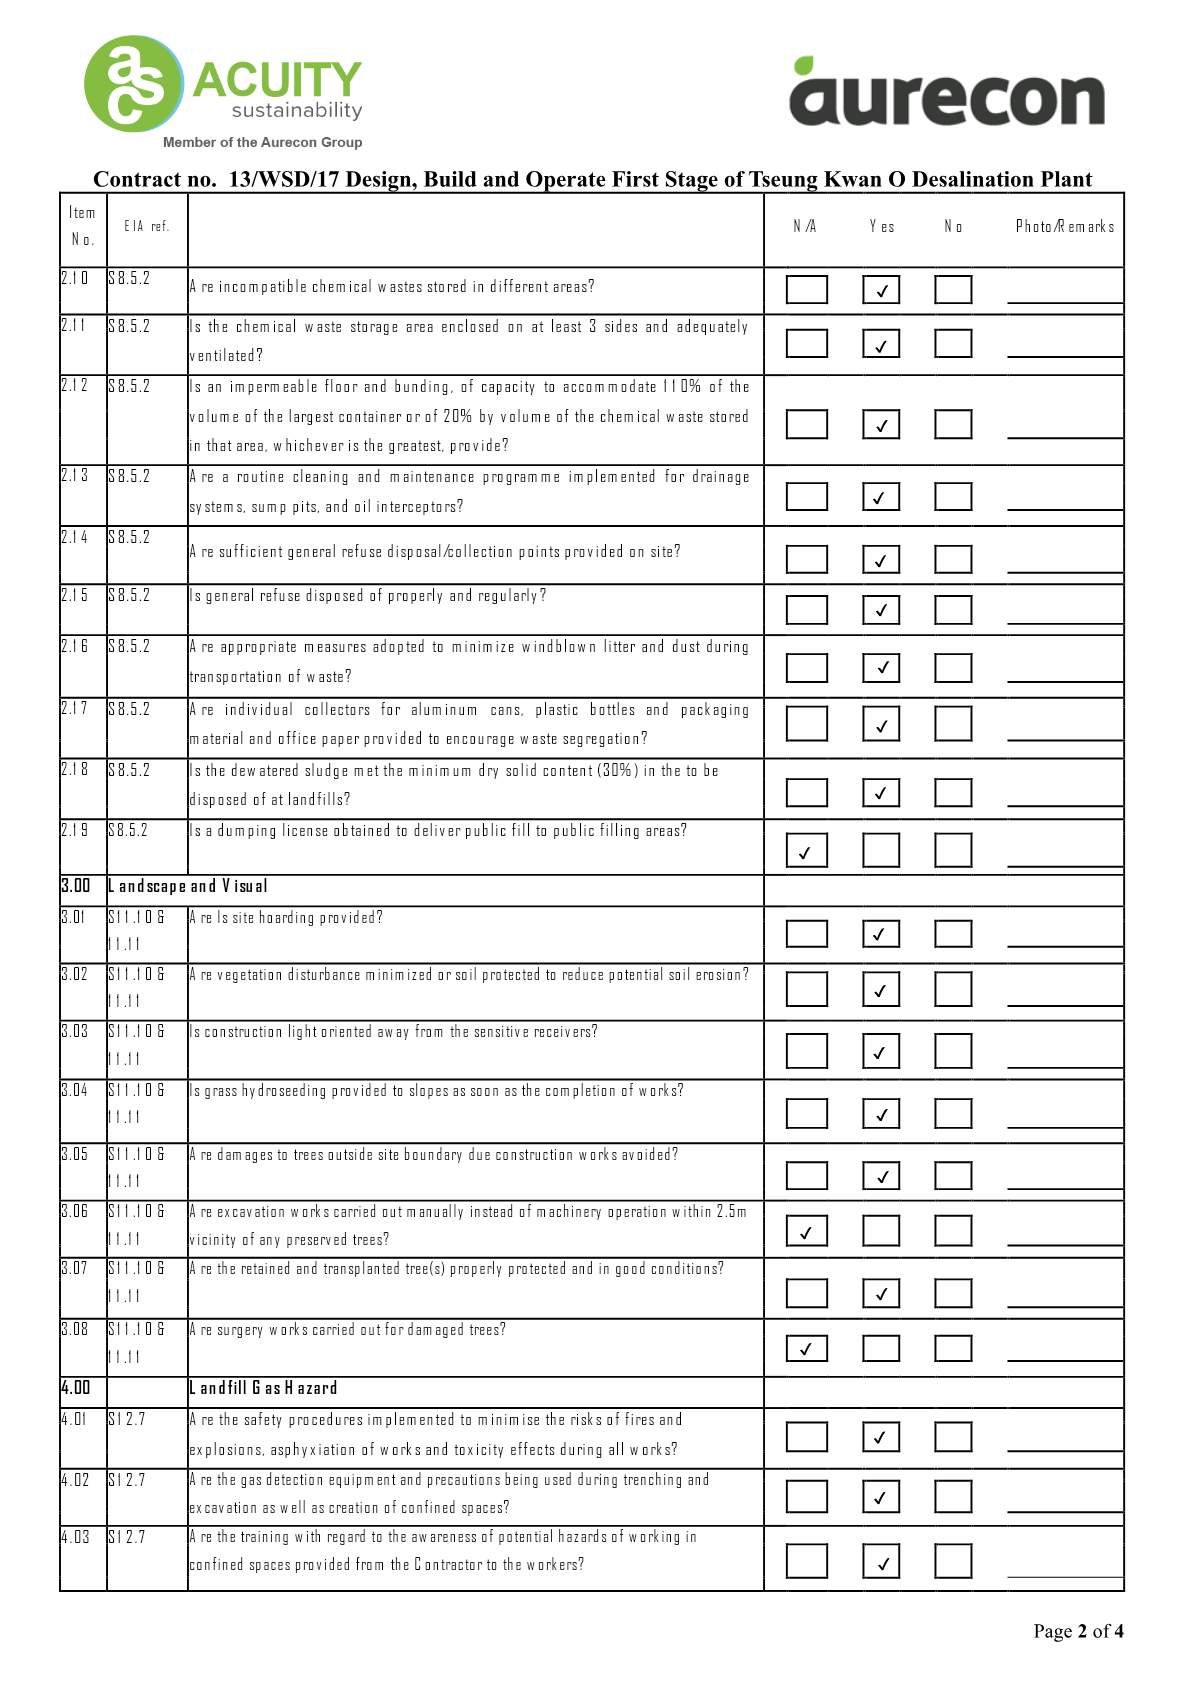
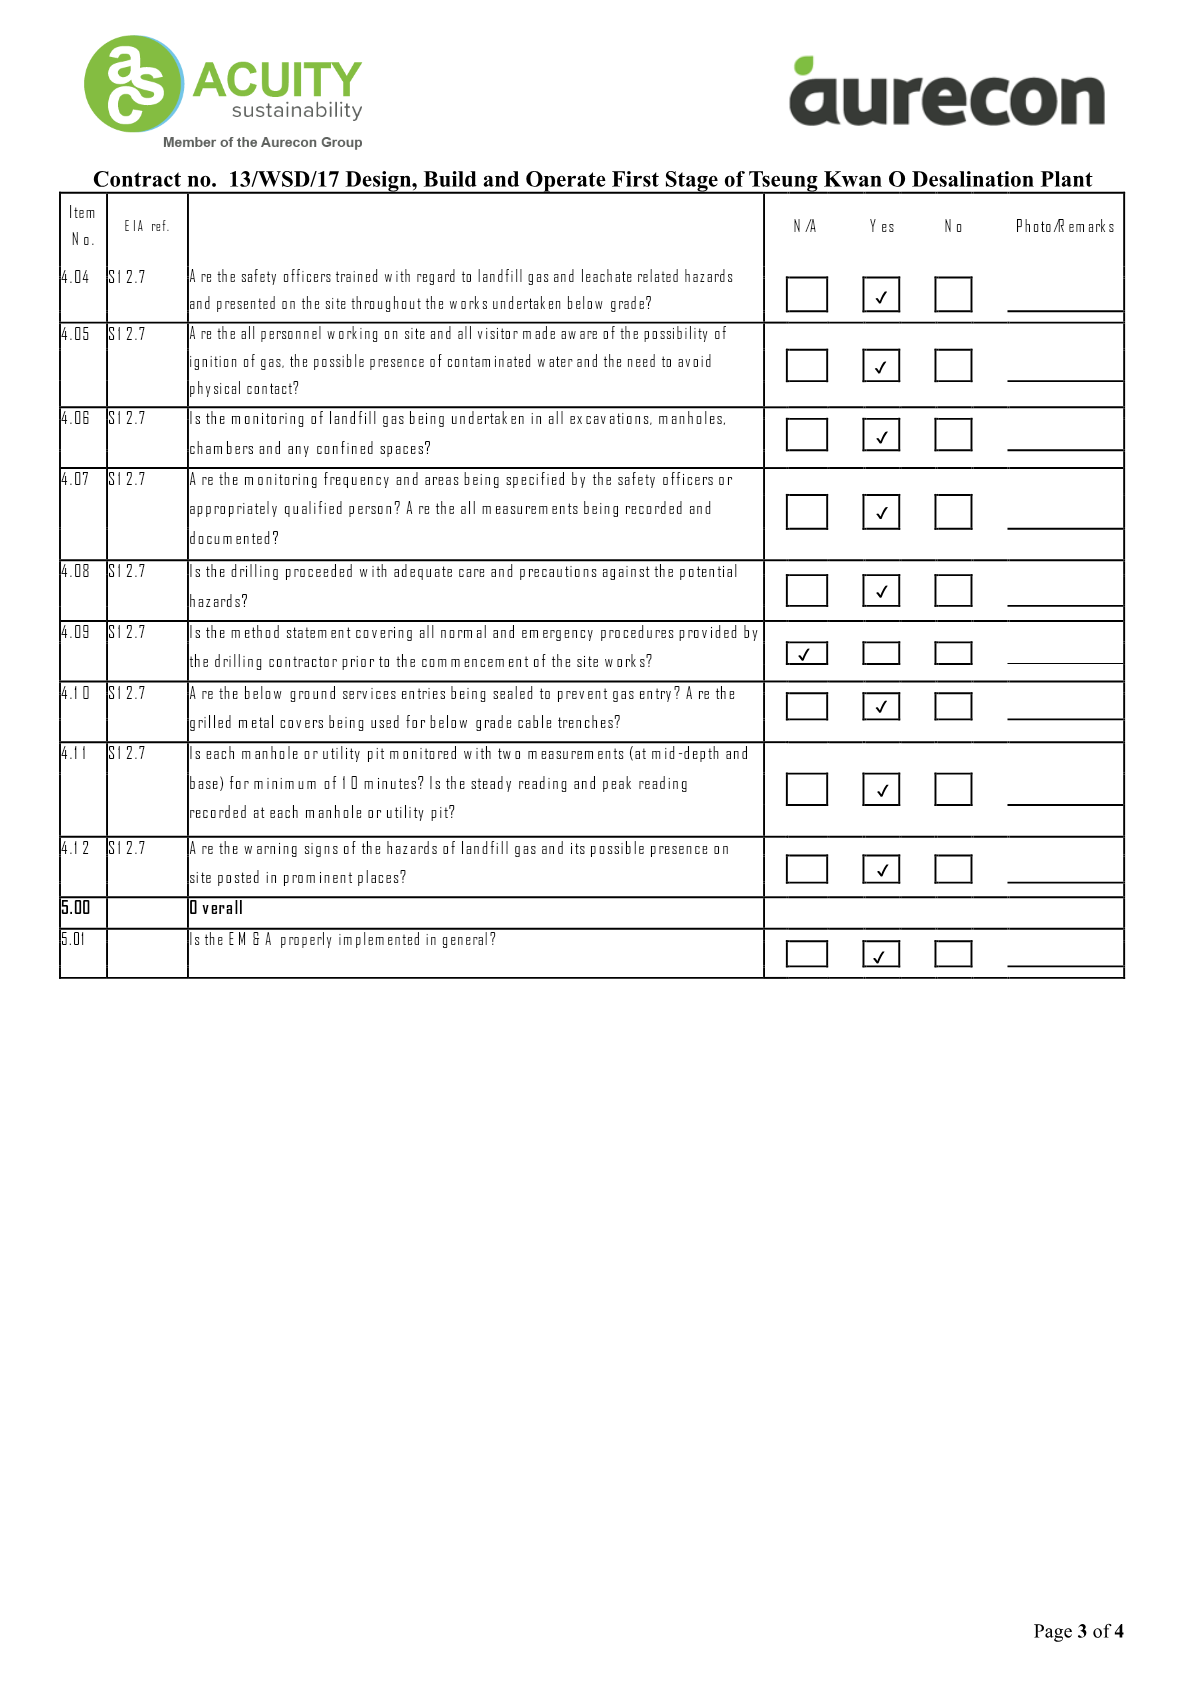
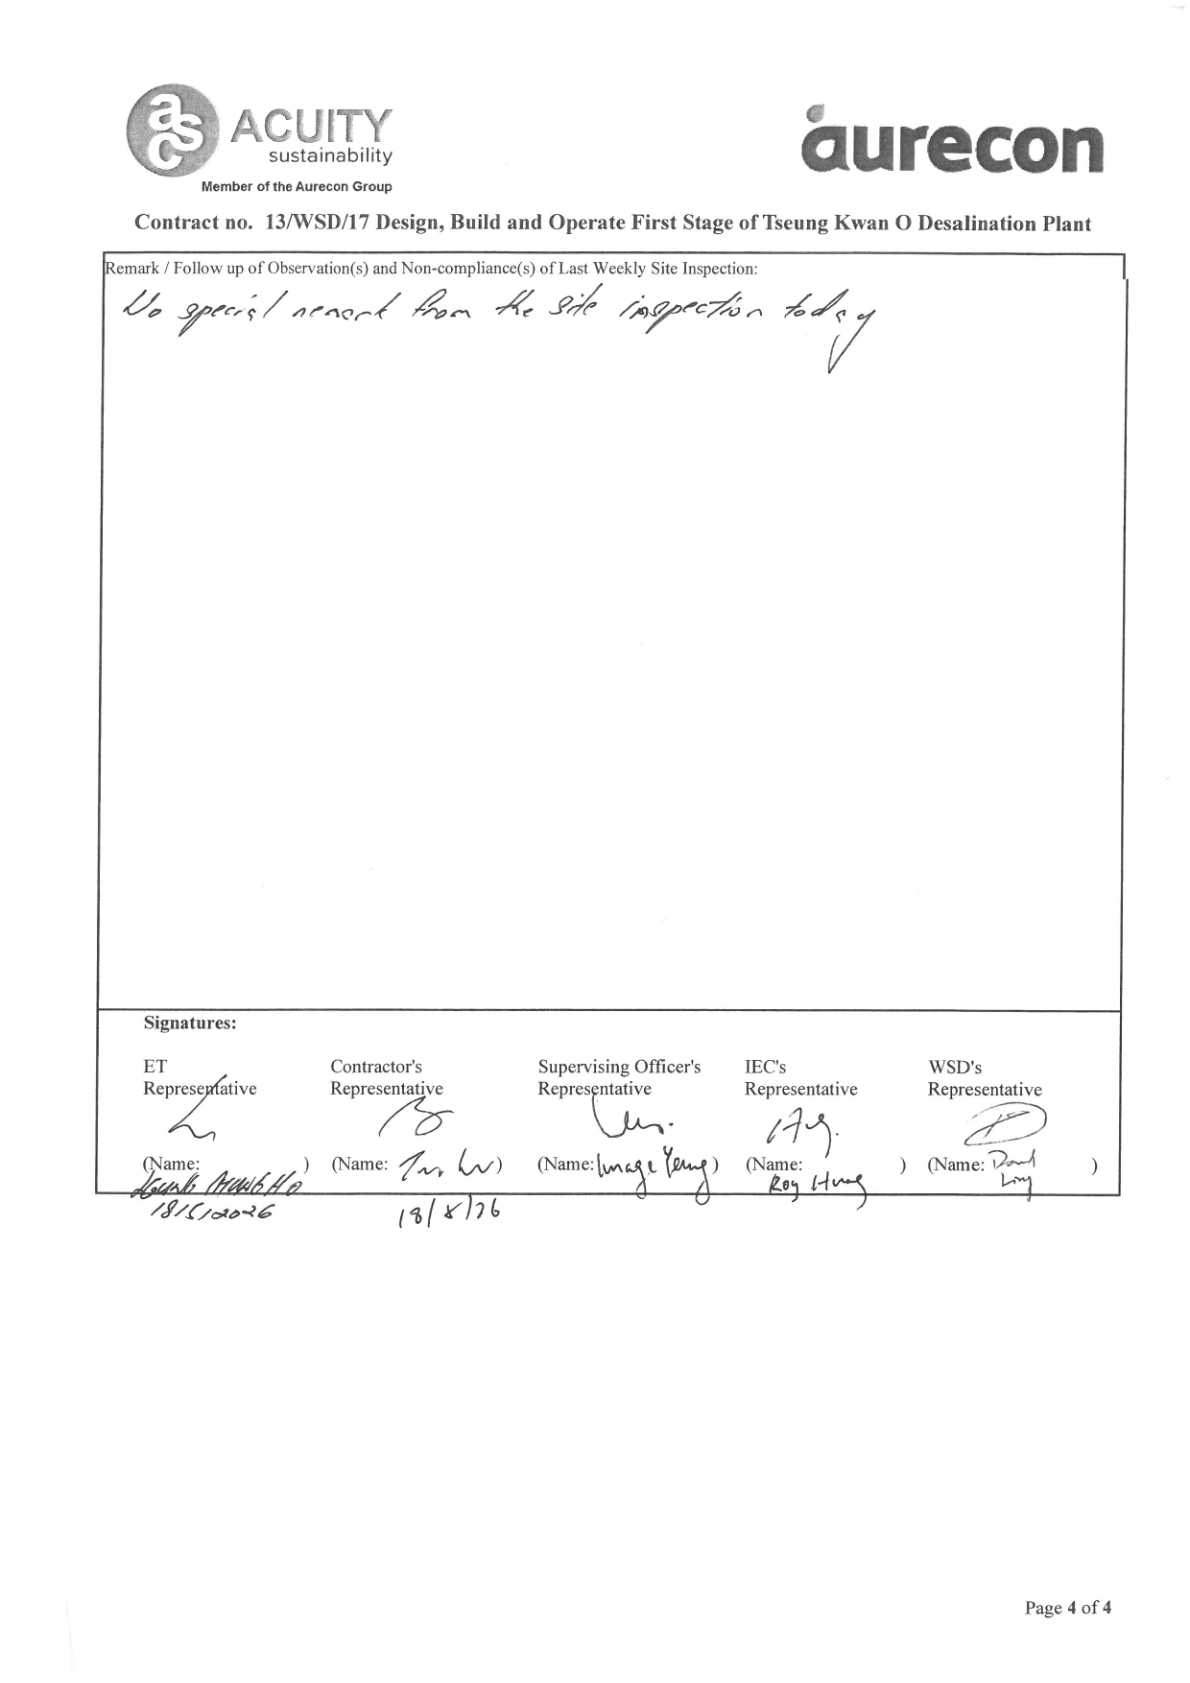
Appendix G
Complaint Log
Statistical Summary of Environmental Complaints
|
Reporting Period
|
Environmental Complaint Statistics
|
|
Frequency
|
Cumulative
|
Complaint Nature
|
|
1 31 May
2026
|
0
|
2
|
N/A
|
Statistical Summary of Environmental Summons
|
Reporting Period
|
Environmental Summons Statistics
|
|
Frequency
|
Cumulative
|
Details
|
|
1 31 May
2026
|
0
|
0
|
N/A
|
Statistical Summary of Environmental Prosecution
|
Reporting Period
|
Environmental Prosecution Statistics
|
|
Frequency
|
Cumulative
|
Details
|
|
1 31 May
2026
|
0
|
0
|
N/A
|
Appendix H
Coral Survey Report
1
INTRODUCTION
1.1
Background
1.1.1 The Project, Design,
Build and Operate First Stage of Tseung Kwan O Desalination Plant (TKODP), is a Designated Project
under the Environmental Impact Assessment Ordinance
(Cap. 499) (EIAO)
and is currently governed by a Further Environmental Permit (EP No. FEP
01/503/2015/B) for the construction and operation of the Project.
1.1.2 The Jardine Engineering
Corporation, Limited, China State Construction Engineering (Hong Kong) Limited and Acciona Agua, S.A. Trading
As AJC Joint Venture (AJCJV)
is contracted to carry out the
Design, Build and Operate First Stage of Tseung Kwan O Desalination Plant (TKODP) under Contract
No. 13/WSD/17 (the Project).
1.1.3 Acuity Sustainability
Consulting Limited (ASCL) is commissioned by AJCJV to undertake the
Environmental Team (ET) services as required and/or implied, both explicitly
and implicitly, in the Environmental Permit (EP), Environmental Impact
Assessment Report (EIA Report) (Register No. AEIAR-192/2015) and Environmental Monitoring and Audit Manual
(EM&A Manual) for the Project; and to carry out the
Environmental Monitoring and Audit (EM&A) programme in fulfillment of the
EIA Reports EM&A requirements and Contract No. 13/WSD/17 Specification
requirements.
1.1.4 The proposed
Desalination Plant at Tseung Kwan O (TKODP) will produce potable water with an
initial capacity of 135 million
litres per day (MLD), expandable to an ultimate
capacity of 270 MLD in the future to provide a secure and
alternative fresh water resource complying with the World Health Organization
(WHO) standards. The plant will adopt the Seawater Reverse Osmosis (SWRO)
technology, which dominates the market due to its reliability and progressive
reduction in cost as the technology advances.
1.1.5 A baseline coral survey
was conducted in October 2023 to verify the validity of the pervious EIA
findings as well as to provide updated coral data for impact monitoring during
the construction and operation phases. Two indirect impact sites and one control
site were identified during the baseline coral survey for impact monitoring.
2
Methodology
2.1
All
tagged coral colonies in C2, C3 and C8 will be monitored monthly during the
first year of Project operation. The monitoring team will record the following
parameters (using the same methodology adopted during the pre-construction
phase survey): size, presence, survival, health conditions (percentage of
mortality) and percentage of sediment of each tagged coral colonies. The
general environmental conditions during the survey date will also be monitored.
2.2
Photographic records of the tagged coral colonies will be taken
as far as possible maintaining the same aspect and orientation as photographs taken for the pre-translocation surveys.
All the tags for marking coral colonies will be removed /
retrieved once the monitoring programme is completed.
2.3
The results
of the operation phase monitoring surveys should be reviewed with reference to findings of the baseline survey.
2.4
If,
during the operation phase monitoring, observations of any die-off / abnormal
conditions of the tagged corals are made, the ET will inform the Contractor, Independent Environmental Checker (IEC)/ Environmental Project Office
(ENPO), Agriculture, Fisheries and Conservation Department (AFCD) and in
liaison with AFCD investigate any measures needed.
2.5 Monitoring result will
be reviewed and be compared against the Action Level and Limit Level (AL/LL) as
set out in Table 2-1. Actions specified on Table 2-2 will be taken by ET, IEC,
SOR and Contractor shall there be exceedance of AL/LL
Table 2-1 Action and Limit Levels
for Operation Phase Coral Monitoring
|
Parameter
|
Action Level
Definition
|
Limit Level
Definition
|
|
Mortality
|
If
during Impact Monitoring a 15% increase in the percentage of partial
mortality on the corals occurs at more than 20% of the tagged indirect impact site coral
colonies that is not recorded on the tagged corals at the control site, then
the Action Level is exceeded
|
If
during Impact Monitoring a 25% increase in the percentage of partial
mortality on the corals occurs at more than 20% of the tagged indirect impact
site coral colonies that is not recorded on
the tagged corals
at the control
site,
then the Limit Level
is exceeded
|
Note: If the defined
Action Level or Limit Level for coral monitoring is exceeded, the actions as set out in Table 5-4 will be implemented.
Table 2-2 Event and Action Plan for Operation
Phase Monitoring
|
Event
|
Action
|
|
ET Leader
|
IEC
|
SOR
|
Contractor
|
|
Action Level Exceedance
|
1.
Check monitoring data
2.
Inform the IEC,
SOR and
Contractor of the
findings;
3.
Increase the monitoring to at
least once a month to confirm findings;
4.
Propose mitigation measures for
consideration
|
1.
Discuss monitoring with
the ET and the Contractor;
2.
Review proposals for additional monitoring and any other measures submitted by the
Contractor and advise the SOR accordingly.
|
1.
Discuss with the IEC
additional monitoring requirements and any other
measures proposed by the ET;
2.
Make agreement on the
measures to be
implemented.
|
1.
Inform
the SOR and confirm notification of the non-
compliance
in writing;
2.
Discuss
with the ET and the IEC and propose measures to the IEC and the SOR;
3.
Implement
the agreed measures.
|
Remark: ** The SOR is equivalent to the ER as defined
in the EM&A Manual of the Project
3. Result
3.1
The
May 2026 operation phase monitoring were performed on 21st May 2026
for both Indirect Impact Sites and Control Site (Figure 1 and 2); and the
weather conditions were summarized in Table 3.1.
Table 3.1 Weather Condition for the May 2026 Operation Phase Monitoring
|
Date
|
Condition
|
Average Underwater Visibility
|
|
21st May 2026
|
-
Southwest 4 to 5
-
Sunny
|
0.5
1 m
|
3.2
Ten (10) hard coral colonies in C2, C3 and C8 were monitored
at each site of Control
and Indirect Impact sites as suggested in the
Operation Phase Monitoring Plan. The
general health conditions (size, mortality, bleaching and sediment) were recorded and summarized in Table 3.2, Table 3.3 and Table
3.4 Photos of each tagged coral colonies were taken during
the monitoring activities and shown in Appendix
A (Photo Plate A, B and C).
3.3
All
other tagged coral colonies showed good health condition during the February
2026 Monitoring survey.
Table 3.2 Sizes, Condition, Mortality, Bleaching and Sediment of 10 Natural
Coral Colonies at Control
Site C8 during May 2026 Coral Monitoring Survey
|
Tag #
|
Species
|
Size (cm)
Max. Diameter
|
Condition
|
Mortality (%)
|
Bleaching (%)
|
Sediment (%)
|
|
|
|
|
|
Baseline
|
21-May
|
Baseline
|
21-May
|
Baseline
|
21-May
|
|
1
|
Favites pentagona
|
82
|
Good
|
0
|
0
|
0
|
0
|
0
|
0
|
|
2
|
Porites lutea
|
66
|
Good
|
0
|
0
|
0
|
0
|
0
|
0
|
|
3
|
Plesiastrea versipora
|
43
|
Good
|
0
|
0
|
0
|
0
|
0
|
0
|
|
4
|
Platygyra carnosus
|
36
|
Good
|
0
|
0
|
0
|
0
|
0
|
0
|
|
5
|
Acropora solitaryensis
|
42
|
Good
|
0
|
0
|
0
|
0
|
0
|
0
|
|
6
|
Acropora solitaryensis
|
55
|
Good
|
0
|
0
|
0
|
0
|
0
|
0
|
|
7
|
Bernardpora stutchburyi
|
25
|
Good
|
0
|
0
|
0
|
0
|
0
|
0
|
|
8
|
Favites pentagona
|
26
|
Good
|
0
|
0
|
0
|
0
|
0
|
0
|
|
9
|
Platygyra carnosus
|
34
|
Good
|
0
|
0
|
0
|
0
|
0
|
0
|
|
10
|
Acropora solitaryensis
|
39
|
Good
|
0
|
0
|
0
|
0
|
0
|
0
|
Table 3.3 Sizes, Condition, Mortality, Bleaching and Sediment of 10 Natural
Coral Colonies at Indirect Impact Site C2 during May 2026
Coral Monitoring Survey
|
Tag #
|
Species
|
Size (cm)
Max. Diameter
|
Condition
|
Mortality (%)
|
Bleaching (%)
|
Sediment (%)
|
|
|
|
|
|
Baseline
|
21-May
|
Baseline
|
21-May
|
Baseline
|
21-May
|
|
1#
|
Dipsastraea speciosa
|
23
|
Good
|
0
|
0
|
0
|
0
|
0
|
0
|
|
2
|
Favites abdita
|
45
|
Good
|
0
|
0
|
0
|
0
|
0
|
0
|
|
3
|
Duncanopsammia peltata
|
52
|
Good
|
0
|
0
|
0
|
0
|
0
|
0
|
|
4
|
Platygyra carnosus
|
23
|
Good
|
0
|
0
|
0
|
0
|
0
|
0
|
|
5
|
Favites pentagona
|
25
|
Good
|
0
|
0
|
0
|
0
|
0
|
0
|
|
6
|
Plesiastrea versipora
|
26
|
Good
|
0
|
0
|
0
|
0
|
0
|
0
|
|
7
|
Dipsastraea rotumana
|
32
|
Good
|
0
|
0
|
0
|
0
|
0
|
0
|
|
8
|
Dipsastraea speciosa
|
22
|
Good
|
0
|
0
|
0
|
0
|
0
|
0
|
|
9
|
Porites lutea
|
44
|
Good
|
0
|
0
|
0
|
0
|
0
|
0
|
|
10
|
Porites lutea
|
48
|
Good
|
0
|
0
|
0
|
0
|
0
|
0
|
Table 3.4 Sizes, Condition, Mortality, Bleaching and Sediment of 10 Natural
Coral Colonies at Indirect Impact Site C3 during May 2026
Coral Monitoring Survey
|
Tag #
|
Species
|
Size (cm)
Max. Diameter
|
Condition
|
Mortality (%)
|
Bleaching (%)
|
Sediment (%)
|
|
|
|
|
|
Baseline
|
21-May
|
Baseline
|
21-May
|
Baseline
|
21-May
|
|
11
|
Acropora solitaryensis
|
45
|
Fair
|
0
|
40
|
0
|
0
|
0
|
0
|
|
12
|
Platygyra carnosa
|
35
|
Good
|
0
|
0
|
0
|
0
|
0
|
0
|
|
13
|
Favites pentagona
|
36
|
Good
|
0
|
0
|
0
|
0
|
0
|
0
|
|
14
|
Platygyra carnosa
|
28
|
Good
|
0
|
0
|
0
|
0
|
0
|
0
|
|
15
|
Dipsastraea veroni
|
32
|
Fair
|
0
|
0
|
0
|
0
|
0
|
0
|
|
16
|
Favites flexuosa
|
24
|
Good
|
0
|
0
|
0
|
0
|
0
|
0
|
|
17
|
Favites chinensis
|
63
|
Good
|
0
|
10
|
0
|
0
|
0
|
0
|
|
18
|
Plesiastrea versipora
|
26
|
Good
|
0
|
10
|
0
|
0
|
0
|
0
|
|
19
|
Duncanopsammia peltata
|
37
|
Good
|
0
|
0
|
0
|
0
|
0
|
0
|
|
20
|
Platygyra carnosus
|
29
|
Good
|
0
|
0
|
0
|
0
|
0
|
0
|
4. Discussion and Conclusion
4.1
The
May 2026 coral monitoring survey were carried out in the indirect impact area
(C2 and C3) and control site (C8) on 21st May 2026. A total of 30 tagged coral colonies (10 at
control site and 20 and two indirect impact sites) were monitored.
4.2
No sediment, bleaching or increased mortality in the general condition
of all other tagged coral colonies
were observed during the monthly operation phase monitoring period. No deterioration of the coral community
was observed in the ecological monitoring results when compared with the
baseline ecological monitoring results.
There is no AL/LL exceedance during the monitoring period. Photos of each tagged corals colonies were taken
and shown in Appendix A (Photo Plates A, B and C).
Figure 1 Two Proposed
Indirect Impact Sites (C2 and C3) during
Operation Phase
Figure 2 Proposed Control
Site (C8) during
Operation Phase
APPENDIX A TAGGED CORAL PHOTO
Photo Plate A Tagged Corals
at Control Site C8
|
Tag #
|
21 May 2026
|
|
#1
|
|
|
#2
|
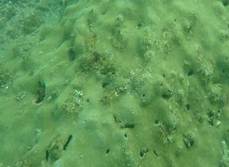
|
|
#3
|
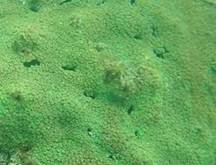
|
|
#4
|
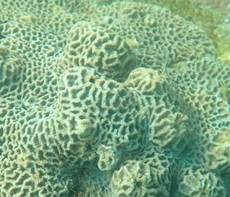
|
|
Tag #
|
21 May 2026
|
|
#1
|
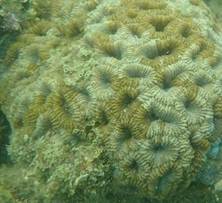
|
|
#2
|
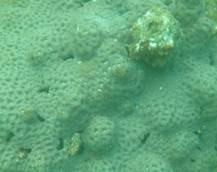
|
|
#3
|
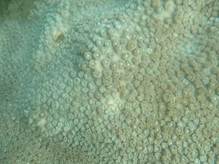
|
|
Tag #
|
21 May 2026
|
|
#11
|
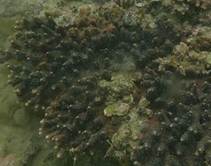
|
|
#12
|
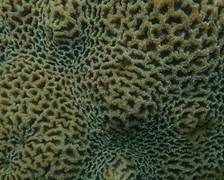
|
Appendix I
Fishery Survey Report
The copyright of this document
is owned by Acuity Sustainability Consulting Limited. It may not be reproduced except with prior written approval
from the Company.
Acuity Sustainability Consulting Limited
1
Introduction
1.1
Background
 Water
Supplies Department (WSD) appointed Black & Veatch Hong Kong Limited
(B&V) to undertake the consultancy Agreement No. CE 8/2015 (WS) First
Stage of Desalination Plantat Tseung Kwan O Investigation, Design, and Construction on 16 November 2015.
Water
Supplies Department (WSD) appointed Black & Veatch Hong Kong Limited
(B&V) to undertake the consultancy Agreement No. CE 8/2015 (WS) First
Stage of Desalination Plantat Tseung Kwan O Investigation, Design, and Construction on 16 November 2015.
 The purpose
of the Project is to construct a sea water
reverse osmosis (SWRO)
desalination plant at Tseung
Kwan O (TKO) Area 137, together with all ancillary facilities and the slope mitigation works in the adjoining Clear
Water Bay Country Park.
The purpose
of the Project is to construct a sea water
reverse osmosis (SWRO)
desalination plant at Tseung
Kwan O (TKO) Area 137, together with all ancillary facilities and the slope mitigation works in the adjoining Clear
Water Bay Country Park.
 The first stage of the proposed SWRO desalination plant will have a water
production capacity of 135,000 cubic meters (m3) per day with provision
for future expansion
to the ultimate capacity up to 270,000 m3 per
day when necessary.
The first stage of the proposed SWRO desalination plant will have a water
production capacity of 135,000 cubic meters (m3) per day with provision
for future expansion
to the ultimate capacity up to 270,000 m3 per
day when necessary.
 The
Project is classified as a Designated Project (DP) under the Environmental
Impact Assessment Ordinance (EIAO). An Environmental Impact Assessment (EIA) was completed
in accordance with the
EIAO under the Feasibility Study (FS) stage of the Project. The EIA Report for
the Project (Register No.: AEIAR-192/2015) was approved with conditions on 4
November 2015 under the EIAO. Following the approval of the EIA Report, the
Environmental Permit (EP) (No: EP- 503/2015), covering the construction and operation of Project, was granted on4 December 2015. The EP for
this Project was subsequently amended
and the amended
EP (No. EP-503/2015/A) was granted on 26 January 2018
under the EIAO. Baseline fisheries monitoring was conduction in September
2018 to February 2019
The
Project is classified as a Designated Project (DP) under the Environmental
Impact Assessment Ordinance (EIAO). An Environmental Impact Assessment (EIA) was completed
in accordance with the
EIAO under the Feasibility Study (FS) stage of the Project. The EIA Report for
the Project (Register No.: AEIAR-192/2015) was approved with conditions on 4
November 2015 under the EIAO. Following the approval of the EIA Report, the
Environmental Permit (EP) (No: EP- 503/2015), covering the construction and operation of Project, was granted on4 December 2015. The EP for
this Project was subsequently amended
and the amended
EP (No. EP-503/2015/A) was granted on 26 January 2018
under the EIAO. Baseline fisheries monitoring was conduction in September
2018 to February 2019
1.2
Purpose of this
Report
 An Environmental Monitoring and Audit
(EM&A) programme of regular fisheries monitoring is recommended under the approval conditions of the EIA Report
for the Project. The purpose of the
EM&A programme is to monitor the fisheries impact of the Project. Pursuant
to these EIA approval conditions, details
of the regular fisheries monitoring programme
shall be submitted to the Director of Environmental Protection (DEP) for
prior approval.
An Environmental Monitoring and Audit
(EM&A) programme of regular fisheries monitoring is recommended under the approval conditions of the EIA Report
for the Project. The purpose of the
EM&A programme is to monitor the fisheries impact of the Project. Pursuant
to these EIA approval conditions, details
of the regular fisheries monitoring programme
shall be submitted to the Director of Environmental Protection (DEP) for
prior approval.
 The regular
fisheries monitoring programme
including the methodologies for carrying out adult
fish survey, juvenile fish survey,
ichthyoplankton survey and supplementary water quality
monitoring during the pre-construction (or baseline period),
construction and operational stages of the Project
are presented in the Final
Methodology Paper on Regular Fisheries
Monitoring issued by B&V on 31 August 2018. The dry season of
the operational works were subsequently carried
out on 7th and 15th February 2026. This Report is
prepared to present the progress of the operationsal phase fisheries
monitoring.
The regular
fisheries monitoring programme
including the methodologies for carrying out adult
fish survey, juvenile fish survey,
ichthyoplankton survey and supplementary water quality
monitoring during the pre-construction (or baseline period),
construction and operational stages of the Project
are presented in the Final
Methodology Paper on Regular Fisheries
Monitoring issued by B&V on 31 August 2018. The dry season of
the operational works were subsequently carried
out on 7th and 15th February 2026. This Report is
prepared to present the progress of the operationsal phase fisheries
monitoring.
2
Summary of EIA Findings
and Updated Fisheries
Survey
 This
Project comprises submarine utilities including a seawater intake and a
submarine outfall in Joss House Bay. The approved EIA Report predicted that the
potential impacts on fisheriesresources would be confined within
close proximity of these submarine
utilities. No important fish spawning and nursery
grounds were identified near the
proposed submarine utilities with
reference to the findings of
literature review undertaken during the EIA stage. The EIA Report concluded
that no significant fisheries impact would arise from construction and
operation of the proposed submarine utilities.
This
Project comprises submarine utilities including a seawater intake and a
submarine outfall in Joss House Bay. The approved EIA Report predicted that the
potential impacts on fisheriesresources would be confined within
close proximity of these submarine
utilities. No important fish spawning and nursery
grounds were identified near the
proposed submarine utilities with
reference to the findings of
literature review undertaken during the EIA stage. The EIA Report concluded
that no significant fisheries impact would arise from construction and
operation of the proposed submarine utilities.
 In accordance with Condition 2.9 of the EP, an Updated Fisheries
Survey was carried
out in 2015 to 2016 to verify if any significant fish spawning and
nursery grounds in the vicinity ofthe proposed submarine utilities. The Updated
Fisheries Survey revealed no important fish spawning and nursery grounds near the proposed
submarine utilities and affirmed the conclusion
made in the approved EIA Report. The results of the Updated Fisheries Survey
arepresented in the Consultancy Services for Updated Fisheries Survey for
Tseung Kwan ODesalination Plant Final Report issued by ERM on 6 June 2017.
In accordance with Condition 2.9 of the EP, an Updated Fisheries
Survey was carried
out in 2015 to 2016 to verify if any significant fish spawning and
nursery grounds in the vicinity ofthe proposed submarine utilities. The Updated
Fisheries Survey revealed no important fish spawning and nursery grounds near the proposed
submarine utilities and affirmed the conclusion
made in the approved EIA Report. The results of the Updated Fisheries Survey
arepresented in the Consultancy Services for Updated Fisheries Survey for
Tseung Kwan ODesalination Plant Final Report issued by ERM on 6 June 2017.
3
Monitoring Methodology
3.1
Monitoring Parameters and Programme
 The purpose of this baseline fisheries
monitoring programme is to update the information onfisheries resources
in Joss House Bay and nearby water during the project operation. Under the
monitoring programme, survey on adult fish, juvenile fish and ichtyoplankton
were carried out 2 times in wet season and 2 times
in dry season to examine the
following:
The purpose of this baseline fisheries
monitoring programme is to update the information onfisheries resources
in Joss House Bay and nearby water during the project operation. Under the
monitoring programme, survey on adult fish, juvenile fish and ichtyoplankton
were carried out 2 times in wet season and 2 times
in dry season to examine the
following:
Fish species composition;
Abundance: number of fish captured;
Diversity of fish resources:
species diversity and evenness;
Size: range of total length;
Biomass in weight; and
Values of catches of commercial species:
catch per unit effort (CPUE)
and yield per unit
effort (YPUE).
A summary of the fisheries monitoring
programme is provided in table below.
Table 3-1: Fisheries Monitoring Programme
|
Monitoring
|
Method
|
Fisheries Monitoring Dates
|
|
Dry Season
|
|
Event 1
|
Event 2
|
|
Adult Fish
Survey
|
Gill Netting and Cage Trapping
|
7 February 2026
|
15 February 2026
|
|
Juvenile Fish
Survey
|
Purse-seining
|
7 February 2026
|
15 February 2026
|
|
Ichtyoplankton Survey
|
PlanktonTowing
|
7 February 2026
|
15 February 2026
|
3.2
Fisheries Resource Sampling Locations
 Six
(6) fisheries sampling locations were set up in Joss House Bay and its vicinity
to monitor the fisheries resources.
Six
(6) fisheries sampling locations were set up in Joss House Bay and its vicinity
to monitor the fisheries resources.
 Two (2) sampling locations
were set up in the Impact Area (IPA) in close proximity of the direct footprint of the proposed
submarine utilities around
TKO Area 137.
Two (2) sampling locations
were set up in the Impact Area (IPA) in close proximity of the direct footprint of the proposed
submarine utilities around
TKO Area 137.
 Two (2) sampling locations
were set up in the Gradient Area (GDA) between
the proposed submarine utilities and Tung Lung Chau Fish Culture Zone (FCZ).
Two (2) sampling locations
were set up in the Gradient Area (GDA) between
the proposed submarine utilities and Tung Lung Chau Fish Culture Zone (FCZ).
 Two
(2) reference locations were set up in the Control Area (CLA) in outer Joss
House Bay between the waters of Tung Lung
Chau and Fat Tong Mun. These
reference locations are further away
from the Project discharge (based on the EIA prediction) and will serve as
control stations.
Two
(2) reference locations were set up in the Control Area (CLA) in outer Joss
House Bay between the waters of Tung Lung
Chau and Fat Tong Mun. These
reference locations are further away
from the Project discharge (based on the EIA prediction) and will serve as
control stations.
 The fisheries resource
sampling locations are summarized in Table 3-2 and shownin Figure 3.1.
The fisheries resource
sampling locations are summarized in Table 3-2 and shownin Figure 3.1.

Table 3-2: Fisheries Resource
Sampling Locations
|
Monitoring
|
Sampling Location or Transect ID (see Figure
2.1)
|
|
Impact Area (IPA)
|
Gradient Area (GDA)
|
Control Area (CLA)
|
|
Adult Fish
Survey
|
P1, P2
|
G1, G2
|
R1, R2
|
|
Juvenile Fish
Survey
|
P1, P2
|
G1, G2
|
R1, R2
|
|
Ichtyoplankton Survey
|
T1, T2
|
T5, T6
|
T3, T4
|
Figure 3.1 Fisheries Resources
Monitoring Locations
3.3
Adult Fish Survey Methodology
 Two
fishing methods, gill netting and cage trapping, were used to sample pelagic
and demersal adult fish resources at each sampling
location. These methods
are also commonly
used by local fishermen in
Hong Kong waters.
Two
fishing methods, gill netting and cage trapping, were used to sample pelagic
and demersal adult fish resources at each sampling
location. These methods
are also commonly
used by local fishermen in
Hong Kong waters.
Pelagic Fish Survey Gill Netting
 Under each sampling event, a pair of trammel
(gill) nets was deployed for one (1) hour at each
sampling location. The nets were 1 m deep, 30 m in length and comprised of
three (3) layers,with two 20 cm mesh stretches sandwiching a 5 cm mesh stretch.
All fish species captured were recorded and identified to species level as far
as practicable. Each gill netting survey was analysed for species composition, abundance, size (total length),
biomass in weight
and diversity of adult fish.
Under each sampling event, a pair of trammel
(gill) nets was deployed for one (1) hour at each
sampling location. The nets were 1 m deep, 30 m in length and comprised of
three (3) layers,with two 20 cm mesh stretches sandwiching a 5 cm mesh stretch.
All fish species captured were recorded and identified to species level as far
as practicable. Each gill netting survey was analysed for species composition, abundance, size (total length),
biomass in weight
and diversity of adult fish.
Demersal Fish Survey Cage Trapping
 Two sets of four metal wire cage traps, each ranged from 0.8 to 0.9 m3 in volume and mesh size of 25 mm, were deployed for one (1) hour
at each sampling location. Distance between the traps was about 10 m, and the
distance between each set of traps was about 100 m. Breador other suitable fish bait was used as bait for cage trapping.
All species caught in the cage trapping
survey were identified to species level as far as practical. Each cage
trapping surveywas analysed for species composition, abundance, size (total
length), biomass in weight and diversity of adult fish.
Two sets of four metal wire cage traps, each ranged from 0.8 to 0.9 m3 in volume and mesh size of 25 mm, were deployed for one (1) hour
at each sampling location. Distance between the traps was about 10 m, and the
distance between each set of traps was about 100 m. Breador other suitable fish bait was used as bait for cage trapping.
All species caught in the cage trapping
survey were identified to species level as far as practical. Each cage
trapping surveywas analysed for species composition, abundance, size (total
length), biomass in weight and diversity of adult fish.
3.4
Juvenile Fish Survey Methodology
 A typical purse-seine fishing method was used to sample juvenile
fish at each sampling location. The
nets adopted in the survey ranged from 5 to 15 m deep (depending on the
waterdepth) and were 50 m in length, and with 6 mm mesh
size (maximum stretched). For each sampling event, both a mother boat and
a P4 sampan were deploy the seine net for
approximately 30 to 45 minutes, with each boat holding one end of the net. The nets were pulled
towards the fish resources in the form
of a semi-circle. Fish catches
were concentratedand lifted onto the mother boat. All fishes captured were recorded and identified to species level as far as practicable.
A typical purse-seine fishing method was used to sample juvenile
fish at each sampling location. The
nets adopted in the survey ranged from 5 to 15 m deep (depending on the
waterdepth) and were 50 m in length, and with 6 mm mesh
size (maximum stretched). For each sampling event, both a mother boat and
a P4 sampan were deploy the seine net for
approximately 30 to 45 minutes, with each boat holding one end of the net. The nets were pulled
towards the fish resources in the form
of a semi-circle. Fish catches
were concentratedand lifted onto the mother boat. All fishes captured were recorded and identified to species level as far as practicable.
3.5
Ichthyoplankton Survey Methodology
 To
investigate spatial and seasonal or temporal variation of fish egg and fish
larvae composition, ichthyoplankton survey was conducted at each sampling
transect using plankton towing to collect representative samples.
To
investigate spatial and seasonal or temporal variation of fish egg and fish
larvae composition, ichthyoplankton survey was conducted at each sampling
transect using plankton towing to collect representative samples.
 A bongo plankton net, of 50 cm mouth
diameter and with 0.5 mm mesh size, was deployed tocollect ichthyoplankton. A flow meter was fitted at mouth of the net to record the volume ofwater
filtered.
A bongo plankton net, of 50 cm mouth
diameter and with 0.5 mm mesh size, was deployed tocollect ichthyoplankton. A flow meter was fitted at mouth of the net to record the volume ofwater
filtered.
 At
each site, three (3) replicate tows were conducted, and each tow with a
duration of 15 minutes. The net was deployed in a single oblique tow to a depth of 2m off the seabed and towed at a speed
of 1-2 knots. Consequently, the net was gradually winched up towards thewater
surface in order to sample the entire water column.
At
each site, three (3) replicate tows were conducted, and each tow with a
duration of 15 minutes. The net was deployed in a single oblique tow to a depth of 2m off the seabed and towed at a speed
of 1-2 knots. Consequently, the net was gradually winched up towards thewater
surface in order to sample the entire water column.
 The plankton
was immediately fixed in 70% ethanol. The ichthyoplankton was sorted, number counted and size range measured in
the laboratory. All fish egg and fish
larvae captured wererecorded and identified to the lowest taxonomic level,
where possible. Larval fish individual without
distinctive morphological features for taxonomic identification were examined with
The plankton
was immediately fixed in 70% ethanol. The ichthyoplankton was sorted, number counted and size range measured in
the laboratory. All fish egg and fish
larvae captured wererecorded and identified to the lowest taxonomic level,
where possible. Larval fish individual without
distinctive morphological features for taxonomic identification were examined with
the aid of DNA sequencing if deemed necessary.
Species composition, abundance and diversity
of species were measured
to describe and compare
temporal and spatial changes.
3.6
Data Analysis
 Data collected
under each fisheries
monitoring event were analyzed to assess the spatial and temporal variations of species
abundance and total biomass (for adult and juvenile fish)/
density (for ichthyoplankton). Temporal (wet vs. dry) and spatial (e.g.
Impact Area vs. Control Area) differences in fish abundance were compared using
descriptive statistics and/ or inferential statistics (Microsoft Excel and/or
Statistical Package for the Social Sciences (SPSS)), followed by multiple
comparison procedures, as appropriate. Diversity
of fish resources was
presented as species richness, Shannon-Weiner diversity (H) and Pielous
evenness (J). Patterns of fish species composition are presented and subject to statistical analyses
as above. Values of catches of commercial
species for adult and juvenile fishes are presented in terms CPUE (number of
individuals per fishing time and number of nets or cages) and YPUE
(weightof fish per survey time and number of nets or cages).
Data collected
under each fisheries
monitoring event were analyzed to assess the spatial and temporal variations of species
abundance and total biomass (for adult and juvenile fish)/
density (for ichthyoplankton). Temporal (wet vs. dry) and spatial (e.g.
Impact Area vs. Control Area) differences in fish abundance were compared using
descriptive statistics and/ or inferential statistics (Microsoft Excel and/or
Statistical Package for the Social Sciences (SPSS)), followed by multiple
comparison procedures, as appropriate. Diversity
of fish resources was
presented as species richness, Shannon-Weiner diversity (H) and Pielous
evenness (J). Patterns of fish species composition are presented and subject to statistical analyses
as above. Values of catches of commercial
species for adult and juvenile fishes are presented in terms CPUE (number of
individuals per fishing time and number of nets or cages) and YPUE
(weightof fish per survey time and number of nets or cages).
4
Supplementary Water
Quality Monitoring Methodology
4.1
Monitoring Parameters and Programme
 Supplementary
water quality monitoring (in addition to those specified in the EM&AManual)
was carried out at the same frequency and locations of the fisheries monitoring
programme. The water quality
monitoring parameters include the following:
Supplementary
water quality monitoring (in addition to those specified in the EM&AManual)
was carried out at the same frequency and locations of the fisheries monitoring
programme. The water quality
monitoring parameters include the following:
In-situ measurements:
Water Depth (m)
Temperature (°C)
pH
Dissolved Oxygen (DO) (mg/L)
Turbidity (NTU)
Salinity
(ppt) Laboratory Analysis:
Suspended Solid (SS) (mg/L)
Iron (Fe) (mg/L)
Total Residual
Chlorine (TRC) (mg/L)
 Four water quality monitoring events
covering dry and wet seasons were carried out. Undereach event, in-situ measurements
and water sampling were taken at both mid-flood and mid-ebb tides. A summary of the water quality monitoring programme is provided
in Table 4-1 below.
Four water quality monitoring events
covering dry and wet seasons were carried out. Undereach event, in-situ measurements
and water sampling were taken at both mid-flood and mid-ebb tides. A summary of the water quality monitoring programme is provided
in Table 4-1 below.
Table 4-1: Supplementary Water Quality Monitoring Programme
|
Monitoring Event
|
Season
|
Date
|
Tidal Status
|
|
Event 1
|
Dry Season
|
7 February 2026
|
Mid-ebb and mid-flood
|
|
Event 2
|
Dry Season
|
15 February 2026
|
Mid-ebb and mid-flood
|
4.2
Monitoring Locations
 Supplementary
water quality monitoring was conducted at all the six (6) adult andjuvenile
fish sampling locations as shown in Figure 2.1 and summarized in Table
4-2.
Supplementary
water quality monitoring was conducted at all the six (6) adult andjuvenile
fish sampling locations as shown in Figure 2.1 and summarized in Table
4-2.
Table 4-2: Supplementary Water Quality Monitoring Locations
|
Monitoring Location ID (see Figure
2.1)
|
|
Impact Area (IPA)
|
Gradient Area
(GDA)
|
Control Area (CLA)
|
|
P1, P2
|
G1, G2
|
R1, R2
|
 At each location, water quality was monitored
at 3 water depths (i.e. 1m below sea surface,
mid-depth and 1 m above seabed).
At each location, water quality was monitored
at 3 water depths (i.e. 1m below sea surface,
mid-depth and 1 m above seabed).
4.3
Monitoring Methodology
Monitoring Equipment
 The equipment used in the supplementary water quality monitoring is summarized in Table4-3.
Table 4-3: Monitoring Equipment
|
Equipment
|
Model
|
|
Water Sampler
|
Kahlsico Water Samplers
|
|
Multi-parameter Water
Quality System
|
YSI ProDSS
|
Sampling Procedures
 Water
depth was measured at each monitoring location and the levels of the three
monitoring depths were then determined. At each monitoring depth, two replicate
measurements of temperature, pH, DO, turbidity and salinity were taken in-situ
and two replicate water samples were collected for laboratory analysis of
SS, Fe and TRC. Following collection, water samplesfor laboratory analysis were
stored in high density polythene bottles with no preservatives added, packed in ice (cooled to 4°C
without being frozen) and kept in dark during both on- temporary storage and
delivery to the testing laboratory.
Water
depth was measured at each monitoring location and the levels of the three
monitoring depths were then determined. At each monitoring depth, two replicate
measurements of temperature, pH, DO, turbidity and salinity were taken in-situ
and two replicate water samples were collected for laboratory analysis of
SS, Fe and TRC. Following collection, water samplesfor laboratory analysis were
stored in high density polythene bottles with no preservatives added, packed in ice (cooled to 4°C
without being frozen) and kept in dark during both on- temporary storage and
delivery to the testing laboratory.
Laboratory Analytical Methods
 The
testing of SS, Fe and TRC were conducted by ETS-Testconsult LTD. (HOKLAS
Registration No. 022). Quality
assurance and control procedures were implemented to ensure quality and
consistency in results. The testing methods and corresponding reporting limits
are providedin Table 4-4.
The
testing of SS, Fe and TRC were conducted by ETS-Testconsult LTD. (HOKLAS
Registration No. 022). Quality
assurance and control procedures were implemented to ensure quality and
consistency in results. The testing methods and corresponding reporting limits
are providedin Table 4-4.
Table 4-4: Analytical Methods
|
Parameter
|
Analytical Method
|
Reporting Limit
|
|
Suspended solids
|
In house
method TPE/006/W
|
1 mg/L
|
|
Iron
|
In house
method TPE/012/W & TPE/029/W
|
0.2 mg/L
|
|
Total residual
chlorine
|
In house
method TPE/033/W
|
0.2 mg/L
|
5
Site Records
 For
all the above survey methods, monitoring locations were recorded using global
positioning system (GPS). During each
monitoring event, the field conditions and observations (e.g. weather
conditions, water depth (m) and temperature (°C) etc.) were recorded at each monitoring location. All field surveys
were conducted during daytime.
For
all the above survey methods, monitoring locations were recorded using global
positioning system (GPS). During each
monitoring event, the field conditions and observations (e.g. weather
conditions, water depth (m) and temperature (°C) etc.) were recorded at each monitoring location. All field surveys
were conducted during daytime.
6
Adult Fish Survey Results
6.1
Overall Adult Fish Resources
 For adult fish survey using cage trapping
and gill netting, a total 7102 g of
166 individuals comprising 9 fish species
from 9 families was recorded.
The dominant species
in terms of abundance were Pearl-spot chromis
(Chromis notata) and this species
has low commercial value.
For adult fish survey using cage trapping
and gill netting, a total 7102 g of
166 individuals comprising 9 fish species
from 9 families was recorded.
The dominant species
in terms of abundance were Pearl-spot chromis
(Chromis notata) and this species
has low commercial value.
 The overall
adult fish resources in the Study Area are summarized in Table 6-1. Location
R1 had the highest biomass and
the highest number of species of adult fish resources. The size of collected
fishspecies ranged from 6.1 to 16.5 cm (total length) and no fish species
reached marketable size (≥ 25cm).
The overall
adult fish resources in the Study Area are summarized in Table 6-1. Location
R1 had the highest biomass and
the highest number of species of adult fish resources. The size of collected
fishspecies ranged from 6.1 to 16.5 cm (total length) and no fish species
reached marketable size (≥ 25cm).
Table 6-1: Overall
Adult Fish Resources
in the Study Area during
the Dry Season Survey
|
Monitoring location
|
Total no. of species
|
Total biomass (g)
|
Total
no. of individual
|
Mean
no. of species
(±SD)
|
Mean biomass (g ±
SD)
|
Mean no. of
individual (± SD)
|
Dominant species
|
|
P1 (IPA)
|
3
|
1692
|
38
|
1.5
|
846
|
19
|
Chromis notata
|
|
P2 (IPA)
|
4
|
816
|
24
|
2
|
408
|
12
|
Chromis notata
|
|
G1 (GDA)
|
2
|
289
|
6
|
1
|
144.5
|
3
|
Chromis notata
|
|
G2 (GDA)
|
3
|
1134
|
25
|
1.5
|
567
|
12.5
|
Chromis notata
|
|
R1 (CLA)
|
5
|
1444
|
27
|
2.5
|
722
|
13.5
|
Chromis notata
|
|
R2 (CLA)
|
4
|
1727
|
46
|
2
|
863.5
|
23
|
Chromis notata
|
|
Overall
total
|
9
|
7102
|
166
|
4.5
|
3551
|
83
|
Chromis notata
|
*SD
will be calculated in the final report
after wet season
monitoring
 The
adult fish resources captured by different gear types are summarized in Table 6-2. Over 71% biomass of the adult fish resources
were captured by cage trapping, that a total of 5052g of 120 individuals comprising 8 species of 7 families was
recorded. Location P1 had the highest biomass while location R1 had the highest
number of species
of adult fish resources recorded. For gill-netting, 2050 g of 46 individuals comprising 4 species
of 4 families were recorded. Location P1 had the highest biomass
and highest number
of species of adult fish resources recorded.
The
adult fish resources captured by different gear types are summarized in Table 6-2. Over 71% biomass of the adult fish resources
were captured by cage trapping, that a total of 5052g of 120 individuals comprising 8 species of 7 families was
recorded. Location P1 had the highest biomass while location R1 had the highest
number of species
of adult fish resources recorded. For gill-netting, 2050 g of 46 individuals comprising 4 species
of 4 families were recorded. Location P1 had the highest biomass
and highest number
of species of adult fish resources recorded.
Table 6-2: Overall
Adult Fish Resources by Different Fishing
Gears
|
Sampling
location
|
Total no. of
species
|
Total biomass (g)
|
Total no. of
individual
|
Mean no. of species (±SD)
|
Mean biomass (g ±
SD)
|
Mean no. of individual
(± SD)
|
Dominant species
|
|
Gill netting
|
|
P1 (IPA)
|
2
|
436
|
12
|
1
|
218
|
6
|
Chromis notata
|
|
P2 (IPA)
|
2
|
287
|
5
|
1
|
143.5
|
2.5
|
Chromis notata
|
|
G1 (GDA)
|
1
|
79
|
2
|
0.5
|
39.5
|
1
|
Chromis notata
|
|
G2 (GDA)
|
2
|
359
|
6
|
1
|
179.5
|
3
|
Chromis notata
|
|
R1
(CLA)
|
2
|
292
|
7
|
1
|
146
|
3.5
|
Chromis notata
|
|
R2
(CLA)
|
2
|
597
|
14
|
1
|
298.5
|
7
|
Chromis notata
|
|
Overall total
|
4
|
2050
|
46
|
2
|
1025
|
23
|
Chromis notata
|
|
Cage trapping
|
|
P1 (IPA)
|
3
|
1256
|
26
|
1.5
|
628
|
13
|
Chromis notata
|
|
P2 (IPA)
|
4
|
529
|
19
|
2
|
264.5
|
9.5
|
Chromis notata
|
|
G1 (GDA)
|
2
|
210
|
4
|
1
|
105
|
2
|
Chromis notata
|
|
G2 (GDA)
|
3
|
775
|
19
|
1.5
|
387.5
|
9.5
|
Chromis notata
|
|
R1
(CLA)
|
5
|
1152
|
20
|
2.5
|
576
|
10
|
Chromis notata
|
|
R2
(CLA)
|
4
|
1130
|
32
|
2
|
565
|
16
|
Chromis notata
|
|
Overall total
|
8
|
5052
|
120
|
4
|
2526
|
60
|
Chromis notata
|
6.2
Commercial Value of Adult Fish Resources
 According the method used in EIA
Report for Expansion
of Hong Kong Airport into a Three-Runway System (AAHK 2012) and
Provision of Consultancy Services for Updated Fisheries Survey for Tseung Kwan O Desalination Plant Final Report (ERM 2017), commercial value of adult
fish resources was estimated based on Fish Marketing Organisations (FMO) wholesaleprice
in 2018 and subsequently ranked into three classes
including: High (> 70 HK$/ kg); Medium (60 - 70 HK$/ kg); and Low (< 60 HK$/ kg) (1). Top ten species
of commercial importance are
According the method used in EIA
Report for Expansion
of Hong Kong Airport into a Three-Runway System (AAHK 2012) and
Provision of Consultancy Services for Updated Fisheries Survey for Tseung Kwan O Desalination Plant Final Report (ERM 2017), commercial value of adult
fish resources was estimated based on Fish Marketing Organisations (FMO) wholesaleprice
in 2018 and subsequently ranked into three classes
including: High (> 70 HK$/ kg); Medium (60 - 70 HK$/ kg); and Low (< 60 HK$/ kg) (1). Top ten species
of commercial importance are
summarized in Table 6-3.
 Among
the 9 fish species recorded, 7 species are classified as commercial species,
which accounted for about 91.1% of
the total biomass and 90.1% of the total abundance from thecaptured adult fish
species. Most of these commercial species are of medium to low commercial value
(95% of total abundance). However,
high commercial value fishes showed only 3.1%
in terms of total biomass. The dominant species in terms of abundance were
Pearl-spot chromis (Chromis notata) which accounting for 71.1% of
total abundance. In terms of
abundance, most of the adult fish resources in the Study Area are of low to no commercial value, accounting for
> 80% of total abundance of
overall adult fish resources. However, in term of biomass, most of the adult
fish resources in the Study Area are also of low to no commercial value,
accounting for > 75% of total biomass of overall adult fish resources.
Among
the 9 fish species recorded, 7 species are classified as commercial species,
which accounted for about 91.1% of
the total biomass and 90.1% of the total abundance from thecaptured adult fish
species. Most of these commercial species are of medium to low commercial value
(95% of total abundance). However,
high commercial value fishes showed only 3.1%
in terms of total biomass. The dominant species in terms of abundance were
Pearl-spot chromis (Chromis notata) which accounting for 71.1% of
total abundance. In terms of
abundance, most of the adult fish resources in the Study Area are of low to no commercial value, accounting for
> 80% of total abundance of
overall adult fish resources. However, in term of biomass, most of the adult
fish resources in the Study Area are also of low to no commercial value,
accounting for > 75% of total biomass of overall adult fish resources.
Table 6-3: Species
Recorded with Commercial Value in the Study Area
|
Family
|
Species
|
Level of Commercial
Value*
|
Biomass
(g)
|
% of Total Biomass
(Rank)
|
Abundance
|
% of Total Abundance
(Rank)
|
|
Pomacentridae
|
Chromis notata
|
L
|
4431
|
70.1% (1)
|
128
|
79.5% (1)
|
|
Serranidae
|
Cephalopholis boenak
|
H
|
688
|
10.9% (2)
|
8
|
5.0%
(2)
|
|
Scorpaenidae
|
Sebastiscus marmoratus
|
L
|
365
|
5.8%
(3)
|
6
|
3.7% (3)
|
|
Monacanthidae
|
Monacanthus chinensis
|
M
|
299
|
4.7%
(4)
|
5
|
3.1%
(4)
|
|
Siganidae
|
Siganus canaliculatus
|
L
|
235
|
3.7%
(5)
|
4
|
2.5% (7)
|
|
Sparidae
|
Evynnis cardinalis
|
L
|
168
|
2.7%
(6)
|
5
|
3.1% (4)
|
|
Apogonidae
|
Apogon
cathetogramma
|
L
|
135
|
2.1%
(7)
|
5
|
3.1% (4)
|
|
*Notes: H = High
(> 70 HK$/
kg; M = Medium (60 70 HK$/ kg);
L = Low (< 60 HK$/ kg);
|
(1)
Three classes of wholesale prices were defined under ERM 2017 to
indicate the commercial value of the fish resources. With reference to the Fish
Marketing Organization Annual Report 2016 / 2017 (https://www.fmo.org.hk/download?path=15_58&id=15), there has been an increasing trend of wholesale
prices over the years. As such, the ranges of wholesale prices established under ERM 2017 have been adjusted under this Studyto reflect
the increases in the market prices over the years.
6.3
Catch per Unit
Effort
 The following
equation is adopted to calculate
Catch per Unit Effort (CPUE):
The following
equation is adopted to calculate
Catch per Unit Effort (CPUE):
CPUE = No.of individual of fish
Fishing time (hour) x (Number of net and cage)
,
where
Fishing time = 1 hour; Number of net = 2; Number of cage = 8.
 The CPUE was variable
with locations, mean CPUE of each monitoring location rangedbetween
The CPUE was variable
with locations, mean CPUE of each monitoring location rangedbetween
0.2 and 1.44 no. hour-1 cage&net-1 (Table 6-4).
Table 6-4: Mean Catch per Unit Effort of Adult Fish Resources at each Monitoring Location
|
Monitoring location
|
Mean CPUE (no. hour-1
cage&net-1
± SD)
|
|
P1 (IPA)
|
1.2
|
|
P2 (IPA)
|
0.75
|
|
G1 (GDA)
|
0.2
|
|
G2 (GDA)
|
0.78
|
|
R1 (CLA)
|
0.84
|
|
R2 (CLA)
|
1.44
|
|
Overall total
|
5.19
|
*SD will be calculated in the final
report after wet season monitoring
6.4
Yield per Unit Effort
 The following equation is adopted to calculate
Yield per Unit Effort (YPUE):
The following equation is adopted to calculate
Yield per Unit Effort (YPUE):
YPUE = biomass (g) of fish
Fishing time (hour) x (Number of net and cage)
,
where
Fishing time = 1 hour; Number of net = 2; Number of cage = 8.
 The YPUE was variable
with locations, the mean YPUE of each monitoring location
ranged between 9.03 g and
221.94 g no. hour-1 cage&net-1 (Table
6-5). The YPUE at locations P1
and P2 (i.e. the Impact Area) were moderate amongst all the locations.
The YPUE was variable
with locations, the mean YPUE of each monitoring location
ranged between 9.03 g and
221.94 g no. hour-1 cage&net-1 (Table
6-5). The YPUE at locations P1
and P2 (i.e. the Impact Area) were moderate amongst all the locations.
Table 6-5: Mean Yield per Unit Effort of Adult Fish Resources at each Monitoring Location
|
Monitoring location
|
Mean YPUE (g hour-1
cage&net-1
± SD)
|
|
P1 (IPA)
|
52.88
|
|
P2 (IPA)
|
25.50
|
|
G1 (GDA)
|
9.03
|
|
G2 (GDA)
|
35.44
|
|
R1 (CLA)
|
45.13
|
|
R2 (CLA)
|
53.97
|
|
Overall total
|
221.94
|
6.5
Species Composition
6.5.1
The
abundant and biomass of fish species recorded in the Study Area are listed in Table 6-7 and
Table 6-8, with percentages of total abundance
and biomass listed
in descending order. In CLA (i.e. Locations R1 and/ or R2), the
percentage of total abundance was
dominated by fish family Pomacentridae
(Chromis notata); while biomass was also dominated by fish family
Pomacentridae (Chromis notata).
6.5.2
In GDA, only few species were captured, the most abundant
species was pearl-spot chromis Chromis
notata over 81% biomass at G1). In IPA, the most abundant
and highest biomass
species was also the
family Pomacentridae (Chromis notata); (>76% in P1). In dry season, the species composition at
different locations were generally variable. (Table 6-7 and 6-8)
Table 6-7: Abundance data of Adult Fish Species Recorded Dry Season in the Study Area
|
Dry season
|
|
Location
|
Family
|
Species
|
Commercial value
|
Mean Abundance
|
Mean % Abundance
|
|
P1
|
Pomacentridae
|
Chromis notata
|
L
|
14.5
|
76.32
|
|
|
Labridae
|
Halichoeres nigrescens
|
X
|
2.5
|
13.16
|
|
|
Siganidae
|
Siganus canaliculatus
|
L
|
2
|
10.53
|
|
P2
|
Pomacentridae
|
Chromis notata
|
L
|
7
|
58.33
|
|
|
Tetraodontidae
|
Takifugu poecilonotus
|
X
|
2.5
|
20.83
|
|
|
Apogonidae
|
Apogon cathetogramma
|
L
|
1.5
|
12.5
|
|
|
Monacanthidae
|
Monacanthus chinensis
|
M
|
1
|
8.33
|
|
G1
|
Pomacentridae
|
Chromis notata
|
L
|
2
|
66.67
|
|
|
Serranidae
|
Cephalopholis boenak
|
H
|
1
|
33.33
|
|
G2
|
Pomacentridae
|
Chromis notata
|
L
|
10.5
|
84
|
|
|
Tetraodontidae
|
Takifugu poecilonotus
|
X
|
1.5
|
12
|
|
|
Serranidae
|
Cephalopholis boenak
|
H
|
0.5
|
4
|
|
R1
|
Pomacentridae
|
Chromis notata
|
L
|
7.5
|
55.56
|
|
|
Scorpaenidae
|
Sebastiscus marmoratus
|
L
|
3
|
22.22
|
|
|
Monacanthidae
|
Monacanthus chinensis
|
M
|
1.5
|
11.11
|
|
|
Tetraodontidae
|
Takifugu poecilonotus
|
X
|
1
|
7.41
|
|
|
Serranidae
|
Cephalopholis boenak
|
H
|
0.5
|
3.7
|
|
R2
|
Pomacentridae
|
Chromis notata
|
L
|
17.5
|
76.1
|
|
|
Sparidae
|
Evynnis cardinalis
|
L
|
2.5
|
10.9
|
|
|
Serranidae
|
Cephalopholis boenak
|
H
|
2
|
8.7
|
|
|
Tetraodontidae
|
Takifugu poecilonotus
|
M
|
1
|
4.3
|
Note: L- Low; M Medium; H High; X No commercial value
Table
6-8: Biomass data of Adult Fish Species Recorded in Dry Season in the Study Area
|
Dry season
|
|
Location
|
Family
|
Species
|
Commercial value
|
Mean
Biomass (g)
|
Mean % Biomass
|
|
P1
|
Pomacentridae
|
Chromis
notata
|
L
|
579.5
|
68.5
|
|
|
Labridae
|
Halichoeres nigrescens
|
X
|
149
|
17.61
|
|
|
Siganidae
|
Siganus canaliculatus
|
L
|
117.5
|
13.89
|
|
P2
|
Pomacentridae
|
Chromis
notata
|
L
|
179.5
|
44
|
|
|
Apogonidae
|
Apogon cathetogramma
|
L
|
99
|
24.26
|
|
|
Tetraodontidae
|
Takifugu
poecilonotus
|
X
|
67.5
|
16.54
|
|
|
Monacanthidae
|
Monacanthus chinensis
|
M
|
62
|
15.2
|
|
G1
|
Pomacentridae
|
Chromis notata
|
L
|
77
|
53.3
|
|
|
Serranidae
|
Cephalopholis boenak
|
H
|
67.5
|
46.7
|
|
G2
|
Pomacentridae
|
Chromis
notata
|
L
|
382.5
|
67.5
|
|
|
Tetraodontidae
|
Takifugu
poecilonotus
|
X
|
117
|
20.6
|
|
|
Serranidae
|
Cephalopholis boenak
|
H
|
67.5
|
11.9
|
|
R1
|
Pomacentridae
|
Chromis
notata
|
L
|
313.5
|
43.4
|
|
|
Scorpaenidae
|
Sebastiscus marmoratus
|
L
|
182.5
|
25.3
|
|
|
Monacanthidae
|
Monacanthus chinensis
|
M
|
87.5
|
12.1
|
|
|
Tetraodontidae
|
Takifugu
poecilonotus
|
X
|
78.5
|
10.9
|
|
|
Serranidae
|
Cephalopholis boenak
|
H
|
60
|
8.3
|
|
R2
|
Pomacentridae
|
Chromis
notata
|
L
|
563
|
65.2
|
|
|
Serranidae
|
Cephalopholis boenak
|
H
|
149
|
17.3
|
|
|
Sparidae
|
Evynnis
cardinalis
|
L
|
84
|
9.7
|
|
|
Tetraodontidae
|
Takifugu
poecilonotus
|
M
|
67.5
|
7.8
|
Note: L- Low; M Medium; H High; X No commercial value
7
Juvenile Fish Survey Results
7.1
Overall Juvenile Fish Resources
 For
juvenile fish survey using purse-seining, a total
of 975.2g of 610 individuals comprising 1 species was recorded. The only species
recorded in terms of biomass and
abundance was mullet Mugil sp.,
which is of low commercial value.
For
juvenile fish survey using purse-seining, a total
of 975.2g of 610 individuals comprising 1 species was recorded. The only species
recorded in terms of biomass and
abundance was mullet Mugil sp.,
which is of low commercial value.
 The overall juvenile
fish resources in the Study Area are summarized in Table 7-1. LocationR1 had the highest biomass
and number of juvenile fish
resources, contributed by only
singlegenus Mugil sp.
The size of this dominant
species ranged from 3.7 to 5.1 cm (total length).
The overall juvenile
fish resources in the Study Area are summarized in Table 7-1. LocationR1 had the highest biomass
and number of juvenile fish
resources, contributed by only
singlegenus Mugil sp.
The size of this dominant
species ranged from 3.7 to 5.1 cm (total length).
Table 7-1: Overall Juvenile
Fish Resources in the Study Area during
Dry Season Monitoring
|
Monitoring location
|
Total no. of species
|
Total biomass (g)
|
Total no. of
individual
|
Mean no. of species (±SD)
|
Mean
biomass (g ± SD)
|
Mean no. of individual
(± SD)
|
Dominant
species
|
|
P1 (IPA)
|
1
|
68.9
|
135
|
0.5
|
34.45
|
67.5
|
Mugil sp.
|
|
P2 (IPA)
|
1
|
365.4
|
203
|
0.5
|
182.7
|
101.5
|
Mugil sp.
|
|
G1 (GDA)
|
--
|
--
|
--
|
--
|
--
|
--
|
--
|
|
G2 (GDA)
|
1
|
125.6
|
59
|
0.5
|
62.8
|
29.5
|
Mugil sp.
|
|
R1 (CLA)
|
1
|
415.3
|
213
|
0.5
|
207.65
|
106.5
|
Mugil sp.
|
|
R2 (CLA)
|
--
|
--
|
--
|
--
|
--
|
--
|
--
|
|
Overall total
|
1
|
975.2
|
610
|
0.5
|
487.6
|
305
|
Mugil sp.
|
*SD
will be calculated in the final
report after wet season monitoring
7.2
Commercial Value
 The
commercial value of juvenile fish is also estimated using the same approach for
adult fish resources as described in Section 6.2.
The only species recorded in the Study Area
was of low commercial value (Appendix C).
The
commercial value of juvenile fish is also estimated using the same approach for
adult fish resources as described in Section 6.2.
The only species recorded in the Study Area
was of low commercial value (Appendix C).
7.3
Catch per Unit
Effort
 The following
equation is adopted to calculate
Catch per Unit Effort (CPUE):
The following
equation is adopted to calculate
Catch per Unit Effort (CPUE):
Fishing time = 15 minutes = 0.25 hour; Number of net = 2
 The mean CPUE of each monitoring location
ranged between 14.75 and 53.25 no. hour-1 net-1 (Table 7-2). Locations P2 (i.e. Impact
Area, IPA) had the lowest
CPUE amongst all thelocations.
The mean CPUE of each monitoring location
ranged between 14.75 and 53.25 no. hour-1 net-1 (Table 7-2). Locations P2 (i.e. Impact
Area, IPA) had the lowest
CPUE amongst all thelocations.
Table 7-2: Mean Catch per Unit Effort of Juvenile Fish Resources at each Monitoring
Location
|
Monitoring location
|
Mean CPUE (no. hour-1 net-1 ± SD)
|
|
P1 (IPA)
|
33.75
|
|
P2 (IPA)
|
50.75
|
|
G1 (GDA)
|
0
|
|
G2 (GDA)
|
14.75
|
|
R1 (CLA)
|
53.25
|
|
R2 (CLA)
|
0
|
|
Overall total
|
152.5
|
*SD
will be calculated in the final
report after wet season monitoring
7.4
Yield per Unit Effort
 The following
equation is adopted to calculate
Yield per Unit Effort (YPUE):
The following
equation is adopted to calculate
Yield per Unit Effort (YPUE):
YPUE = Biomass (g)of
fish
Fishing time (hour)x (Number of net)
,
where
Fishing time = 15 mintues = 0.25 hour; Number of net = 2.
 The
mean YPUE of each sampling location ranged between 17.23 and 103.83
g hour-1 net-1 (Table7-3). Locations P2 (i.e. Impact Area,
IPA) had the lowest YPUE amongst all the
locations.
The
mean YPUE of each sampling location ranged between 17.23 and 103.83
g hour-1 net-1 (Table7-3). Locations P2 (i.e. Impact Area,
IPA) had the lowest YPUE amongst all the
locations.
Table 7-3: Mean Yield per Unit Effort of Juvenile Fish Resources at each Monitoring Location
|
Monitoring Location
|
Mean YPUE (g hour-1
net-1 ± SD)
|
|
P1 (IPA)
|
17.23
|
|
P2 (IPA)
|
91.35
|
|
G1 (GDA)
|
0
|
|
G2 (GDA)
|
31.40
|
|
R1 (CLA)
|
103.83
|
|
R2 (CLA)
|
0
|
|
Overall total
|
243.80
|
*SD
will be calculated in the final report
after wet season
monitoring
7.5
Species Composition
7.5.1 Amongst all the locations,
mullet Mugil sp.,
was the only one species recorded in the Study Area.
8
Ichthyoplankton Survey
Results
8.1
Overall Ichthyoplankton Assemblages
 In
the ichthyoplankton survey, a total of 7 species from 7 families (including
both fish eggand fish larvae) were recorded in the Study Area, comprising 3
fish egg species from 3 families, and 4 fish larvae species from 4 families. The
dominant species of fish egg
and fishlarvae were Threadfin porgy Evynnis cardinalis and
Marbled rockfish Sebastiscus marmoratus, respectively,
accounting for 63.76 % of total density
in egg and 44.64 % of total
density fish larvae. These dominantspecies are considered of medium to high
commercial value. The overall ichthyoplankton collected in the Study Area is summarized in Table 8-1. Full list of ichthyoplankton is presented in Appendix D.
In
the ichthyoplankton survey, a total of 7 species from 7 families (including
both fish eggand fish larvae) were recorded in the Study Area, comprising 3
fish egg species from 3 families, and 4 fish larvae species from 4 families. The
dominant species of fish egg
and fishlarvae were Threadfin porgy Evynnis cardinalis and
Marbled rockfish Sebastiscus marmoratus, respectively,
accounting for 63.76 % of total density
in egg and 44.64 % of total
density fish larvae. These dominantspecies are considered of medium to high
commercial value. The overall ichthyoplankton collected in the Study Area is summarized in Table 8-1. Full list of ichthyoplankton is presented in Appendix D.
Table 8-1: Overall Ichthyoplankton Assemblages in the Study Area during Dry Season Monitoring
|
Monitoring location
|
Total
no. of species
|
Total density (no./ 1000 m3)
|
Mean no. of
species (± SD)
|
Mean density (no./ 1000 m3
±
SD)
|
Dominant species
|
|
Fish Egg
|
|
T1 (IPA)
|
1
|
35.24
|
0.5
|
17.62
|
Evynnis cardinalis
|
|
T2 (IPA)
|
0
|
0
|
0
|
0
|
-
|
|
T3 (CLA)
|
2
|
40.48
|
1
|
20.24
|
Mullidae sp.
|
|
T4 (CLA)
|
1
|
12.54
|
0.5
|
6.27
|
Evynnis cardinalis
|
|
T5 (GDA)
|
1
|
23.45
|
0.5
|
11.725
|
Evynnis cardinalis
|
|
T6 (GDA)
|
0
|
0
|
0
|
0
|
-
|
|
Overall total
|
3
|
111.71
|
1.5
|
55.855
|
Evynnis cardinalis
|
|
Fish Larvae
|
|
T1 (IPA)
|
2
|
31.86
|
1
|
15.93
|
Sebastiscus marmoratus
|
|
T2 (IPA)
|
0
|
0
|
0
|
0
|
-
|
|
T3 (CLA)
|
0
|
0
|
0
|
0
|
-
|
|
T4 (CLA)
|
1
|
9.21
|
0.5
|
4.605
|
Sebastiscus marmoratus
|
|
T5 (GDA)
|
0
|
0
|
0
|
0
|
-
|
|
T6 (GDA)
|
1
|
15.65
|
0.5
|
7.825
|
-
|
|
Overall total
|
4
|
56.72
|
2
|
28.36
|
Sebastiscus marmoratus
|
*SD
will be calculated in the final report
after wet season
monitoring
8.2
Species Composition of Ichthyoplankton Assemblages
Fish Egg Composition
8.2.1 The most abundant fish egg species
recorded in the Study Area are listed in Table 8-2, with percentages of total density listed in descending order.
The species composition at all locations were generally variable.
8.2.2 In
dry season, the species composition of fish egg was more variable with
locations/ areas. IPA (Site T1)
was dominated by Evynnis
cardinalis. CLA
(Site T3 and T4) was dominated by Evynnis cardinalis. While
no fish egg was
recorded in site T2 and T6.
Fish Larvae Composition
8.2.3 The
most abundant fish larvae species recorded in the Study Area are listed in Table 8-3, with percentages of total density
listed in descending order. The species composition at all locations were
generally variable.
8.2.4 In
dry season, at all locations, the percentage of total density of fish larvae
was dominated bycommon rockfish Sebastiscus marmoratus, which was of
high commercial value, contributingto 44.64 % total fish larvae density at the survey area (Table 8-4).
Table 8-2: Most Dominant
Fish Egg Species Recorded at the six Sampling Locations
in Dry Season
|
Dry season
|
|
Location
|
Family
|
Species
|
Commercial value
|
Mean Density (no. per 1000 m3)
|
Mean % Density
|
|
T1
|
Sparidae
|
Evynnis cardinalis
|
M
|
35.24
|
100.00%
|
|
T2
|
-
|
-
|
-
|
-
|
-
|
|
T3
|
Mullidae
|
Mullidae sp.
|
M
|
29.23
|
81.64%
|
|
|
Soleidae
|
Soleidae sp.
|
M
|
11.25
|
18.36%
|
|
T4
|
Sparidae
|
Evynnis cardinalis
|
M
|
12.54
|
100.00%
|
|
T5
|
Sparidae
|
Evynnis
cardinalis
|
M
|
23.45
|
100.00%
|
|
T6
|
-
|
-
|
-
|
-
|
-
|
Note: L- Low; M Medium; H High; X No commercial value
Table 8-3: Most Dominant
Fish Larvae Species Recorded at the six Sampling Locations
in Dry Season
|
Dry season
|
|
Location
|
Family
|
Species
|
Commercial value
|
Mean Density (no. per 1000 m3)
|
Mean % Density
|
|
T1
|
Scorpaenidae
|
Sebastiscus marmoratus
|
H
|
25.32
|
79.47%
|
|
|
Sillaginidae
|
Sillago sihama
|
M
|
6.54
|
20.53%
|
|
T2
|
-
|
-
|
-
|
-
|
-
|
|
T3
|
-
|
-
|
-
|
-
|
-
|
|
T4
|
Monacanthidae
|
Monacanthus chinensis
|
H
|
9.21
|
100.00%
|
|
T5
|
-
|
-
|
-
|
-
|
-
|
|
T6
|
Platycephalidae
|
Inegocia japonica
|
M
|
15.65
|
100.00%
|
Note: L- Low; M Medium; H High; X No commercial value
9
Supplementary Water Quality Monitoring Results
9.1 The statistical summary of the water quality
monitoring parameters during dry are tabulated in
Table 11.1. The detailed in-situ and laboratory measurement result are shown in Appendix E.
9.2 The measured
water temperature values ranged from about
20.83 °C to about 22.61
°C in dry season. No absolute Water Quality Objective (WQO) on marine
water temperature is available. Seasonal variation of water temperatures was
recorded from the monitoring as expected.
9.3 The sea is a
large pH buffering system with high capacity
to resist changes in pH. The pH
of seawater is normally very stable. Localized changes of pH in seawater
may occur due to industrial discharge or episodic
event such as algal bloom. All the pH values are within the normal natural range in seawater
and complied with the relevant WQO of
7.99 to 9.50 in both dry. No seasonal trend of pH is observed.
9.4 Dissolved oxygen (DO) is
essential to fish and an important health indicator of the marine ecosystem. Higher water temperature would tend to decrease the solubility of DO in seawater.
The measured DO levels are generally lower in wet season as compared to the values measured
in dry season but all the measured DO values are considered high. The
depth-averaged DO and bottom DO values measured during the dry season are all
over 7 mg/L. Thus, the DO levels are good in both dry.
9.5 Unlike the north western
water of Hong Kong, which is subject to strong seasonal influence from the
freshwater discharges from Pearl River Delta with high suspended solids (SS) content,
the monitoring stations
of this Study are located
in the eastern water of Hong
Kong with muchmore stable salinity
and lower SS contents. No absolute SS and turbidity objectives in marinewater
are available. The average SS and turbidity levels are below 5 mg/L and 7 NTU with
highest measured values of about 10 mg/L and 2.68 NTU respectively. No obvious
seasonal variation of SS and turbidity levels can be identified.
9.6 The average salinity levels measured during the dry season
are higher than 32 ppt,which indicated that the water is purely oceanic
water with no significant freshwater dilution during the monitoring periods. No
seasonal variation of salinity levels can be identified fromthe monitoring
results.
9.7 All the measured iron
(Fe) and total residual chlorine (TRC) values were non-detected. No indication
of industrial or trade effluent discharge is identified in the Study Area.
Water
Supplies Department
CE8/2015 First Stage of Desalination Plant at TKO Operation
Phase Fisheries Monitoring
Table 11.1 Statistical Summary
of Water Quality
Parameters (Dry Season)
|
Location
|
Water
Depth
(m)
|
Temperatur e(°C)
|
pH
|
Dissolved
Oxygen (mg/L)
|
Bottom Dissolved Oxygen (mg/L)
|
Turbidit y (NTU)
|
Salinit y (ppt)
|
Suspended
Solid (mg/L)
|
Iron (mg/L
)
|
Total Residual Chlorine
(mg/L)
|
|
P1
|
4.44
(1 9)
|
26.15
(25.80-26.70)
|
8.03
(7.88-8.17)
|
8.65
(8.32-9.09)
|
8.65
(8.29-9.02)
|
2.40
(2.21-2.62)
|
32.31
(31.68-32.71)
|
3.46
(<2.50-
10.00)
|
<0.1
(<0.1)
|
<0.1
(<0.1)
|
|
P2
|
4.73
(1.00-8.80)
|
25.85
(25.50-26.40)
|
8.05
(7.96-8.15)
|
8.91
(8.57-9.17)
|
8.97
(8.57-9.11)
|
2.74
(2.64-2.88)
|
32.02
(31.59-32.46)
|
3.02
(<2.50-6.00)
|
<0.1
(<0.1)
|
<0.1
(<0.1)
|
|
G1
|
9.96
(1-23.7)
|
26.31
(25.9-26.6)
|
8.04
(7.91-8.16)
|
8.49
(8.40-8.57)
|
8.47
(8.40-8.53)
|
2.68
(2.25-2.89)
|
32.64
(31.99-33.37)
|
2.98
(<2.50-4.00)
|
<0.1
(<0.1)
|
<0.1
(<0.1)
|
|
G2
|
9.00
(1-20.4)
|
26.08
(25.7-26.4)
|
8.03
(7.93-8.11)
|
8.50
(8.17-8.92)
|
8.50
(8.17-8.92)
|
2.46
(2.18-3.05)
|
32.36
(31.49-33.13)
|
2.98
(<2.50-7.00)
|
<0.1
(<0.1)
|
<0.1
(<0.1)
|
|
R1
|
4.41
(1-8.5)
|
26.05
(25.8-26.3)
|
8.04
(7.94-8.13)
|
8.43
(8.08-8.90)
|
8.43
(8.10-8.90)
|
2.59
(2.32-2.85)
|
32.56
(31.90-33.19)
|
3.06
(<2.50-6.00)
|
<0.1
(<0.1)
|
<0.1
(<0.1)
|
|
R2
|
4.64
(1-8.59)
|
26.05
(25.8-26.6)
|
8.00
(7.90-8.10)
|
8.79
(7.79-9.50)
|
8.40
(7.84-9.41)
|
2.20
(1.95-2.63)
|
32.00
(31.14-32.89)
|
3.44
(<2.50-3.00)
|
<0.1
(<0.1)
|
<0.1
(<0.1)
|
|
CE
|
11.28
(1-23.4)
|
25.98
(25.3-26.2)
|
7.98
(7.86-8.06)
|
8.41
(8.02-8.81)
|
8.43
(8.02-8.79)
|
2.96
(2.65-3.27)
|
32.25
(31.96-32.45)
|
3.06
(<2.50-6.00)
|
<0.1
(<0.1)
|
<0.1
(<0.1)
|
|
CF
|
9.99
(1-19.6)
|
26.10
(25.8-26.4)
|
7.99
(7.84-8.16)
|
8.56
(7.87-9.31)
|
8.57
(7.94-9.28)
|
2.82
(2.48-3.22)
|
32.41
(31.98-32.86)
|
3.44
(<2.50-3.00)
|
<0.1
(<0.1)
|
<0.1
(<0.1)
|
|
WSR01
|
4.48
(1-8.5)
|
25.88
(25.5-26.4)
|
7.98
(7.89-8.05)
|
8.74
(7.86-9.37)
|
8.74
(7.9-9.36)
|
2.40
(2.21-2.64)
|
32.42
(31.82-33.08)
|
3.06
(<2.50-6.00)
|
<0.1
(<0.1)
|
<0.1
(<0.1)
|
|
WSR02
|
4.61
(1-8.3)
|
25.95
(25.6-26.7)
|
8.03
(7.91-8.14)
|
8.41
(7.91-8.88)
|
8.48
(7.92-8.88)
|
2.51
(2.17-2.88)
|
32.35
(31.71-33.01)
|
3.44
(<2.50-3.00)
|
<0.1
(<0.1)
|
<0.1
(<0.1)
|
|
WSR03
|
3.95
(1-7.1)
|
25.98
(25.60-26.30)
|
7.98
(7.9-8.05)
|
8.38
(7.81-8.76)
|
8.38
(7.87-8.76)
|
2.37
(2.08-2.70)
|
32.55
(32.12-33.02)
|
3.06
(<2.50-6.00)
|
<0.1
(<0.1)
|
<0.1
(<0.1)
|
|
WSR04
|
3.49
(1-6.3)
|
26.00
(25.4-26.5)
|
8.03
(7.96-8.10)
|
8.40
(7.84-9.39)
|
8.39
(7.87-9.31)
|
2.48
(2.08-2.89)
|
32.25
(31.89-32.77)
|
3.44
(<2.50-3.00)
|
<0.1
(<0.1)
|
<0.1
(<0.1)
|
|
WSR16
|
8.21
(1-16.0)
|
25.88
(25.5-26.2)
|
7.99
(7.89-8.13)
|
8.76
(8.32-9.17)
|
8.76
(8.38-9.14)
|
2.47
(2.24-2.74)
|
32.53
(21.18-33.01)
|
3.06
(<2.50-6.00)
|
<0.1
(<0.1)
|
<0.1
(<0.1)
|
|
WSR33
|
3.68
(1-6.7)
|
26.18
(26-26.5)
|
7.99
(7.86-8.16)
|
8.50
(7.93-9.55)
|
8.50
(7.94-9.50)
|
2.57
(2.13-2.87)
|
32.24
(31.85-32.88)
|
3.44
(<2.50-3.00)
|
<0.1
(<0.1)
|
<0.1
(<0.1)
|
|
WSR36
|
3.50
(1-6.5)
|
26.03
(25.3-26.7)
|
7.99
(7.9-8.1)
|
8.47
(7.99-9.22)
|
8.43
(7.99-9.17)
|
2.49
(2.12-2.75)
|
32.58
(31.92-33.48)
|
3.06
(<2.50-6.00)
|
<0.1
(<0.1)
|
<0.1
(<0.1)
|
|
WSR37
|
4.04
(1-7.5)
|
26.13
(25.90-26.50)
|
8.10
(7.86-8.22)
|
8.54
(8.26-8.96)
|
8.52
(8.26-8.93)
|
2.61
(2.49-2.74)
|
32.25
(31.94-32.68)
|
3.44
(<2.50-3.00)
|
<0.1
(<0.1)
|
<0.1
(<0.1)
|
|
NF1
|
6.79
(1-12.9)
|
26.03
(25.7-26.6)
|
8.02
(7.96-8.10)
|
8.35
(8.05-8.76)
|
8.33
(8.05-8.76)
|
2.56
(2.11-2.92)
|
32.32
(31.68-33.12)
|
3.06
(<2.50-6.00)
|
<0.1
(<0.1)
|
<0.1
(<0.1)
|
|
NF2
|
5.33
(1-9.9)
|
26.23
(26-26.5)
|
7.99
(7.85-8.12)
|
8.73
(8.19-9.28)
|
8.72
(8.19-9.26)
|
2.75
(2.52-2.97)
|
32.00
(31.14-32.89)
|
3.44
(<2.50-3.00)
|
<0.1
(<0.1)
|
<0.1
(<0.1)
|
|
NF3
|
6.01
(1-11.3)
|
25.93
(25.3-26.3)
|
8.01
(7.89-8.12)
|
8.61
(9.30-8.97)
|
8.58
(8.33-8.95)
|
2.46
(2.16-2.66)
|
32.48
(31.96-33.09)
|
3.44
(<2.50-3.00)
|
<0.1
(<0.1)
|
<0.1
(<0.1)
|
Note: All data are averaged depth-averaged results except for the bottom
dissolved oxygen which was measured
at the bottom water layer only. Data in brackets
indicate the ranges.
10
Conclusions
10.1 Operation
fisheries monitoring works for the Project including adult fish, juvenile fish,
ichthyoplankton and supplementary water quality surveys
were completed in February 2026.
10.2 For
adult fish survey using cage trapping and gill netting, a total 7102 g of 166
individuals comprising 9 fish species
from 9 families was recorded. The dominant species in
terms of biomass and abundance were Pearl-spot chromis (Chromis notata),
and this species are of low commercial value. Within the Study Area, majority
of commercial species recorded are of low commercial value with some species of
medium to high commercial values also recorded. The overall commercial value of adult fish resources in the
Study Area is low to moderate.
10.3 For
juvenile fish survey, a total of 975.2g of 610 individuals comprising 1 species
from 1 families was recorded. The dominant species
in terms of biomass and abundance was Mugil sp.,
which is of low commercial value.
The juvenile fish resources in the Study Area is considered to be
of very low diversity and production level.
10.4 In
the ichthyoplankton survey, a total
of 7 species from 7 families (including both fish eggand fish larvae) were recorded in the Study
Area, comprising 3 fish egg species from 3 families, and 4 fish larvae species from
4 families. The mean larvae density
and total larvaefamily under the current Study are on the low side
compared with the results reported in other areas of Hong Kong. The dominant species of fish egg and fish
larvae were Evynnis cardinalis and Marbled rockfish Sebastiscus
marmoratus, respectively. These dominant species are considered of medium to high commercial value.
10.5 The supplementary water quality monitoring showed that the dissolved oxygen (key water quality parameter for fish) and pH
in the Study Area fully complied with
the relevant water quality objectives. The suspended solids and turbidity in the Study
Area were in generally low. Iron and total residual chlorine
were not detected
in the Study Area with no indication of industrial or
trade effluent discharge. Overall, the water quality was good in terms of the monitoring parameters.
10.6 Overall, the survey
findings showed that the abundance and diversity of fish eggs and larvaeare on the low
side for the Study Area, and the abundance and diversity of juveniles are
verylow for the Study Area. Survey
findings also showed that there was a very week relationshipin recorded
families between ichthyoplankton assemblages, adult fish and juvenile fish in
theStudy Area, which implies that the Study
Area does not appear to be an important spawning or nursery
grounds for commercial fishes.
45
11
References
11.1
Airport
Authority Hong Kong (2013) Expansion
of Hong Kong International Airport
into a Three-Runway System.
Environmental Impact Assessment Report.
11.2
Castle Peak Power Company Limited (2006).
Liquefied Natural Gas (LNG) Receiving Terminal and Associated Facilities. Environmental Impact Assessment Report.
11.3
ERM-Hong Kong Limited (ERM) (2017)
Consultancy Services for Updated Fisheries Survey for Tseung Kwan O
Desalination Plant. Final Report.
11.4
Fok MSM (2008) Baseline Survey of Fish
Juvenile Assemblages in Tolo Harbour and Channel, Hong Kong. MPhil Thesis. The University of Hong Kong.
11.5
Situ Y (2007) Ichthyoplankton assemblages
at Cape d Aguilar: seasonal variability and family composition. MPhil Thesis. The University of Hong Kong.
46 May 2024
APPENDIX E
IN-SITU WATER QUALITY
MEASUREMENT DATA
|
Location
|
Date
|
Weather
|
Sea Condition
|
Tide
|
Water Level
|
Depth (m)
|
Time
|
DO (mg/L)
|
pH
|
Sal (ppt)
|
Temp ((°C)
|
Turbidty (NTU)
|
SS
(mg/L)
|
Iron (mg/L)
|
Total Residual Chlorine (mg/L)
|
|
G1
|
7/02/2026
|
Sunny
|
Moderate
|
Mid-Flood
|
Surface
|
1
|
9:46:00
AM
|
8.52
|
7.95
|
32.40
|
26.60
|
2.89
|
<2.5
|
<0.1
|
<0.01
|
|
G1
|
7/02/2026
|
Sunny
|
Moderate
|
Mid-Flood
|
Surface
|
1
|
9:46:00 AM
|
8.47
|
7.95
|
32.34
|
26.60
|
2.87
|
<2.5
|
<0.1
|
<0.01
|
|
G1
|
7/02/2026
|
Sunny
|
Moderate
|
Mid-Flood
|
Middle
|
11
|
9:45:00
AM
|
8.50
|
7.95
|
32.43
|
26.60
|
2.81
|
<2.5
|
<0.1
|
<0.01
|
|
G1
|
7/02/2026
|
Sunny
|
Moderate
|
Mid-Flood
|
Middle
|
11
|
9:45:00 AM
|
8.54
|
7.95
|
32.36
|
26.60
|
2.79
|
3.00
|
<0.1
|
<0.01
|
|
G1
|
7/02/2026
|
Sunny
|
Moderate
|
Mid-Flood
|
Bottom
|
21
|
9:44:00
AM
|
8.53
|
7.95
|
32.34
|
26.60
|
2.89
|
<2.5
|
<0.1
|
<0.01
|
|
G1
|
7/02/2026
|
Sunny
|
Moderate
|
Mid-Flood
|
Bottom
|
21
|
9:44:00 AM
|
8.46
|
7.95
|
32.31
|
26.60
|
2.82
|
<2.5
|
<0.1
|
<0.01
|
|
G2
|
7/02/2026
|
Sunny
|
Moderate
|
Mid-Flood
|
Surface
|
1
|
10:10:00
AM
|
8.61
|
7.97
|
32.48
|
26.30
|
3.05
|
3.00
|
<0.1
|
<0.01
|
|
G2
|
7/02/2026
|
Sunny
|
Moderate
|
Mid-Flood
|
Surface
|
1
|
10:10:00 AM
|
8.65
|
7.97
|
32.42
|
26.30
|
3.04
|
3.00
|
<0.1
|
<0.01
|
|
G2
|
7/02/2026
|
Sunny
|
Moderate
|
Mid-Flood
|
Middle
|
10
|
10:09:00
AM
|
8.60
|
7.97
|
32.54
|
26.30
|
2.96
|
<2.5
|
<0.1
|
<0.01
|
|
G2
|
7/02/2026
|
Sunny
|
Moderate
|
Mid-Flood
|
Middle
|
10
|
10:09:00 AM
|
8.66
|
7.97
|
32.58
|
26.30
|
3.02
|
3.00
|
<0.1
|
<0.01
|
|
G2
|
7/02/2026
|
Sunny
|
Moderate
|
Mid-Flood
|
Bottom
|
19
|
10:08:00
AM
|
8.61
|
7.97
|
32.57
|
26.30
|
2.95
|
8.00
|
<0.1
|
<0.01
|
|
G2
|
7/02/2026
|
Sunny
|
Moderate
|
Mid-Flood
|
Bottom
|
19
|
10:08:00 AM
|
8.70
|
7.97
|
32.47
|
26.30
|
3.04
|
5.00
|
<0.1
|
<0.01
|
|
P1
|
7/02/2026
|
Sunny
|
Moderate
|
Mid-Flood
|
Surface
|
1
|
10:27:00
AM
|
8.32
|
7.88
|
32.61
|
26.70
|
2.49
|
3.00
|
<0.1
|
<0.01
|
|
P1
|
7/02/2026
|
Sunny
|
Moderate
|
Mid-Flood
|
Surface
|
1
|
10:27:00 AM
|
8.31
|
7.88
|
32.63
|
26.70
|
2.45
|
<2.5
|
<0.1
|
<0.01
|
|
P1
|
7/02/2026
|
Sunny
|
Moderate
|
Mid-Flood
|
Middle
|
5
|
10:26:00
AM
|
8.35
|
7.88
|
32.71
|
26.70
|
2.47
|
<2.5
|
<0.1
|
<0.01
|
|
P1
|
7/02/2026
|
Sunny
|
Moderate
|
Mid-Flood
|
Middle
|
5
|
10:26:00 AM
|
8.24
|
7.88
|
32.64
|
26.70
|
2.41
|
<2.5
|
<0.1
|
<0.01
|
|
P1
|
7/02/2026
|
Sunny
|
Moderate
|
Mid-Flood
|
Bottom
|
8
|
10:25:00
AM
|
8.32
|
7.88
|
32.67
|
26.70
|
2.47
|
<2.5
|
<0.1
|
<0.01
|
|
P1
|
7/02/2026
|
Sunny
|
Moderate
|
Mid-Flood
|
Bottom
|
8
|
10:25:00 AM
|
8.29
|
7.88
|
32.69
|
26.70
|
2.42
|
3.00
|
<0.1
|
<0.01
|
|
P2
|
7/02/2026
|
Sunny
|
Moderate
|
Mid-Flood
|
Surface
|
1
|
10:53:00
AM
|
8.85
|
7.96
|
32.42
|
26.40
|
2.82
|
<2.5
|
<0.1
|
<0.01
|
|
P2
|
7/02/2026
|
Sunny
|
Moderate
|
Mid-Flood
|
Surface
|
1
|
10:53:00 AM
|
8.79
|
7.96
|
32.32
|
26.40
|
2.80
|
<2.5
|
<0.1
|
<0.01
|
|
P2
|
7/02/2026
|
Sunny
|
Moderate
|
Mid-Flood
|
Middle
|
5
|
10:52:00
AM
|
8.82
|
7.96
|
32.46
|
26.40
|
2.77
|
3.00
|
<0.1
|
<0.01
|
|
P2
|
7/02/2026
|
Sunny
|
Moderate
|
Mid-Flood
|
Middle
|
5
|
10:52:00 AM
|
8.84
|
7.96
|
32.41
|
26.40
|
2.83
|
3.00
|
<0.1
|
<0.01
|
|
P2
|
7/02/2026
|
Sunny
|
Moderate
|
Mid-Flood
|
Bottom
|
8
|
10:51:00
AM
|
8.85
|
7.96
|
32.34
|
26.40
|
2.84
|
<2.5
|
<0.1
|
<0.01
|
|
P2
|
7/02/2026
|
Sunny
|
Moderate
|
Mid-Flood
|
Bottom
|
8
|
10:51:00 AM
|
8.84
|
7.96
|
32.33
|
26.40
|
2.88
|
<2.5
|
<0.1
|
<0.01
|
|
R1
|
7/02/2026
|
Sunny
|
Moderate
|
Mid-Flood
|
Surface
|
1
|
8:55:00
AM
|
8.24
|
7.94
|
32.52
|
26.10
|
2.49
|
<2.5
|
<0.1
|
<0.01
|
|
R1
|
7/02/2026
|
Sunny
|
Moderate
|
Mid-Flood
|
Surface
|
1
|
8:55:00 AM
|
8.23
|
7.94
|
32.46
|
26.10
|
2.53
|
<2.5
|
<0.1
|
<0.01
|
|
R1
|
7/02/2026
|
Sunny
|
Moderate
|
Mid-Flood
|
Middle
|
5
|
8:54:00
AM
|
8.23
|
7.94
|
32.52
|
26.10
|
2.41
|
<2.5
|
<0.1
|
<0.01
|
|
R1
|
7/02/2026
|
Sunny
|
Moderate
|
Mid-Flood
|
Middle
|
5
|
8:54:00 AM
|
8.18
|
7.94
|
32.46
|
26.10
|
2.42
|
<2.5
|
<0.1
|
<0.01
|
|
R1
|
7/02/2026
|
Sunny
|
Moderate
|
Mid-Flood
|
Bottom
|
9
|
8:53:00
AM
|
8.19
|
7.94
|
32.61
|
26.10
|
2.49
|
<2.5
|
<0.1
|
<0.01
|
|
R1
|
7/02/2026
|
Sunny
|
Moderate
|
Mid-Flood
|
Bottom
|
9
|
8:53:00 AM
|
8.19
|
7.94
|
32.51
|
26.10
|
2.50
|
<2.5
|
<0.1
|
<0.01
|
|
R2
|
7/02/2026
|
Sunny
|
Moderate
|
Mid-Flood
|
Surface
|
1
|
9:21:00
AM
|
8.72
|
7.92
|
33.09
|
26.60
|
2.55
|
<2.5
|
<0.1
|
<0.01
|
|
R2
|
7/02/2026
|
Sunny
|
Moderate
|
Mid-Flood
|
Surface
|
1
|
9:21:00 AM
|
8.74
|
7.92
|
33.07
|
26.60
|
2.60
|
<2.5
|
<0.1
|
<0.01
|
|
R2
|
7/02/2026
|
Sunny
|
Moderate
|
Mid-Flood
|
Middle
|
5
|
9:20:00
AM
|
8.73
|
7.92
|
32.98
|
26.60
|
2.69
|
<2.5
|
<0.1
|
<0.01
|
|
R2
|
7/02/2026
|
Sunny
|
Moderate
|
Mid-Flood
|
Middle
|
5
|
9:20:00 AM
|
8.71
|
7.92
|
33.06
|
26.60
|
2.67
|
<2.5
|
<0.1
|
<0.01
|
|
R2
|
7/02/2026
|
Sunny
|
Moderate
|
Mid-Flood
|
Bottom
|
8
|
9:19:00
AM
|
8.71
|
7.92
|
32.99
|
26.60
|
2.64
|
<2.5
|
<0.1
|
<0.01
|
|
R2
|
7/02/2026
|
Sunny
|
Moderate
|
Mid-Flood
|
Bottom
|
8
|
9:19:00 AM
|
8.67
|
7.92
|
33.13
|
26.60
|
2.57
|
<2.5
|
<0.1
|
<0.01
|
|
CE
|
7/02/2026
|
Sunny
|
Moderate
|
Mid-Flood
|
Surface
|
1
|
11:29:00
AM
|
8.71
|
7.86
|
32.19
|
26.20
|
2.91
|
4.00
|
<0.1
|
<0.01
|
|
CE
|
7/02/2026
|
Sunny
|
Moderate
|
Mid-Flood
|
Surface
|
1
|
11:29:00 AM
|
8.81
|
7.86
|
32.31
|
26.20
|
2.96
|
<2.5
|
<0.1
|
<0.01
|
|
CE
|
7/02/2026
|
Sunny
|
Moderate
|
Mid-Flood
|
Middle
|
11
|
11:28:00
AM
|
8.74
|
7.86
|
32.18
|
26.20
|
3.04
|
<2.5
|
<0.1
|
<0.01
|
|
CE
|
7/02/2026
|
Sunny
|
Moderate
|
Mid-Flood
|
Middle
|
11
|
11:28:00 AM
|
8.72
|
7.86
|
32.20
|
26.20
|
3.05
|
<2.5
|
<0.1
|
<0.01
|
|
CE
|
7/02/2026
|
Sunny
|
Moderate
|
Mid-Flood
|
Bottom
|
21
|
11:27:00
AM
|
8.79
|
7.86
|
32.21
|
26.20
|
3.11
|
<2.5
|
<0.1
|
<0.01
|
|
CE
|
7/02/2026
|
Sunny
|
Moderate
|
Mid-Flood
|
Bottom
|
21
|
11:27:00 AM
|
8.79
|
7.86
|
32.32
|
26.20
|
3.19
|
3.00
|
<0.1
|
<0.01
|
|
CF
|
7/02/2026
|
Sunny
|
Moderate
|
Mid-Flood
|
Surface
|
1
|
8:41:00
AM
|
8.37
|
7.84
|
32.26
|
26.00
|
2.90
|
3.00
|
<0.1
|
<0.01
|
|
CF
|
7/02/2026
|
Sunny
|
Moderate
|
Mid-Flood
|
Surface
|
1
|
8:41:00 AM
|
8.33
|
7.84
|
32.17
|
26.00
|
2.93
|
<2.5
|
<0.1
|
<0.01
|
|
CF
|
7/02/2026
|
Sunny
|
Moderate
|
Mid-Flood
|
Middle
|
10
|
8:40:00
AM
|
8.29
|
7.84
|
32.19
|
26.00
|
3.11
|
<2.5
|
<0.1
|
<0.01
|
|
CF
|
7/02/2026
|
Sunny
|
Moderate
|
Mid-Flood
|
Middle
|
10
|
8:40:00 AM
|
8.38
|
7.84
|
32.20
|
26.00
|
3.07
|
<2.5
|
<0.1
|
<0.01
|
|
CF
|
7/02/2026
|
Sunny
|
Moderate
|
Mid-Flood
|
Bottom
|
20
|
8:39:00
AM
|
8.34
|
7.84
|
32.19
|
26.00
|
3.19
|
<2.5
|
<0.1
|
<0.01
|
|
CF
|
7/02/2026
|
Sunny
|
Moderate
|
Mid-Flood
|
Bottom
|
20
|
8:39:00 AM
|
8.32
|
7.84
|
32.28
|
26.00
|
3.22
|
3.00
|
<0.1
|
<0.01
|
|
WSR01
|
7/02/2026
|
Sunny
|
Moderate
|
Mid-Flood
|
Surface
|
1
|
9:03:00
AM
|
8.72
|
7.96
|
32.41
|
26.40
|
2.48
|
<2.5
|
<0.1
|
<0.01
|
|
WSR01
|
7/02/2026
|
Sunny
|
Moderate
|
Mid-Flood
|
Surface
|
1
|
9:03:00 AM
|
8.74
|
7.96
|
32.27
|
26.40
|
2.41
|
<2.5
|
<0.1
|
<0.01
|
|
WSR01
|
7/02/2026
|
Sunny
|
Moderate
|
Mid-Flood
|
Middle
|
4
|
9:02:00
AM
|
8.66
|
7.96
|
32.43
|
26.40
|
2.42
|
<2.5
|
<0.1
|
<0.01
|
|
WSR01
|
7/02/2026
|
Sunny
|
Moderate
|
Mid-Flood
|
Middle
|
4
|
9:02:00 AM
|
8.72
|
7.96
|
32.28
|
26.40
|
2.50
|
<2.5
|
<0.1
|
<0.01
|
|
WSR01
|
7/02/2026
|
Sunny
|
Moderate
|
Mid-Flood
|
Bottom
|
8
|
9:01:00
AM
|
8.71
|
7.96
|
32.30
|
26.40
|
2.44
|
<2.5
|
<0.1
|
<0.01
|
|
WSR01
|
7/02/2026
|
Sunny
|
Moderate
|
Mid-Flood
|
Bottom
|
8
|
9:01:00 AM
|
8.65
|
7.96
|
32.32
|
26.40
|
2.47
|
<2.5
|
<0.1
|
<0.01
|
|
WSR02
|
7/02/2026
|
Sunny
|
Moderate
|
Mid-Flood
|
Surface
|
1
|
9:20:00
AM
|
7.99
|
7.89
|
32.58
|
26.70
|
2.33
|
<2.5
|
<0.1
|
<0.01
|
|
WSR02
|
7/02/2026
|
Sunny
|
Moderate
|
Mid-Flood
|
Surface
|
1
|
9:20:00 AM
|
7.99
|
7.89
|
32.62
|
26.70
|
2.27
|
<2.5
|
<0.1
|
<0.01
|
|
WSR02
|
7/02/2026
|
Sunny
|
Moderate
|
Mid-Flood
|
Middle
|
5
|
9:19:00
AM
|
7.91
|
7.89
|
32.51
|
26.70
|
2.32
|
<2.5
|
<0.1
|
<0.01
|
|
WSR02
|
7/02/2026
|
Sunny
|
Moderate
|
Mid-Flood
|
Middle
|
5
|
9:19:00 AM
|
7.96
|
7.89
|
32.49
|
26.70
|
2.38
|
3.00
|
<0.1
|
<0.01
|
|
WSR02
|
7/02/2026
|
Sunny
|
Moderate
|
Mid-Flood
|
Bottom
|
8
|
9:18:00
AM
|
7.92
|
7.89
|
32.63
|
26.70
|
2.31
|
<2.5
|
<0.1
|
<0.01
|
|
WSR02
|
7/02/2026
|
Sunny
|
Moderate
|
Mid-Flood
|
Bottom
|
8
|
9:18:00 AM
|
7.91
|
7.89
|
32.57
|
26.70
|
2.38
|
<2.5
|
<0.1
|
<0.01
|
|
WSR03
|
7/02/2026
|
Sunny
|
Moderate
|
Mid-Flood
|
Surface
|
1
|
9:33:00
AM
|
7.90
|
7.90
|
32.96
|
26.10
|
2.66
|
<2.5
|
<0.1
|
<0.01
|
|
WSR03
|
7/02/2026
|
Sunny
|
Moderate
|
Mid-Flood
|
Surface
|
1
|
9:33:00 AM
|
7.90
|
7.90
|
32.85
|
26.10
|
2.69
|
<2.5
|
<0.1
|
<0.01
|
|
WSR03
|
7/02/2026
|
Sunny
|
Moderate
|
Mid-Flood
|
Middle
|
4
|
9:32:00
AM
|
7.81
|
7.90
|
32.83
|
26.10
|
2.70
|
<2.5
|
<0.1
|
<0.01
|
|
WSR03
|
7/02/2026
|
Sunny
|
Moderate
|
Mid-Flood
|
Middle
|
4
|
9:32:00 AM
|
7.87
|
7.90
|
32.84
|
26.10
|
2.67
|
<2.5
|
<0.1
|
<0.01
|
|
WSR03
|
7/02/2026
|
Sunny
|
Moderate
|
Mid-Flood
|
Bottom
|
7
|
9:31:00
AM
|
7.90
|
7.90
|
32.92
|
26.10
|
2.62
|
<2.5
|
<0.1
|
<0.01
|
|
WSR03
|
7/02/2026
|
Sunny
|
Moderate
|
Mid-Flood
|
Bottom
|
7
|
9:31:00 AM
|
7.87
|
7.90
|
32.99
|
26.10
|
2.68
|
<2.5
|
<0.1
|
<0.01
|
|
WSR04
|
7/02/2026
|
Sunny
|
Moderate
|
Mid-Flood
|
Surface
|
1
|
9:46:00
AM
|
7.88
|
7.96
|
32.11
|
26.50
|
2.89
|
<2.5
|
<0.1
|
<0.01
|
|
WSR04
|
7/02/2026
|
Sunny
|
Moderate
|
Mid-Flood
|
Surface
|
1
|
9:46:00 AM
|
7.84
|
7.96
|
32.20
|
26.50
|
2.80
|
<2.5
|
<0.1
|
<0.01
|
|
WSR04
|
7/02/2026
|
Sunny
|
Moderate
|
Mid-Flood
|
Middle
|
3
|
9:45:00
AM
|
7.94
|
7.96
|
32.16
|
26.50
|
2.85
|
<2.5
|
<0.1
|
<0.01
|
|
WSR04
|
7/02/2026
|
Sunny
|
Moderate
|
Mid-Flood
|
Middle
|
3
|
9:45:00 AM
|
7.94
|
7.96
|
32.11
|
26.50
|
2.80
|
<2.5
|
<0.1
|
<0.01
|
|
WSR04
|
7/02/2026
|
Sunny
|
Moderate
|
Mid-Flood
|
Bottom
|
6
|
9:44:00
AM
|
7.90
|
7.96
|
32.13
|
26.50
|
2.82
|
3.00
|
<0.1
|
<0.01
|
|
WSR04
|
7/02/2026
|
Sunny
|
Moderate
|
Mid-Flood
|
Bottom
|
6
|
9:44:00 AM
|
7.95
|
7.96
|
32.16
|
26.50
|
2.79
|
<2.5
|
<0.1
|
<0.01
|
|
WSR16
|
7/02/2026
|
Sunny
|
Moderate
|
Mid-Flood
|
Surface
|
1
|
11:08:00
AM
|
8.41
|
7.89
|
32.31
|
26.20
|
2.69
|
<2.5
|
<0.1
|
<0.01
|
|
WSR16
|
7/02/2026
|
Sunny
|
Moderate
|
Mid-Flood
|
Surface
|
1
|
11:08:00 AM
|
8.35
|
7.89
|
32.35
|
26.20
|
2.66
|
<2.5
|
<0.1
|
<0.01
|
|
WSR16
|
7/02/2026
|
Sunny
|
Moderate
|
Mid-Flood
|
Middle
|
9
|
11:07:00
AM
|
8.43
|
7.89
|
32.29
|
26.20
|
2.64
|
<2.5
|
<0.1
|
<0.01
|
|
WSR16
|
7/02/2026
|
Sunny
|
Moderate
|
Mid-Flood
|
Middle
|
9
|
11:07:00 AM
|
8.38
|
7.89
|
32.37
|
26.20
|
2.71
|
<2.5
|
<0.1
|
<0.01
|
|
WSR16
|
7/02/2026
|
Sunny
|
Moderate
|
Mid-Flood
|
Bottom
|
16
|
11:06:00
AM
|
8.41
|
7.89
|
32.43
|
26.20
|
2.74
|
<2.5
|
<0.1
|
<0.01
|
|
WSR16
|
7/02/2026
|
Sunny
|
Moderate
|
Mid-Flood
|
Bottom
|
16
|
11:06:00 AM
|
8.38
|
7.89
|
32.41
|
26.20
|
2.66
|
3.00
|
<0.1
|
<0.01
|
|
WSR33
|
7/02/2026
|
Sunny
|
Moderate
|
Mid-Flood
|
Surface
|
1
|
10:02:00
AM
|
8.15
|
7.86
|
31.89
|
25.90
|
2.80
|
<2.5
|
<0.1
|
<0.01
|
|
WSR33
|
7/02/2026
|
Sunny
|
Moderate
|
Mid-Flood
|
Surface
|
1
|
10:02:00 AM
|
8.17
|
7.86
|
31.89
|
25.90
|
2.77
|
3.00
|
<0.1
|
<0.01
|
|
WSR33
|
7/02/2026
|
Sunny
|
Moderate
|
Mid-Flood
|
Middle
|
4
|
10:01:00
AM
|
8.13
|
7.86
|
31.93
|
25.90
|
2.73
|
<2.5
|
<0.1
|
<0.01
|
|
WSR33
|
7/02/2026
|
Sunny
|
Moderate
|
Mid-Flood
|
Middle
|
4
|
10:01:00 AM
|
8.09
|
7.86
|
31.85
|
25.90
|
2.72
|
<2.5
|
<0.1
|
<0.01
|
|
WSR33
|
7/02/2026
|
Sunny
|
Moderate
|
Mid-Flood
|
Bottom
|
7
|
10:00:00
AM
|
8.15
|
7.86
|
31.99
|
25.90
|
2.74
|
4.00
|
<0.1
|
<0.01
|
|
WSR33
|
7/02/2026
|
Sunny
|
Moderate
|
Mid-Flood
|
Bottom
|
7
|
10:00:00 AM
|
8.14
|
7.86
|
31.98
|
25.90
|
2.76
|
8.00
|
<0.1
|
<0.01
|
|
WSR36
|
7/02/2026
|
Sunny
|
Moderate
|
Mid-Flood
|
Surface
|
1
|
10:16:00
AM
|
8.12
|
7.93
|
32.86
|
26.70
|
2.46
|
<2.5
|
<0.1
|
<0.01
|
|
WSR36
|
7/02/2026
|
Sunny
|
Moderate
|
Mid-Flood
|
Surface
|
1
|
10:16:00 AM
|
8.14
|
7.93
|
32.86
|
26.70
|
2.50
|
<2.5
|
<0.1
|
<0.01
|
|
WSR36
|
7/02/2026
|
Sunny
|
Moderate
|
Mid-Flood
|
Middle
|
4
|
10:15:00
AM
|
8.12
|
7.93
|
32.90
|
26.70
|
2.46
|
<2.5
|
<0.1
|
<0.01
|
|
WSR36
|
7/02/2026
|
Sunny
|
Moderate
|
Mid-Flood
|
Middle
|
4
|
10:15:00 AM
|
8.11
|
7.93
|
32.89
|
26.70
|
2.44
|
<2.5
|
<0.1
|
<0.01
|
|
WSR36
|
7/02/2026
|
Sunny
|
Moderate
|
Mid-Flood
|
Bottom
|
7
|
10:14:00
AM
|
8.05
|
7.93
|
32.93
|
26.70
|
2.45
|
<2.5
|
<0.1
|
<0.01
|
|
WSR36
|
7/02/2026
|
Sunny
|
Moderate
|
Mid-Flood
|
Bottom
|
7
|
10:14:00 AM
|
8.06
|
7.93
|
32.92
|
26.70
|
2.49
|
<2.5
|
<0.1
|
<0.01
|
|
WSR37
|
7/02/2026
|
Sunny
|
Moderate
|
Mid-Flood
|
Surface
|
1
|
10:31:00
AM
|
8.36
|
7.86
|
32.11
|
25.90
|
2.59
|
<2.5
|
<0.1
|
<0.01
|
|
WSR37
|
7/02/2026
|
Sunny
|
Moderate
|
Mid-Flood
|
Surface
|
1
|
10:31:00 AM
|
8.32
|
7.86
|
32.14
|
25.90
|
2.55
|
<2.5
|
<0.1
|
<0.01
|
|
WSR37
|
7/02/2026
|
Sunny
|
Moderate
|
Mid-Flood
|
Middle
|
4
|
10:30:00
AM
|
8.34
|
7.86
|
32.11
|
25.90
|
2.62
|
<2.5
|
<0.1
|
<0.01
|
|
WSR37
|
7/02/2026
|
Sunny
|
Moderate
|
Mid-Flood
|
Middle
|
4
|
10:30:00 AM
|
8.32
|
7.86
|
32.04
|
25.90
|
2.64
|
<2.5
|
<0.1
|
<0.01
|
|
WSR37
|
7/02/2026
|
Sunny
|
Moderate
|
Mid-Flood
|
Bottom
|
7
|
10:29:00
AM
|
8.34
|
7.86
|
32.19
|
25.90
|
2.57
|
<2.5
|
<0.1
|
<0.01
|
|
WSR37
|
7/02/2026
|
Sunny
|
Moderate
|
Mid-Flood
|
Bottom
|
7
|
10:29:00 AM
|
8.28
|
7.86
|
32.08
|
25.90
|
2.58
|
<2.5
|
<0.1
|
<0.01
|
|
NF1
|
7/02/2026
|
Sunny
|
Moderate
|
Mid-Flood
|
Surface
|
1
|
10:56:00
AM
|
8.12
|
7.96
|
33.03
|
26.60
|
2.92
|
<2.5
|
<0.1
|
<0.01
|
|
NF1
|
7/02/2026
|
Sunny
|
Moderate
|
Mid-Flood
|
Surface
|
1
|
10:56:00 AM
|
8.06
|
7.96
|
33.04
|
26.60
|
2.87
|
<2.5
|
<0.1
|
<0.01
|
|
NF1
|
7/02/2026
|
Sunny
|
Moderate
|
Mid-Flood
|
Middle
|
7
|
10:55:00
AM
|
8.10
|
7.96
|
33.12
|
26.60
|
2.84
|
5.00
|
<0.1
|
<0.01
|
|
NF1
|
7/02/2026
|
Sunny
|
Moderate
|
Mid-Flood
|
Middle
|
7
|
10:55:00 AM
|
8.14
|
7.96
|
33.10
|
26.60
|
2.92
|
7.00
|
<0.1
|
<0.01
|
|
NF1
|
7/02/2026
|
Sunny
|
Moderate
|
Mid-Flood
|
Bottom
|
12
|
10:54:00
AM
|
8.05
|
7.96
|
33.06
|
26.60
|
2.90
|
<2.5
|
<0.1
|
<0.01
|
|
NF1
|
7/02/2026
|
Sunny
|
Moderate
|
Mid-Flood
|
Bottom
|
12
|
10:54:00 AM
|
8.06
|
7.96
|
32.99
|
26.60
|
2.91
|
<2.5
|
<0.1
|
<0.01
|
|
NF2
|
7/02/2026
|
Sunny
|
Moderate
|
Mid-Flood
|
Surface
|
1
|
10:47:00
AM
|
8.60
|
7.85
|
32.71
|
26.50
|
2.85
|
5.00
|
<0.1
|
<0.01
|
|
NF2
|
7/02/2026
|
Sunny
|
Moderate
|
Mid-Flood
|
Surface
|
1
|
10:47:00 AM
|
8.59
|
7.85
|
32.75
|
26.50
|
2.92
|
8.00
|
<0.1
|
<0.01
|
|
NF2
|
7/02/2026
|
Sunny
|
Moderate
|
Mid-Flood
|
Middle
|
5
|
10:46:00
AM
|
8.69
|
7.85
|
32.66
|
26.50
|
2.84
|
<2.5
|
<0.1
|
<0.01
|
|
NF2
|
7/02/2026
|
Sunny
|
Moderate
|
Mid-Flood
|
Middle
|
5
|
10:46:00 AM
|
8.67
|
7.85
|
32.73
|
26.50
|
2.94
|
<2.5
|
<0.1
|
<0.01
|
|
NF2
|
7/02/2026
|
Sunny
|
Moderate
|
Mid-Flood
|
Bottom
|
10
|
10:45:00
AM
|
8.58
|
7.85
|
32.67
|
26.50
|
2.90
|
<2.5
|
<0.1
|
<0.01
|
|
NF2
|
7/02/2026
|
Sunny
|
Moderate
|
Mid-Flood
|
Bottom
|
10
|
10:45:00 AM
|
8.61
|
7.85
|
32.76
|
26.50
|
2.93
|
<2.5
|
<0.1
|
<0.01
|
|
NF3
|
7/02/2026
|
Sunny
|
Moderate
|
Mid-Flood
|
Surface
|
1
|
10:40:00
AM
|
8.47
|
7.89
|
32.65
|
25.90
|
2.51
|
<2.5
|
<0.1
|
<0.01
|
|
NF3
|
7/02/2026
|
Sunny
|
Moderate
|
Mid-Flood
|
Surface
|
1
|
10:40:00 AM
|
8.41
|
7.89
|
32.63
|
25.90
|
2.55
|
<2.5
|
<0.1
|
<0.01
|
|
NF3
|
7/02/2026
|
Sunny
|
Moderate
|
Mid-Flood
|
Middle
|
6
|
10:39:00
AM
|
8.47
|
7.89
|
32.57
|
25.90
|
2.66
|
<2.5
|
<0.1
|
<0.01
|
|
NF3
|
7/02/2026
|
Sunny
|
Moderate
|
Mid-Flood
|
Middle
|
6
|
10:39:00 AM
|
8.39
|
7.89
|
32.58
|
25.90
|
2.61
|
<2.5
|
<0.1
|
<0.01
|
|
NF3
|
7/02/2026
|
Sunny
|
Moderate
|
Mid-Flood
|
Bottom
|
11
|
10:38:00
AM
|
8.38
|
7.89
|
32.54
|
25.90
|
2.49
|
<2.5
|
<0.1
|
<0.01
|
|
NF3
|
7/02/2026
|
Sunny
|
Moderate
|
Mid-Flood
|
Bottom
|
11
|
10:38:00 AM
|
8.40
|
7.89
|
32.62
|
25.90
|
2.51
|
<2.5
|
<0.1
|
<0.01
|
|
Location
|
Date
|
Weather
|
Tide
|
Sea Condition
|
Water Level
|
Depth (m)
|
Time
|
DO (mg/L)
|
pH
|
Sal (ppt)
|
Temp ((°C)
|
Turbidty (NTU)
|
SS
(mg/L)
|
Iron (mg/L)
|
Total Residual Chlorine (mg/L)
|
|
G1
|
15/02/2026
|
Sunny
|
Moderate
|
Mid-Ebb
|
Surface
|
1
|
3:31:00
PM
|
8.56
|
8.16
|
32.04
|
26.10
|
2.37
|
<2.5
|
<0.1
|
<0.01
|
|
G1
|
15/02/2026
|
Sunny
|
Moderate
|
Mid-Ebb
|
Surface
|
1
|
3:31:00 PM
|
8.50
|
8.16
|
31.99
|
26.10
|
2.35
|
<2.5
|
<0.1
|
<0.01
|
|
G1
|
15/02/2026
|
Sunny
|
Moderate
|
Mid-Ebb
|
Middle
|
5
|
3:30:00
PM
|
8.57
|
8.16
|
32.05
|
26.10
|
2.30
|
3.00
|
<0.1
|
<0.01
|
|
G1
|
15/02/2026
|
Sunny
|
Moderate
|
Mid-Ebb
|
Middle
|
5
|
3:30:00 PM
|
8.57
|
8.16
|
32.03
|
26.10
|
2.25
|
<2.5
|
<0.1
|
<0.01
|
|
G1
|
15/02/2026
|
Sunny
|
Moderate
|
Mid-Ebb
|
Bottom
|
9
|
3:29:00
PM
|
8.49
|
8.16
|
32.04
|
26.10
|
2.25
|
<2.5
|
<0.1
|
<0.01
|
|
G1
|
15/02/2026
|
Sunny
|
Moderate
|
Mid-Ebb
|
Bottom
|
9
|
3:29:00 PM
|
8.48
|
8.16
|
31.99
|
26.10
|
2.38
|
<2.5
|
<0.1
|
<0.01
|
|
G2
|
15/02/2026
|
Sunny
|
Moderate
|
Mid-Ebb
|
Surface
|
1
|
3:49:00
PM
|
8.89
|
8.11
|
31.49
|
25.70
|
2.18
|
<2.5
|
<0.1
|
<0.01
|
|
G2
|
15/02/2026
|
Sunny
|
Moderate
|
Mid-Ebb
|
Surface
|
1
|
3:49:00 PM
|
8.92
|
8.11
|
31.51
|
25.70
|
2.29
|
<2.5
|
<0.1
|
<0.01
|
|
G2
|
15/02/2026
|
Sunny
|
Moderate
|
Mid-Ebb
|
Middle
|
5
|
3:48:00
PM
|
8.92
|
8.11
|
31.49
|
25.70
|
2.28
|
<2.5
|
<0.1
|
<0.01
|
|
G2
|
15/02/2026
|
Sunny
|
Moderate
|
Mid-Ebb
|
Middle
|
5
|
3:48:00 PM
|
8.83
|
8.11
|
31.52
|
25.70
|
2.24
|
<2.5
|
<0.1
|
<0.01
|
|
G2
|
15/02/2026
|
Sunny
|
Moderate
|
Mid-Ebb
|
Bottom
|
9
|
3:47:00
PM
|
8.92
|
8.11
|
31.53
|
25.70
|
2.18
|
<2.5
|
<0.1
|
<0.01
|
|
G2
|
15/02/2026
|
Sunny
|
Moderate
|
Mid-Ebb
|
Bottom
|
9
|
3:47:00 PM
|
8.86
|
8.11
|
31.51
|
25.70
|
2.34
|
<2.5
|
<0.1
|
<0.01
|
|
P1
|
15/02/2026
|
Sunny
|
Moderate
|
Mid-Ebb
|
Surface
|
1
|
4:05:00
PM
|
8.79
|
8.17
|
32.38
|
25.80
|
2.47
|
<2.5
|
<0.1
|
<0.01
|
|
P1
|
15/02/2026
|
Sunny
|
Moderate
|
Mid-Ebb
|
Surface
|
1
|
4:05:00 PM
|
8.78
|
8.17
|
32.37
|
25.80
|
2.46
|
<2.5
|
<0.1
|
<0.01
|
|
P1
|
15/02/2026
|
Sunny
|
Moderate
|
Mid-Ebb
|
Middle
|
4
|
4:04:00
PM
|
8.76
|
8.17
|
32.33
|
25.80
|
2.62
|
<2.5
|
<0.1
|
<0.01
|
|
P1
|
15/02/2026
|
Sunny
|
Moderate
|
Mid-Ebb
|
Middle
|
4
|
4:04:00 PM
|
8.78
|
8.17
|
32.36
|
25.80
|
2.52
|
<2.5
|
<0.1
|
<0.01
|
|
P1
|
15/02/2026
|
Sunny
|
Moderate
|
Mid-Ebb
|
Bottom
|
7
|
4:03:00
PM
|
8.77
|
8.17
|
32.34
|
25.80
|
2.49
|
<2.5
|
<0.1
|
<0.01
|
|
P1
|
15/02/2026
|
Sunny
|
Moderate
|
Mid-Ebb
|
Bottom
|
7
|
4:03:00 PM
|
8.77
|
8.17
|
32.32
|
25.80
|
2.45
|
<2.5
|
<0.1
|
<0.01
|
|
P2
|
15/02/2026
|
Sunny
|
Moderate
|
Mid-Ebb
|
Surface
|
1
|
4:22:00
PM
|
9.09
|
8.15
|
31.59
|
25.50
|
2.70
|
<2.5
|
<0.1
|
<0.01
|
|
P2
|
15/02/2026
|
Sunny
|
Moderate
|
Mid-Ebb
|
Surface
|
1
|
4:22:00 PM
|
9.05
|
8.15
|
31.63
|
25.50
|
2.75
|
3.00
|
<0.1
|
<0.01
|
|
P2
|
15/02/2026
|
Sunny
|
Moderate
|
Mid-Ebb
|
Middle
|
5
|
4:21:00
PM
|
9.16
|
8.15
|
31.61
|
25.50
|
2.67
|
4.00
|
<0.1
|
<0.01
|
|
P2
|
15/02/2026
|
Sunny
|
Moderate
|
Mid-Ebb
|
Middle
|
5
|
4:21:00 PM
|
9.13
|
8.15
|
31.60
|
25.50
|
2.69
|
<2.5
|
<0.1
|
<0.01
|
|
P2
|
15/02/2026
|
Sunny
|
Moderate
|
Mid-Ebb
|
Bottom
|
8
|
4:20:00
PM
|
9.07
|
8.15
|
31.61
|
25.50
|
2.69
|
<2.5
|
<0.1
|
<0.01
|
|
P2
|
15/02/2026
|
Sunny
|
Moderate
|
Mid-Ebb
|
Bottom
|
8
|
4:20:00 PM
|
9.05
|
8.15
|
31.60
|
25.50
|
2.64
|
4.00
|
<0.1
|
<0.01
|
|
R1
|
15/02/2026
|
Sunny
|
Moderate
|
Mid-Ebb
|
Surface
|
1
|
2:46:00
PM
|
8.89
|
8.13
|
32.62
|
26.00
|
2.74
|
<2.5
|
<0.1
|
<0.01
|
|
R1
|
15/02/2026
|
Sunny
|
Moderate
|
Mid-Ebb
|
Surface
|
1
|
2:46:00 PM
|
8.79
|
8.13
|
32.65
|
26.00
|
2.71
|
<2.5
|
<0.1
|
<0.01
|
|
R1
|
15/02/2026
|
Sunny
|
Moderate
|
Mid-Ebb
|
Middle
|
4
|
2:45:00
PM
|
8.79
|
8.13
|
32.64
|
26.00
|
2.66
|
<2.5
|
<0.1
|
<0.01
|
|
R1
|
15/02/2026
|
Sunny
|
Moderate
|
Mid-Ebb
|
Middle
|
4
|
2:45:00 PM
|
8.82
|
8.13
|
32.65
|
26.00
|
2.61
|
<2.5
|
<0.1
|
<0.01
|
|
R1
|
15/02/2026
|
Sunny
|
Moderate
|
Mid-Ebb
|
Bottom
|
7
|
2:44:00
PM
|
8.82
|
8.13
|
32.68
|
26.00
|
2.70
|
3.00
|
<0.1
|
<0.01
|
|
R1
|
15/02/2026
|
Sunny
|
Moderate
|
Mid-Ebb
|
Bottom
|
7
|
2:44:00 PM
|
8.90
|
8.13
|
32.61
|
26.00
|
2.68
|
<2.5
|
<0.1
|
<0.01
|
|
R2
|
15/02/2026
|
Sunny
|
Moderate
|
Mid-Ebb
|
Surface
|
1
|
3:08:00
PM
|
9.05
|
8.10
|
32.44
|
25.80
|
2.04
|
<2.5
|
<0.1
|
<0.01
|
|
R2
|
15/02/2026
|
Sunny
|
Moderate
|
Mid-Ebb
|
Surface
|
1
|
3:08:00 PM
|
9.04
|
8.10
|
32.45
|
25.80
|
2.10
|
<2.5
|
<0.1
|
<0.01
|
|
R2
|
15/02/2026
|
Sunny
|
Moderate
|
Mid-Ebb
|
Middle
|
5
|
3:07:00
PM
|
9.08
|
8.10
|
32.41
|
25.80
|
2.14
|
3.00
|
<0.1
|
<0.01
|
|
R2
|
15/02/2026
|
Sunny
|
Moderate
|
Mid-Ebb
|
Middle
|
5
|
3:07:00 PM
|
9.04
|
8.10
|
32.44
|
25.80
|
2.18
|
<2.5
|
<0.1
|
<0.01
|
|
R2
|
15/02/2026
|
Sunny
|
Moderate
|
Mid-Ebb
|
Bottom
|
8
|
3:06:00
PM
|
9.03
|
8.10
|
32.45
|
25.80
|
2.17
|
<2.5
|
<0.1
|
<0.01
|
|
R2
|
15/02/2026
|
Sunny
|
Moderate
|
Mid-Ebb
|
Bottom
|
8
|
3:06:00 PM
|
9.05
|
8.10
|
32.42
|
25.80
|
2.03
|
<2.5
|
<0.1
|
<0.01
|
|
CE
|
15/02/2026
|
Sunny
|
Moderate
|
Mid-Ebb
|
Surface
|
1
|
2:30:00
PM
|
8.53
|
8.04
|
31.99
|
25.30
|
2.68
|
<2.5
|
<0.1
|
<0.01
|
|
CE
|
15/02/2026
|
Sunny
|
Moderate
|
Mid-Ebb
|
Surface
|
1
|
2:30:00 PM
|
8.57
|
8.04
|
31.96
|
25.30
|
2.72
|
<2.5
|
<0.1
|
<0.01
|
|
CE
|
15/02/2026
|
Sunny
|
Moderate
|
Mid-Ebb
|
Middle
|
12
|
2:29:00
PM
|
8.50
|
8.04
|
31.96
|
25.30
|
2.97
|
<2.5
|
<0.1
|
<0.01
|
|
CE
|
15/02/2026
|
Sunny
|
Moderate
|
Mid-Ebb
|
Middle
|
12
|
2:29:00 PM
|
8.57
|
8.04
|
32.01
|
25.30
|
2.95
|
<2.5
|
<0.1
|
<0.01
|
|
CE
|
15/02/2026
|
Sunny
|
Moderate
|
Mid-Ebb
|
Bottom
|
23
|
2:28:00
PM
|
8.60
|
8.04
|
31.96
|
25.30
|
3.01
|
<2.5
|
<0.1
|
<0.01
|
|
CE
|
15/02/2026
|
Sunny
|
Moderate
|
Mid-Ebb
|
Bottom
|
23
|
2:28:00 PM
|
8.54
|
8.04
|
32.03
|
25.30
|
3.05
|
<2.5
|
<0.1
|
<0.01
|
|
CF
|
15/02/2026
|
Sunny
|
Moderate
|
Mid-Ebb
|
Surface
|
1
|
5:52:00
PM
|
9.31
|
8.16
|
32.02
|
25.80
|
2.54
|
<2.5
|
<0.1
|
<0.01
|
|
CF
|
15/02/2026
|
Sunny
|
Moderate
|
Mid-Ebb
|
Surface
|
1
|
5:52:00 PM
|
9.29
|
8.16
|
32.04
|
25.80
|
2.48
|
<2.5
|
<0.1
|
<0.01
|
|
CF
|
15/02/2026
|
Sunny
|
Moderate
|
Mid-Ebb
|
Middle
|
10
|
5:51:00
PM
|
9.31
|
8.16
|
32.00
|
25.80
|
2.65
|
<2.5
|
<0.1
|
<0.01
|
|
CF
|
15/02/2026
|
Sunny
|
Moderate
|
Mid-Ebb
|
Middle
|
10
|
5:51:00 PM
|
9.29
|
8.16
|
31.98
|
25.80
|
2.49
|
<2.5
|
<0.1
|
<0.01
|
|
CF
|
15/02/2026
|
Sunny
|
Moderate
|
Mid-Ebb
|
Bottom
|
19
|
5:50:00
PM
|
9.26
|
8.16
|
32.04
|
25.80
|
2.52
|
<2.5
|
<0.1
|
<0.01
|
|
CF
|
15/02/2026
|
Sunny
|
Moderate
|
Mid-Ebb
|
Bottom
|
19
|
5:50:00 PM
|
9.28
|
8.16
|
32.01
|
25.80
|
2.56
|
<2.5
|
<0.1
|
<0.01
|
|
WSR01
|
15/02/2026
|
Sunny
|
Moderate
|
Mid-Ebb
|
Surface
|
1
|
5:26:00
PM
|
9.07
|
8.05
|
31.85
|
25.50
|
2.59
|
<2.5
|
<0.1
|
<0.01
|
|
WSR01
|
15/02/2026
|
Sunny
|
Moderate
|
Mid-Ebb
|
Surface
|
1
|
5:26:00 PM
|
9.06
|
8.05
|
31.84
|
25.50
|
2.55
|
<2.5
|
<0.1
|
<0.01
|
|
WSR01
|
15/02/2026
|
Sunny
|
Moderate
|
Mid-Ebb
|
Middle
|
5
|
5:25:00
PM
|
9.01
|
8.05
|
31.82
|
25.50
|
2.64
|
<2.5
|
<0.1
|
<0.01
|
|
WSR01
|
15/02/2026
|
Sunny
|
Moderate
|
Mid-Ebb
|
Middle
|
5
|
5:25:00 PM
|
8.97
|
8.05
|
31.85
|
25.50
|
2.61
|
<2.5
|
<0.1
|
<0.01
|
|
WSR01
|
15/02/2026
|
Sunny
|
Moderate
|
Mid-Ebb
|
Bottom
|
9
|
5:24:00
PM
|
8.98
|
8.05
|
31.82
|
25.50
|
2.55
|
<2.5
|
<0.1
|
<0.01
|
|
WSR01
|
15/02/2026
|
Sunny
|
Moderate
|
Mid-Ebb
|
Bottom
|
9
|
5:24:00 PM
|
9.08
|
8.05
|
31.83
|
25.50
|
2.60
|
<2.5
|
<0.1
|
<0.01
|
|
WSR02
|
15/02/2026
|
Sunny
|
Moderate
|
Mid-Ebb
|
Surface
|
1
|
5:03:00
PM
|
8.83
|
8.09
|
31.73
|
25.70
|
2.57
|
<2.5
|
<0.1
|
<0.01
|
|
WSR02
|
15/02/2026
|
Sunny
|
Moderate
|
Mid-Ebb
|
Surface
|
1
|
5:03:00 PM
|
8.88
|
8.09
|
31.71
|
25.70
|
2.70
|
<2.5
|
<0.1
|
<0.01
|
|
WSR02
|
15/02/2026
|
Sunny
|
Moderate
|
Mid-Ebb
|
Middle
|
5
|
5:02:00
PM
|
8.79
|
8.09
|
31.76
|
25.70
|
2.69
|
<2.5
|
<0.1
|
<0.01
|
|
WSR02
|
15/02/2026
|
Sunny
|
Moderate
|
Mid-Ebb
|
Middle
|
5
|
5:02:00 PM
|
8.83
|
8.09
|
31.73
|
25.70
|
2.59
|
<2.5
|
<0.1
|
<0.01
|
|
WSR02
|
15/02/2026
|
Sunny
|
Moderate
|
Mid-Ebb
|
Bottom
|
8
|
5:01:00
PM
|
8.81
|
8.09
|
31.73
|
25.70
|
2.57
|
<2.5
|
<0.1
|
<0.01
|
|
WSR02
|
15/02/2026
|
Sunny
|
Moderate
|
Mid-Ebb
|
Bottom
|
8
|
5:01:00 PM
|
8.86
|
8.09
|
31.72
|
25.70
|
2.59
|
<2.5
|
<0.1
|
<0.01
|
|
WSR03
|
15/02/2026
|
Sunny
|
Moderate
|
Mid-Ebb
|
Surface
|
1
|
4:45:00
PM
|
8.56
|
8.05
|
32.13
|
25.60
|
2.17
|
<2.5
|
<0.1
|
<0.01
|
|
WSR03
|
15/02/2026
|
Sunny
|
Moderate
|
Mid-Ebb
|
Surface
|
1
|
4:45:00 PM
|
8.62
|
8.05
|
32.15
|
25.60
|
2.08
|
3.00
|
<0.1
|
<0.01
|
|
WSR03
|
15/02/2026
|
Sunny
|
Moderate
|
Mid-Ebb
|
Middle
|
4
|
4:44:00
PM
|
8.61
|
8.05
|
32.18
|
25.60
|
2.08
|
<2.5
|
<0.1
|
<0.01
|
|
WSR03
|
15/02/2026
|
Sunny
|
Moderate
|
Mid-Ebb
|
Middle
|
4
|
4:44:00 PM
|
8.59
|
8.05
|
32.13
|
25.60
|
2.10
|
<2.5
|
<0.1
|
<0.01
|
|
WSR03
|
15/02/2026
|
Sunny
|
Moderate
|
Mid-Ebb
|
Bottom
|
7
|
4:43:00
PM
|
8.56
|
8.05
|
32.16
|
25.60
|
2.08
|
<2.5
|
<0.1
|
<0.01
|
|
WSR03
|
15/02/2026
|
Sunny
|
Moderate
|
Mid-Ebb
|
Bottom
|
7
|
4:43:00 PM
|
8.67
|
8.05
|
32.14
|
25.60
|
2.11
|
<2.5
|
<0.1
|
<0.01
|
|
WSR04
|
15/02/2026
|
Sunny
|
Moderate
|
Mid-Ebb
|
Surface
|
1
|
4:31:00
PM
|
9.34
|
8.07
|
31.95
|
25.40
|
2.10
|
<2.5
|
<0.1
|
<0.01
|
|
WSR04
|
15/02/2026
|
Sunny
|
Moderate
|
Mid-Ebb
|
Surface
|
1
|
4:31:00 PM
|
9.28
|
8.07
|
31.94
|
25.40
|
2.19
|
<2.5
|
<0.1
|
<0.01
|
|
WSR04
|
15/02/2026
|
Sunny
|
Moderate
|
Mid-Ebb
|
Middle
|
4
|
4:30:00
PM
|
9.39
|
8.07
|
31.95
|
25.40
|
2.22
|
<2.5
|
<0.1
|
<0.01
|
|
WSR04
|
15/02/2026
|
Sunny
|
Moderate
|
Mid-Ebb
|
Middle
|
4
|
4:30:00 PM
|
9.28
|
8.07
|
31.95
|
25.40
|
2.08
|
<2.5
|
<0.1
|
<0.01
|
|
WSR04
|
15/02/2026
|
Sunny
|
Moderate
|
Mid-Ebb
|
Bottom
|
6
|
4:29:00
PM
|
9.30
|
8.07
|
31.89
|
25.40
|
2.26
|
3.00
|
<0.1
|
<0.01
|
|
WSR04
|
15/02/2026
|
Sunny
|
Moderate
|
Mid-Ebb
|
Bottom
|
6
|
4:29:00 PM
|
9.31
|
8.07
|
31.90
|
25.40
|
2.20
|
<2.5
|
<0.1
|
<0.01
|
|
WSR16
|
15/02/2026
|
Sunny
|
Moderate
|
Mid-Ebb
|
Surface
|
1
|
2:53:00
PM
|
9.10
|
8.13
|
32.19
|
25.50
|
2.54
|
<2.5
|
<0.1
|
<0.01
|
|
WSR16
|
15/02/2026
|
Sunny
|
Moderate
|
Mid-Ebb
|
Surface
|
1
|
2:53:00 PM
|
9.17
|
8.13
|
32.18
|
25.50
|
2.38
|
2.00
|
<0.1
|
<0.01
|
|
WSR16
|
15/02/2026
|
Sunny
|
Moderate
|
Mid-Ebb
|
Middle
|
8
|
2:52:00
PM
|
9.13
|
8.13
|
32.25
|
25.50
|
2.38
|
<2.5
|
<0.1
|
<0.01
|
|
WSR16
|
15/02/2026
|
Sunny
|
Moderate
|
Mid-Ebb
|
Middle
|
8
|
2:52:00 PM
|
9.09
|
8.13
|
32.24
|
25.50
|
2.54
|
<2.5
|
<0.1
|
<0.01
|
|
WSR16
|
15/02/2026
|
Sunny
|
Moderate
|
Mid-Ebb
|
Bottom
|
15
|
2:51:00
PM
|
9.09
|
8.13
|
32.24
|
25.50
|
2.47
|
<2.5
|
<0.1
|
<0.01
|
|
WSR16
|
15/02/2026
|
Sunny
|
Moderate
|
Mid-Ebb
|
Bottom
|
15
|
2:51:00 PM
|
9.13
|
8.13
|
32.24
|
25.50
|
2.49
|
<2.5
|
<0.1
|
<0.01
|
|
WSR33
|
15/02/2026
|
Sunny
|
Moderate
|
Mid-Ebb
|
Surface
|
1
|
4:14:00
PM
|
9.48
|
8.16
|
32.22
|
26.00
|
2.24
|
<2.5
|
<0.1
|
<0.01
|
|
WSR33
|
15/02/2026
|
Sunny
|
Moderate
|
Mid-Ebb
|
Surface
|
1
|
4:14:00 PM
|
9.53
|
8.16
|
32.21
|
26.00
|
2.17
|
<2.5
|
<0.1
|
<0.01
|
|
WSR33
|
15/02/2026
|
Sunny
|
Moderate
|
Mid-Ebb
|
Middle
|
4
|
4:13:00
PM
|
9.55
|
8.16
|
32.22
|
26.00
|
2.24
|
<2.5
|
<0.1
|
<0.01
|
|
WSR33
|
15/02/2026
|
Sunny
|
Moderate
|
Mid-Ebb
|
Middle
|
4
|
4:13:00 PM
|
9.45
|
8.16
|
32.24
|
26.00
|
2.13
|
<2.5
|
<0.1
|
<0.01
|
|
WSR33
|
15/02/2026
|
Sunny
|
Moderate
|
Mid-Ebb
|
Bottom
|
6
|
4:12:00
PM
|
9.50
|
8.16
|
32.21
|
26.00
|
2.17
|
<2.5
|
<0.1
|
<0.01
|
|
WSR33
|
15/02/2026
|
Sunny
|
Moderate
|
Mid-Ebb
|
Bottom
|
6
|
4:12:00 PM
|
9.49
|
8.16
|
32.21
|
26.00
|
2.16
|
<2.5
|
<0.1
|
<0.01
|
|
WSR36
|
15/02/2026
|
Sunny
|
Moderate
|
Mid-Ebb
|
Surface
|
1
|
4:00:00
PM
|
9.16
|
8.10
|
32.02
|
25.30
|
2.50
|
<2.5
|
<0.1
|
<0.01
|
|
WSR36
|
15/02/2026
|
Sunny
|
Moderate
|
Mid-Ebb
|
Surface
|
1
|
4:00:00 PM
|
9.22
|
8.10
|
31.98
|
25.30
|
2.62
|
<2.5
|
<0.1
|
<0.01
|
|
WSR36
|
15/02/2026
|
Sunny
|
Moderate
|
Mid-Ebb
|
Middle
|
3
|
3:59:00
PM
|
9.15
|
8.10
|
32.02
|
25.30
|
2.55
|
<2.5
|
<0.1
|
<0.01
|
|
WSR36
|
15/02/2026
|
Sunny
|
Moderate
|
Mid-Ebb
|
Middle
|
3
|
3:59:00 PM
|
9.16
|
8.10
|
32.00
|
25.30
|
2.54
|
<2.5
|
<0.1
|
<0.01
|
|
WSR36
|
15/02/2026
|
Sunny
|
Moderate
|
Mid-Ebb
|
Bottom
|
6
|
3:58:00
PM
|
9.14
|
8.10
|
32.02
|
25.30
|
2.60
|
<2.5
|
<0.1
|
<0.01
|
|
WSR36
|
15/02/2026
|
Sunny
|
Moderate
|
Mid-Ebb
|
Bottom
|
6
|
3:58:00 PM
|
9.17
|
8.10
|
31.98
|
25.30
|
2.61
|
<2.5
|
<0.1
|
<0.01
|
|
WSR37
|
15/02/2026
|
Sunny
|
Moderate
|
Mid-Ebb
|
Surface
|
1
|
3:50:00
PM
|
8.95
|
8.22
|
31.94
|
26.10
|
2.57
|
<2.5
|
<0.1
|
<0.01
|
|
WSR37
|
15/02/2026
|
Sunny
|
Moderate
|
Mid-Ebb
|
Surface
|
1
|
3:50:00 PM
|
8.96
|
8.22
|
32.01
|
26.10
|
2.68
|
<2.5
|
<0.1
|
<0.01
|
|
WSR37
|
15/02/2026
|
Sunny
|
Moderate
|
Mid-Ebb
|
Middle
|
4
|
3:49:00
PM
|
8.96
|
8.22
|
31.99
|
26.10
|
2.66
|
<2.5
|
<0.1
|
<0.01
|
|
WSR37
|
15/02/2026
|
Sunny
|
Moderate
|
Mid-Ebb
|
Middle
|
4
|
3:49:00 PM
|
8.96
|
8.22
|
31.98
|
26.10
|
2.65
|
<2.5
|
<0.1
|
<0.01
|
|
WSR37
|
15/02/2026
|
Sunny
|
Moderate
|
Mid-Ebb
|
Bottom
|
8
|
3:48:00
PM
|
8.88
|
8.22
|
31.94
|
26.10
|
2.70
|
<2.5
|
<0.1
|
<0.01
|
|
WSR37
|
15/02/2026
|
Sunny
|
Moderate
|
Mid-Ebb
|
Bottom
|
8
|
3:48:00 PM
|
8.93
|
8.22
|
31.95
|
26.10
|
2.65
|
<2.5
|
<0.1
|
<0.01
|
|
NF1
|
15/02/2026
|
Sunny
|
Moderate
|
Mid-Ebb
|
Surface
|
1
|
3:17:00
PM
|
8.70
|
8.06
|
31.73
|
25.80
|
2.43
|
<2.5
|
<0.1
|
<0.01
|
|
NF1
|
15/02/2026
|
Sunny
|
Moderate
|
Mid-Ebb
|
Surface
|
1
|
3:17:00 PM
|
8.71
|
8.06
|
31.73
|
25.80
|
2.53
|
<2.5
|
<0.1
|
<0.01
|
|
NF1
|
15/02/2026
|
Sunny
|
Moderate
|
Mid-Ebb
|
Middle
|
7
|
3:16:00
PM
|
8.66
|
8.06
|
31.72
|
25.80
|
2.39
|
<2.5
|
<0.1
|
<0.01
|
|
NF1
|
15/02/2026
|
Sunny
|
Moderate
|
Mid-Ebb
|
Middle
|
7
|
3:16:00 PM
|
8.74
|
8.06
|
31.73
|
25.80
|
2.37
|
3.00
|
<0.1
|
<0.01
|
|
NF1
|
15/02/2026
|
Sunny
|
Moderate
|
Mid-Ebb
|
Bottom
|
13
|
3:15:00
PM
|
8.66
|
8.06
|
31.71
|
25.80
|
2.47
|
<2.5
|
<0.1
|
<0.01
|
|
NF1
|
15/02/2026
|
Sunny
|
Moderate
|
Mid-Ebb
|
Bottom
|
13
|
3:15:00 PM
|
8.76
|
8.06
|
31.68
|
25.80
|
2.45
|
<2.5
|
<0.1
|
<0.01
|
|
NF2
|
15/02/2026
|
Sunny
|
Moderate
|
Mid-Ebb
|
Surface
|
1
|
3:35:00
PM
|
9.24
|
8.12
|
31.53
|
26.00
|
2.60
|
4.00
|
<0.1
|
<0.01
|
|
NF2
|
15/02/2026
|
Sunny
|
Moderate
|
Mid-Ebb
|
Surface
|
1
|
3:35:00 PM
|
9.28
|
8.12
|
31.50
|
26.00
|
2.63
|
8.00
|
<0.1
|
<0.01
|
|
NF2
|
15/02/2026
|
Sunny
|
Moderate
|
Mid-Ebb
|
Middle
|
5
|
3:34:00
PM
|
9.28
|
8.12
|
31.52
|
26.00
|
2.67
|
<2.5
|
<0.1
|
<0.01
|
|
NF2
|
15/02/2026
|
Sunny
|
Moderate
|
Mid-Ebb
|
Middle
|
5
|
3:34:00 PM
|
9.27
|
8.12
|
31.51
|
26.00
|
2.65
|
3.00
|
<0.1
|
<0.01
|
|
NF2
|
15/02/2026
|
Sunny
|
Moderate
|
Mid-Ebb
|
Bottom
|
10
|
3:33:00
PM
|
9.26
|
8.12
|
31.51
|
26.00
|
2.52
|
3.00
|
<0.1
|
<0.01
|
|
NF2
|
15/02/2026
|
Sunny
|
Moderate
|
Mid-Ebb
|
Bottom
|
10
|
3:33:00 PM
|
9.25
|
8.12
|
31.53
|
26.00
|
2.57
|
6.00
|
<0.1
|
<0.01
|
|
NF3
|
15/02/2026
|
Sunny
|
Moderate
|
Mid-Ebb
|
Surface
|
1
|
3:43:00
PM
|
8.92
|
8.06
|
32.29
|
25.30
|
2.29
|
<2.5
|
<0.1
|
<0.01
|
|
NF3
|
15/02/2026
|
Sunny
|
Moderate
|
Mid-Ebb
|
Surface
|
1
|
3:43:00 PM
|
8.97
|
8.06
|
32.27
|
25.30
|
2.16
|
<2.5
|
<0.1
|
<0.01
|
|
NF3
|
15/02/2026
|
Sunny
|
Moderate
|
Mid-Ebb
|
Middle
|
6
|
3:42:00
PM
|
8.90
|
8.06
|
32.33
|
25.30
|
2.21
|
<2.5
|
<0.1
|
<0.01
|
|
NF3
|
15/02/2026
|
Sunny
|
Moderate
|
Mid-Ebb
|
Middle
|
6
|
3:42:00 PM
|
8.95
|
8.06
|
32.26
|
25.30
|
2.34
|
<2.5
|
<0.1
|
<0.01
|
|
NF3
|
15/02/2026
|
Sunny
|
Moderate
|
Mid-Ebb
|
Bottom
|
11
|
3:41:00
PM
|
8.89
|
8.06
|
32.26
|
25.30
|
2.31
|
<2.5
|
<0.1
|
<0.01
|
|
NF3
|
15/02/2026
|
Sunny
|
Moderate
|
Mid-Ebb
|
Bottom
|
11
|
3:41:00 PM
|
8.95
|
8.06
|
32.33
|
25.30
|
2.32
|
<2.5
|
<0.1
|
<0.01
|
Water
Supplies Department
CE8/2015 First Stage of Desalination Plant at TKO Operation
Phase Fisheries Monitoring
APPENDIX F
CALIBRATION CERTIFICATE